
SM Energy (SM)
SM Energy is a world-class company. Its combination of extraordinary growth and robust profitability makes it a beloved asset.― StockStory Analyst Team
1. News
2. Summary
Why We Like SM Energy
Operating across three key regions with over 328,000 net acres under its control, SM Energy (NYSE:SM) explores for, develops, and produces oil, natural gas, and natural gas liquids primarily from shale formations in Texas and Utah.
- Highly-profitable operating model results in strong unit economics and a best-in-class gross margin of 88.3%
- Healthy EBITDA margin shows it’s a well-run company with efficient processes, and its operating leverage amplified its profits over the last five years
- EBITDA profits increased over the last five years as the company gained some leverage on its fixed costs and became more efficient


SM Energy is a top-tier company. The valuation seems fair when considering its quality, and we think now is an opportune time to buy the stock.
Why Is Now The Time To Buy SM Energy?


SM Energy’s stock price of $32.77 implies a valuation ratio of 7x forward P/E. The valuation sure appears attractive, and we suspect the stock is trading below its intrinsic value when factoring in its business quality.
Our eyes light up when companies with elite fundamentals trade at bargain prices because shareholders can benefit from both earnings growth and a positive re-rating - a powerful one-two punch.
3. SM Energy (SM) Research Report: Q4 CY2025 Update
Oil and gas producer SM Energy (NYSE:SM) fell short of the market’s revenue expectations in Q4 CY2025, with sales falling 17.3% year on year to $705 million. Its non-GAAP profit of $0.83 per share was in line with analysts’ consensus estimates.
SM Energy (SM) Q4 CY2025 Highlights:
- Revenue: $705 million vs analyst estimates of $739.5 million (17.3% year-on-year decline, 4.7% miss)
- Adjusted EPS: $0.83 vs analyst estimates of $0.83 (in line)
- Adjusted EBITDA: $476.3 million vs analyst estimates of $504.8 million (67.6% margin, 5.6% miss)
- Operating Margin: 25.8%, down from 33.7% in the same quarter last year
- Free Cash Flow Margin: 27.7%, similar to the same quarter last year
- Oil production per day: up 1.4% year on year
- Market Capitalization: $7.51 billion
Company Overview
Operating across three key regions with over 328,000 net acres under its control, SM Energy (NYSE:SM) explores for, develops, and produces oil, natural gas, and natural gas liquids primarily from shale formations in Texas and Utah.
The company's operations span three distinct geographic areas, each with unique geological characteristics. In West Texas's Midland Basin, which is part of the broader Permian Basin, SM Energy holds approximately 110,000 net acres across Howard, Martin, Upton, Midland, and Dawson counties. Here, the company drills into multiple oil-rich layers including the Spraberry, Wolfcamp, and Woodford Barnett formations—geological zones formed millions of years ago that now contain substantial hydrocarbon deposits.
In South Texas's Maverick Basin, SM Energy operates roughly 155,000 net acres in Dimmit and Webb counties, targeting both the Austin Chalk formation and the Eagle Ford shale. This acreage position covers different production windows—areas where the geological conditions produce either oil, gas-condensate (a mix of liquid and gas), or dry gas. The gas composition in this region is suitable for processing to extract natural gas liquids (NGLs), which are valuable hydrocarbons like ethane, propane, and butane used in petrochemicals and heating.
The company's newest asset, acquired in late 2024, is in Utah's Uinta Basin, where it holds approximately 63,300 net acres. This region produces waxy crude oil and gas from the Lower Green River and Wasatch formations. Some of this acreage sits on federal lands leased through the Bureau of Land Management.
SM Energy generates revenue by selling the oil, natural gas, and NGLs it produces to various buyers. The company employs drilling rigs and hydraulic fracturing (fracking) techniques to access these underground resources, using horizontal drilling to maximize contact with the productive rock layers.
4. Mixed or Offshore Upstream E&P
This category includes smaller or niche E&P companies operating in specialized basins, geographies, or resource types outside major classifications. These firms may target unconventional resources, frontier regions, or specific commodity niches. Tailwinds include potential for outsized returns from successful exploration, acquisition opportunities during industry downturns, and specialized expertise commanding premium valuations. Headwinds include higher operational and geological risks, limited scale reducing negotiating power and cost efficiencies, and constrained capital market access during challenging commodity environments. Regulatory risks and ESG concerns may disproportionately affect smaller operators with fewer resources for compliance.
SM Energy's competitors include other independent oil and gas producers operating in similar basins, such as Diamondback Energy (NASDAQ:FANG), Matador Resources (NYSE:MTDR), Civitas Resources (NYSE:CIVI), and Ovintiv (NYSE:OVV).
5. Economies of Scale
In Energy, scale separates fragile single-asset producers from platform-style businesses that generate revenue across entire basins and infrastructure networks. SM Energy’s $3.15 billion of revenue in the last year lacks scale in an industry where it matters.
6. Revenue Growth
Cyclical industries such as Energy can make mediocre companies look great for a time, but a long-term view reveals which businesses can actually withstand and adapt to changing conditions. Thankfully, SM Energy’s 22.9% annualized revenue growth over the last five years was exceptional. Its growth surpassed the average energy upstream and integrated energy company and shows its offerings resonate with customers, a great starting point for our analysis.
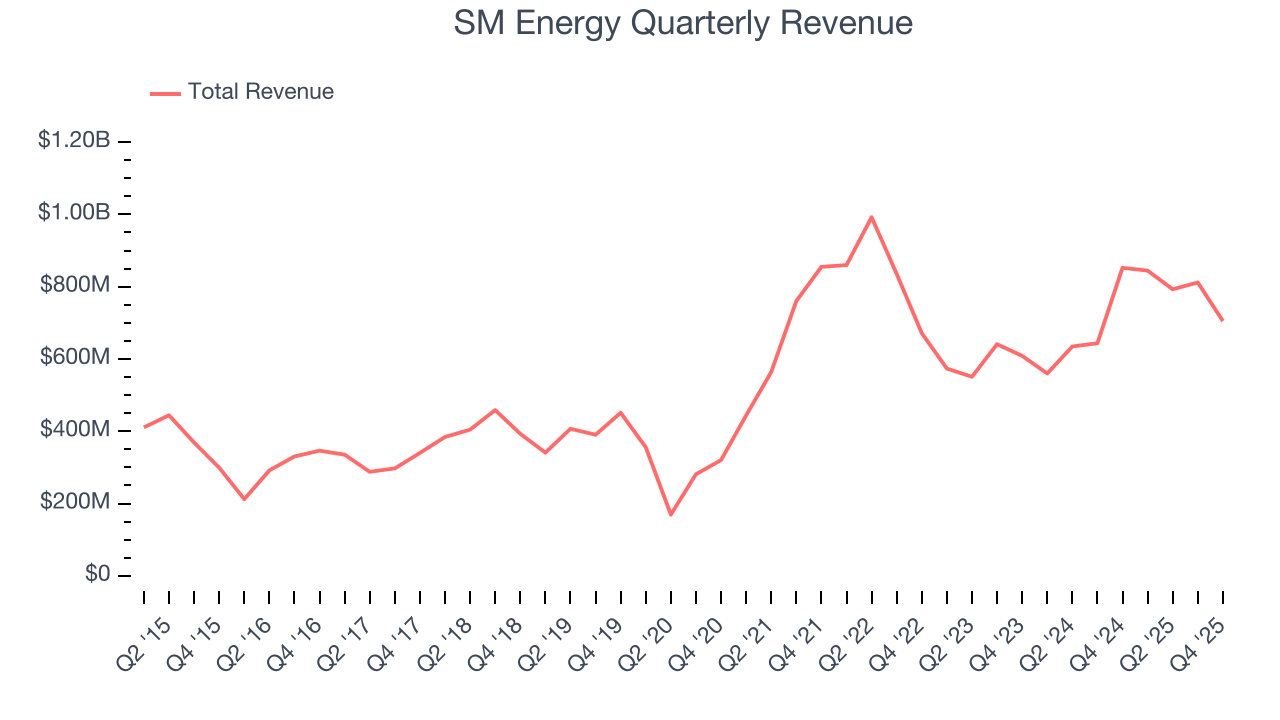
Even a long stretch in Energy can be shaped by a single commodity cycle, so extending the view to ten years adds another perspective and reveals which companies are built to grow regardless of the pricing regime. SM Energy’s annualized revenue growth of 7.6% over the last ten years is below its five-year trend, but we still think the results suggest decent demand.
While looking at revenue is important, it can also introduce noise around commodity prices and M&A. Analyzing drivers of revenue, on the other hand, highlights what is happening inside the asset base and whether the economic footprint of a company is expanding. Over the last two years, SM Energy’s oil production per day averaged 32.7% year-on-year growth while its natural gas production per day averaged 6.9% year-on-year growth. 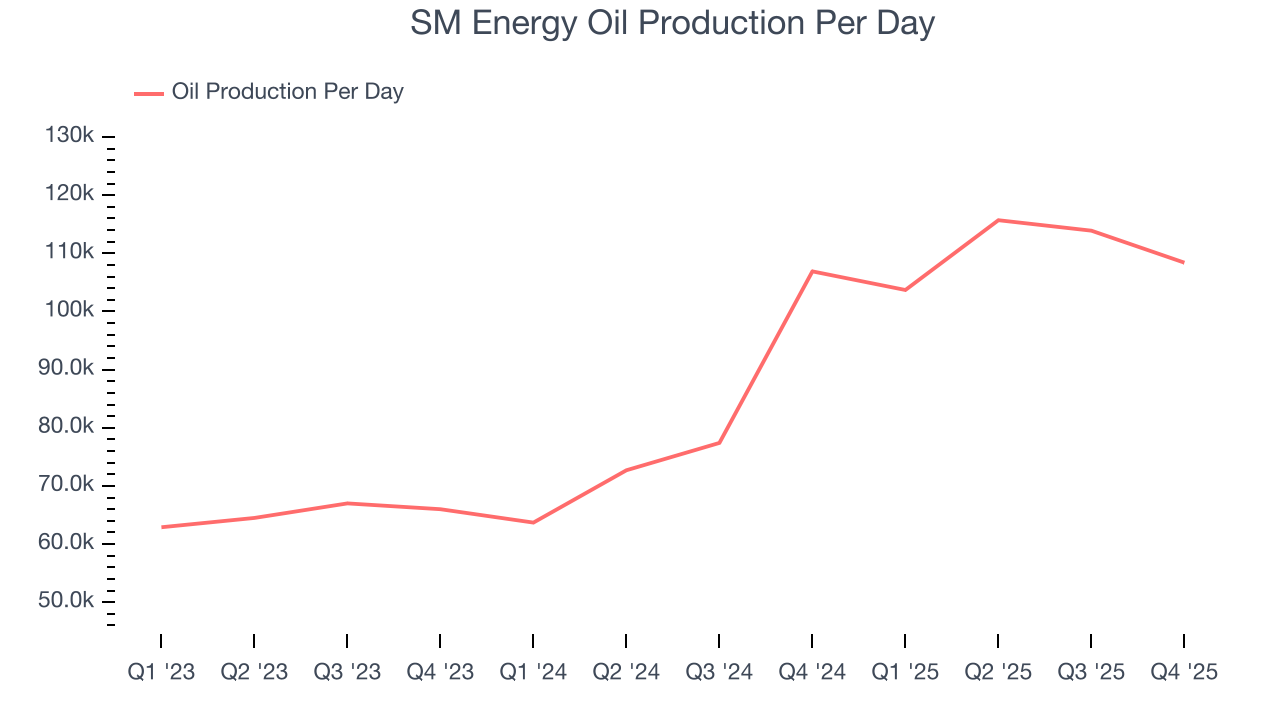
This quarter, SM Energy missed Wall Street’s estimates and reported a rather uninspiring 17.3% year-on-year revenue decline, generating $705 million of revenue. This quarter, SM Energy reported modest year-on-year Oil production per day growth of 1.4%.
7. Gross Margin
In any given year, energy gross margins are heavily influenced by prices, hedging, and cost inflation, but over a full cycle these gross margins reveal which producers are structurally advantaged through superior “rock” quality, infrastructure access, and cost position.
SM Energy, which averaged 88.3% gross margin over the last five years, exhibits enviable unit economics in the sector. It means the company will remain profitable at lower commodity prices than peers with inferior gross margins and serves as an advantaged starting point for ultimate operating profits and free cash flow generation. 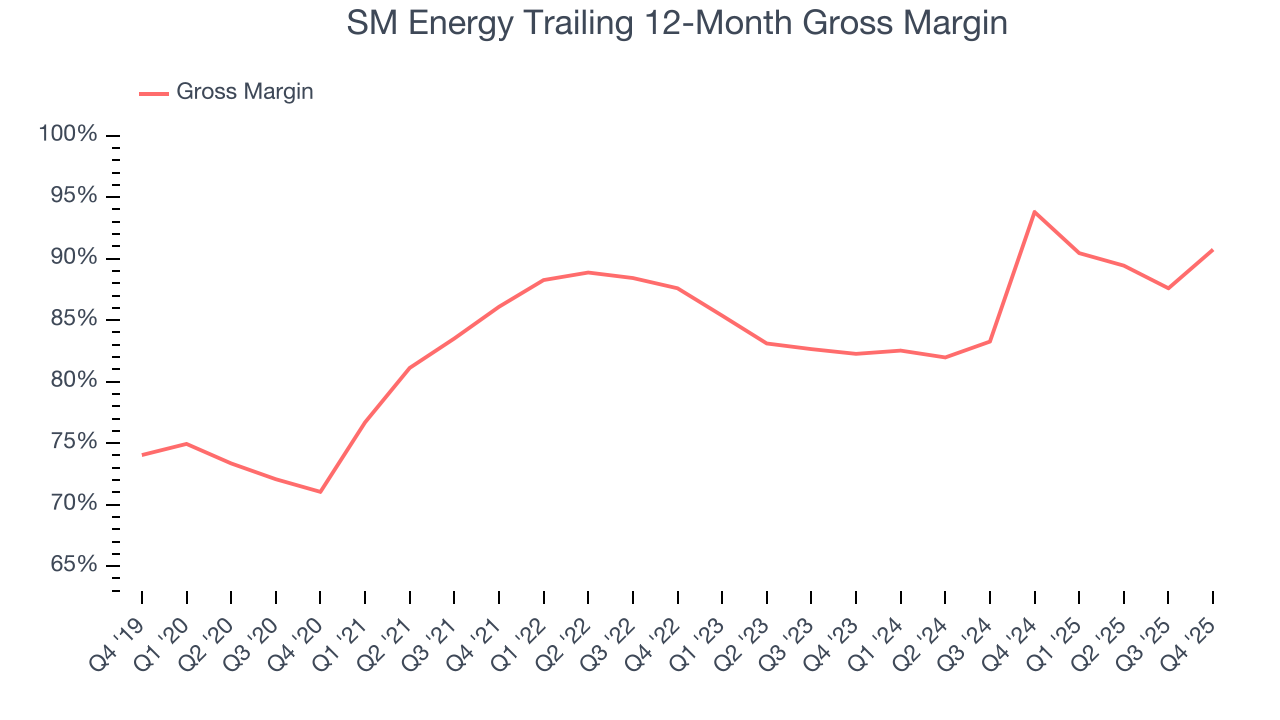
SM Energy produced a 136% gross profit margin in Q4, up 20.1 percentage points year on year.
8. Adjusted EBITDA Margin
SM Energy has been a well-oiled machine over the last five years. It demonstrated elite profitability for an upstream and integrated energy business, boasting an average EBITDA margin of 61.6%.
Looking at the trend in its profitability, SM Energy’s EBITDA margin rose by 23.9 percentage points over the last year, as its sales growth gave it immense operating leverage.
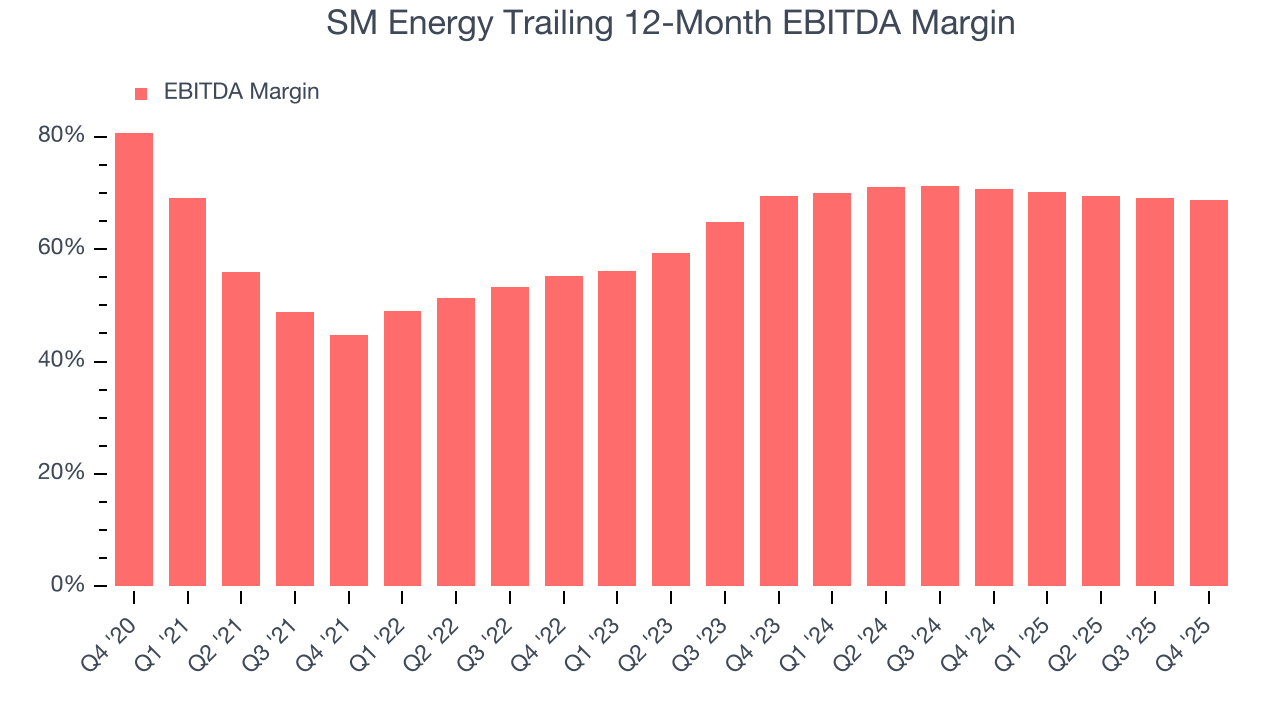
This quarter, SM Energy generated an EBITDA margin profit margin of 67.6%, down 1.6 percentage points year on year. This reduction is quite minuscule and indicates the company’s overall cost structure has been relatively stable. This adjusted EBITDA fell short of Wall Street’s estimates.
9. Cash Is King
As mentioned above, adjusted EBITDA ignores capital structure and drilling expenditure decisions. These are two huge aspects of an Energy producer, so in order to understand a comprehensive picture of business quality, an investor needs to account for these. Said differently, adjusted EBITDA margins could be solid but free cash flow is abysmal because decline rates of the asset are extreme and the drilling is expensive. Free cash flow tells you about not only the economics of the production that has happened but how much it costs to stay in business as well (further drilling or extraction).
SM Energy has shown terrific cash profitability, driven by its lucrative business model that enables it to reinvest, return capital to investors, and stay ahead of the competition. The company’s free cash flow margin was among the best in the energy upstream and integrated energy sector, averaging 20.4% over the last five years.
While the level of free cash flow margins is important, their consistency matters just as much.
SM Energy’s ratio of quarterly free cash flow volatility to WTI Crude price volatility over the past five years was 4 (lower is better), indicating unusually strong insulation from commodity swings. This stability supports superior capital access in downturns and positions SM Energy to act as a consolidator when weaker peers are forced to retrench.
You may be asking why we wait until the free cash flow line to perform this stability analysis versus commodity prices. Why not compare revenue or EBITDA to WTI Crude prices in the case of SM Energy? Because what ultimately matters is not how much revenue or profit you earn when prices are high but how much cash you can generate when prices are low. Free cash flow is the superior metric because it includes everything from hedging prowess to growth and maintenance capex to management behavior during good times and bad.
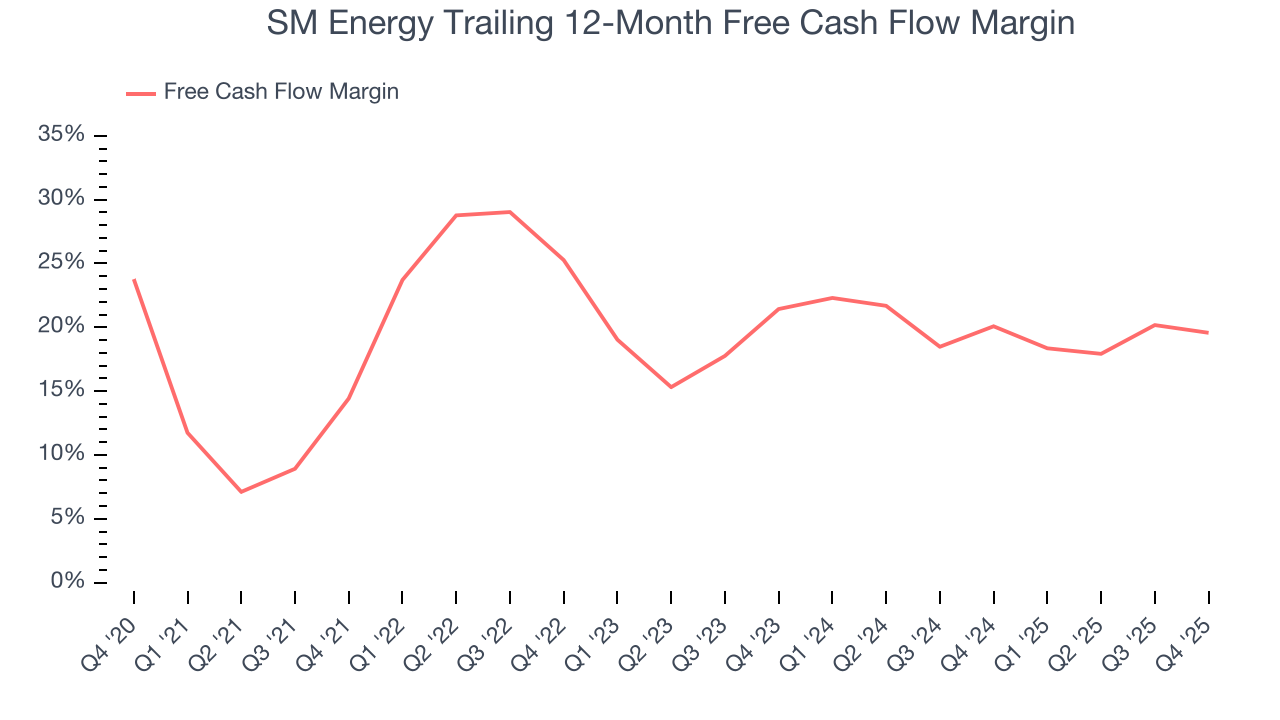
SM Energy’s free cash flow clocked in at $195.3 million in Q4, equivalent to a 27.7% margin. This cash profitability was in line with the comparable period last year and above its five-year average.
10. Return on Invested Capital (ROIC)
Free cash flow tells investors how much money an Energy producer made, and ROIC takes this one step further by telling investors how well and effectively the business made it. ROIC illustrates how much operating profit a producer generated relative to the money it has raised (debt and equity).
We at StockStory like to look at ROIC over a ten-year period because energy investment cycles can involve up to five years of ramping production and another five years of harvesting. A decade view captures buying, extracting, and monetizing rather than just part of that picture. Although SM Energy has shown solid fundamentals lately, it historically did a mediocre job investing in profitable growth initiatives. Its ten-year average ROIC was 6.2%, somewhat low compared to the best energy upstream and integrated energy companies that consistently pump out 25%+.
We like to invest in businesses with high returns, but the trend in a company’s ROIC is what often surprises the market and moves the stock price. Over the last few years, SM Energy’s ROIC has unfortunately decreased. If its returns keep falling, it could suggest its profitable growth opportunities are drying up. We’ll keep a close eye.
11. Balance Sheet Assessment
SM Energy reported $368 million of cash and $2.72 billion of debt on its balance sheet in the most recent quarter. As investors in high-quality companies, we primarily focus on two things: 1) that a company’s debt level isn’t too high and 2) that its interest payments are not excessively burdening the business.
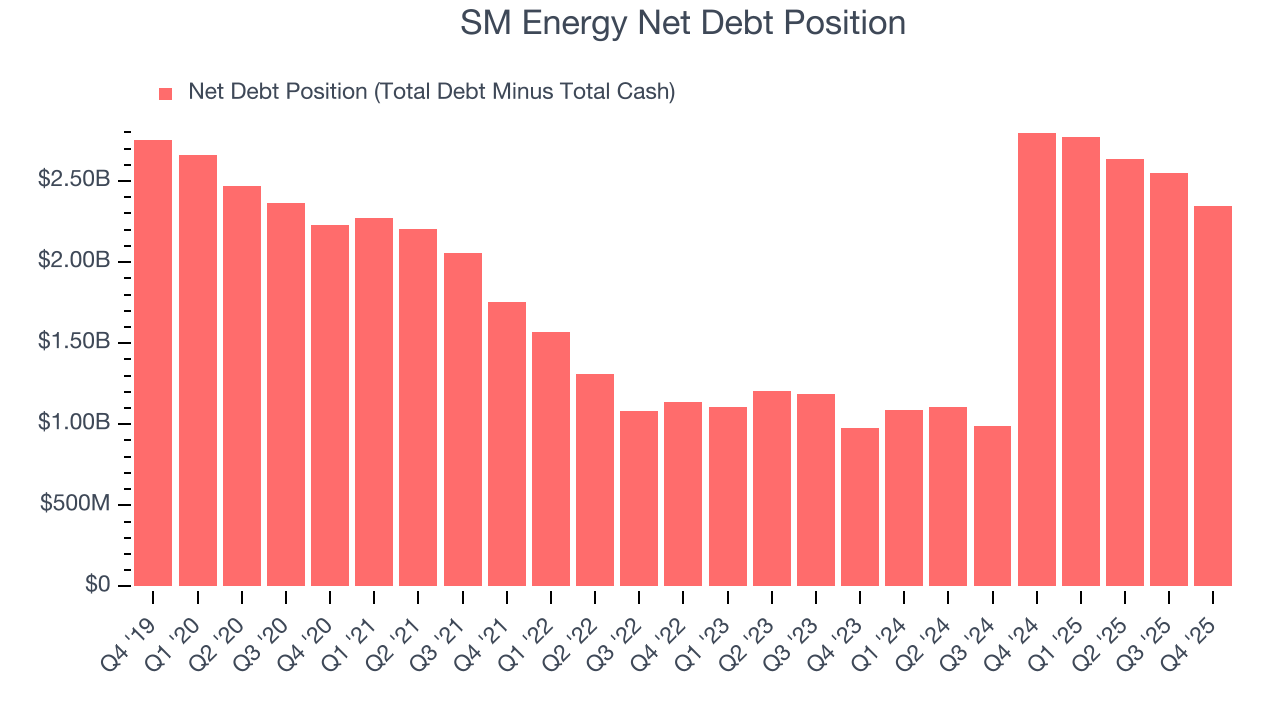
With $2.17 billion of EBITDA over the last 12 months, we view SM Energy’s 1.1× net-debt-to-EBITDA ratio as safe. We also see its $170 million of annual interest expenses as appropriate. The company’s profits give it plenty of breathing room, allowing it to continue investing in growth initiatives.
12. Key Takeaways from SM Energy’s Q4 Results
We struggled to find many positives in these results. Its revenue missed and its EBITDA fell short of Wall Street’s estimates. Overall, this was a softer quarter. The stock traded up 4.8% to $33.03 immediately after reporting.
13. Is Now The Time To Buy SM Energy?
Updated: March 28, 2026 at 1:16 AM EDT
We think that the latest earnings result is only one piece of the bigger puzzle. If you’re deciding whether to own SM Energy, you should also grasp the company’s longer-term business quality and valuation.
There is a lot to like about SM Energy. To begin with, its revenue growth over the last five years was top-tier for the sector, and its growth over the next 12 months is expected to accelerate. On top of that, its admirable gross margin indicates excellent unit economics, and its impressive EBITDA margins show it has a highly efficient business model.
SM Energy’s P/E ratio based on the next 12 months is 7x. Scanning the energy upstream and integrated energy landscape today, SM Energy’s fundamentals clearly illustrate that it’s an elite business, and we love it at this bargain price. Opportunities like this are rare.
Wall Street analysts have a consensus one-year price target of $31.17 on the company (compared to the current share price of $32.77).