
Magnolia Oil & Gas (MGY)
Magnolia Oil & Gas catches our eye. Its fusion of high growth and profitability makes it an asset with nice upside.― StockStory Analyst Team
1. News
2. Summary
Why Magnolia Oil & Gas Is Interesting
Operating over 600,000 net acres primarily in two distinct South Texas regions, Magnolia Oil & Gas (NYSE:MGY) drills and produces oil, natural gas, and natural gas liquids from South Texas formations.
- Attractive asset base leads to wonderful unit economics and a best-in-class gross margin of 84.8%
- Disciplined cost controls and effective management have materialized in a strong EBITDA margin
- A drawback is its costs have risen faster than its revenue over the last five years, causing its EBITDA margin to decline by 6.7 percentage points


Magnolia Oil & Gas shows some potential. If you like the story, the valuation seems reasonable.
Why Is Now The Time To Buy Magnolia Oil & Gas?


Magnolia Oil & Gas is trading at $29.97 per share, or 15.4x forward P/E. This multiple is lower than most energy upstream and integrated energy companies, and we think the valuation is reasonable for the quality you get.
If you think the market is not giving the company enough credit for its fundamentals, now could be a good time to invest.
3. Magnolia Oil & Gas (MGY) Research Report: Q4 CY2025 Update
Oil and gas producer Magnolia Oil & Gas (NYSE:MGY) beat Wall Street’s revenue expectations in Q4 CY2025, but sales fell by 2.8% year on year to $317.6 million. Its non-GAAP profit of $0.38 per share was 4.5% above analysts’ consensus estimates.
Magnolia Oil & Gas (MGY) Q4 CY2025 Highlights:
- Revenue: $317.6 million vs analyst estimates of $314 million (2.8% year-on-year decline, 1.2% beat)
- Adjusted EPS: $0.38 vs analyst estimates of $0.36 (4.5% beat)
- Adjusted EBITDA: $208.3 million vs analyst estimates of $210.9 million (65.6% margin, 1.2% miss)
- Operating Margin: 29.6%, down from 38% in the same quarter last year
- Free Cash Flow Margin: 28.2%, up from 26.9% in the same quarter last year
- Market Capitalization: $5.29 billion
Company Overview
Operating over 600,000 net acres primarily in two distinct South Texas regions, Magnolia Oil & Gas (NYSE:MGY) drills and produces oil, natural gas, and natural gas liquids from South Texas formations.
The company focuses its drilling operations on two geological formations: the Eagle Ford Shale and the Austin Chalk, both of which contain significant hydrocarbon deposits. These formations are located in the Karnes and Giddings areas of South Texas, spanning counties like Karnes, Gonzales, Brazos, Burleson, and Lee. The Eagle Ford Shale is particularly known as a prolific oil-producing zone, while the Austin Chalk formation, which overlays the Eagle Ford in some areas, has proven to be an independent reservoir with attractive development potential.
The company extracts these resources through horizontal drilling and hydraulic fracturing, operating rigs that drill wells into these formations thousands of feet below the surface. Once extracted, the production is roughly balanced across different hydrocarbons: oil makes up approximately 43% of production, natural gas around 30%, and natural gas liquids (NGLs)—such as propane and butane—about 27%.
After production, Magnolia relies on third-party infrastructure to move and sell its output. In the Karnes area, crude oil flows through a gathering system operated by Ironwood Eagle Ford Midstream, which delivers the oil via pipeline to refineries and purchasers. Natural gas from both regions is gathered and processed by third-party midstream companies that extract valuable NGLs before selling the remaining natural gas to various markets. Oil from the Giddings area is typically transported by truck to purchasers. The company generates revenue by selling oil, natural gas, and NGLs to various third-party purchasers and processors under contracts typically lasting 12 months or less.
4. Mixed or Offshore Upstream E&P
This category includes smaller or niche E&P companies operating in specialized basins, geographies, or resource types outside major classifications. These firms may target unconventional resources, frontier regions, or specific commodity niches. Tailwinds include potential for outsized returns from successful exploration, acquisition opportunities during industry downturns, and specialized expertise commanding premium valuations. Headwinds include higher operational and geological risks, limited scale reducing negotiating power and cost efficiencies, and constrained capital market access during challenging commodity environments. Regulatory risks and ESG concerns may disproportionately affect smaller operators with fewer resources for compliance.
Magnolia Oil & Gas competes with other independent oil and gas producers focused on the Eagle Ford Shale and South Texas, including EOG Resources (NYSE:EOG), Marathon Oil (NYSE:MRO), and Matador Resources (NYSE:MTDR).
5. Revenue Scale
The size of the revenue base is a way to assess topline, and it tells an investor whether an Energy producer has crossed the line between being a more vulnerable commodity taker and a durable operating platform. Scaled businesses tend to produce and generate revenue from many wells, pads, takeaway routes, and geographies, not just a single field or drilling program. Magnolia Oil & Gas’s $1.31 billion of revenue in the last year is pretty small for the industry, suggesting the company hasn’t hit a level of diversification where investors can sleep easy at night. is a small company in an industry where scale matters.
6. Revenue Growth
A company’s long-term performance can give signals about its business quality. Even a bad business, especially in a cyclical industry, can shine for a year or so, but a top-tier one should exhibit resilience through cycles. Luckily, Magnolia Oil & Gas’s sales grew at an excellent 19.7% compounded annual growth rate over the last five years. Its growth beat the average energy upstream and integrated energy company and shows its offerings resonate with customers, a helpful starting point for our analysis.
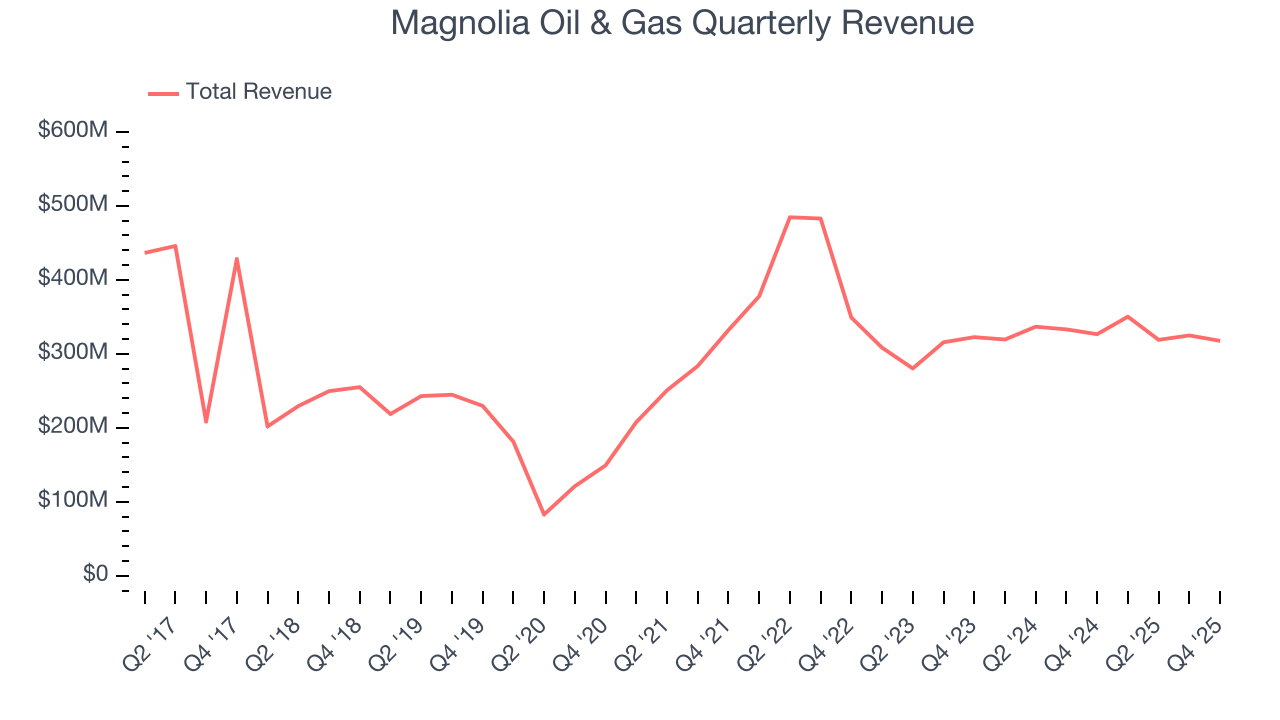
Even a long stretch in Energy can be shaped by a single commodity cycle, so extending the view to ten years adds another perspective and reveals which companies are built to grow regardless of the pricing regime. Magnolia Oil & Gas’s ten year performance marks a sharp pivot from its five-year trend as its revenue has shown annualized declines of 1.8% over the last eight years.
Revenue provides useful context, but it is heavily influenced by commodity prices and acquisitions. Production volumes, by contrast, reveal whether the underlying asset base is actually growing. Over the last two years, Magnolia Oil & Gas’s total oil volume per day - Upstream averaged 7.5% year-on-year growth while natural gas volume per day - Upstream averaged 12.4% year-on-year growth, which was good. 
This quarter, Magnolia Oil & Gas’s revenue fell by 2.8% year on year to $317.6 million but beat Wall Street’s estimates by 1.2%. This quarter, Magnolia Oil & Gas reported modest year-on-year production growth of 4.9% but beat Wall Street’s estimates by 0.8%.
7. Gross Margin
In any given year, energy gross margins are heavily influenced by prices, hedging, and cost inflation, but over a full cycle these gross margins reveal which producers are structurally advantaged through superior “rock” quality, infrastructure access, and cost position.
Magnolia Oil & Gas, which averaged 84.8% gross margin over the last five years, exhibits impressive unit economics in the sector. It means the company will remain profitable at lower commodity prices than peers with inferior gross margins and serves as an excellent starting point for ultimate operating profits and free cash flow generation. 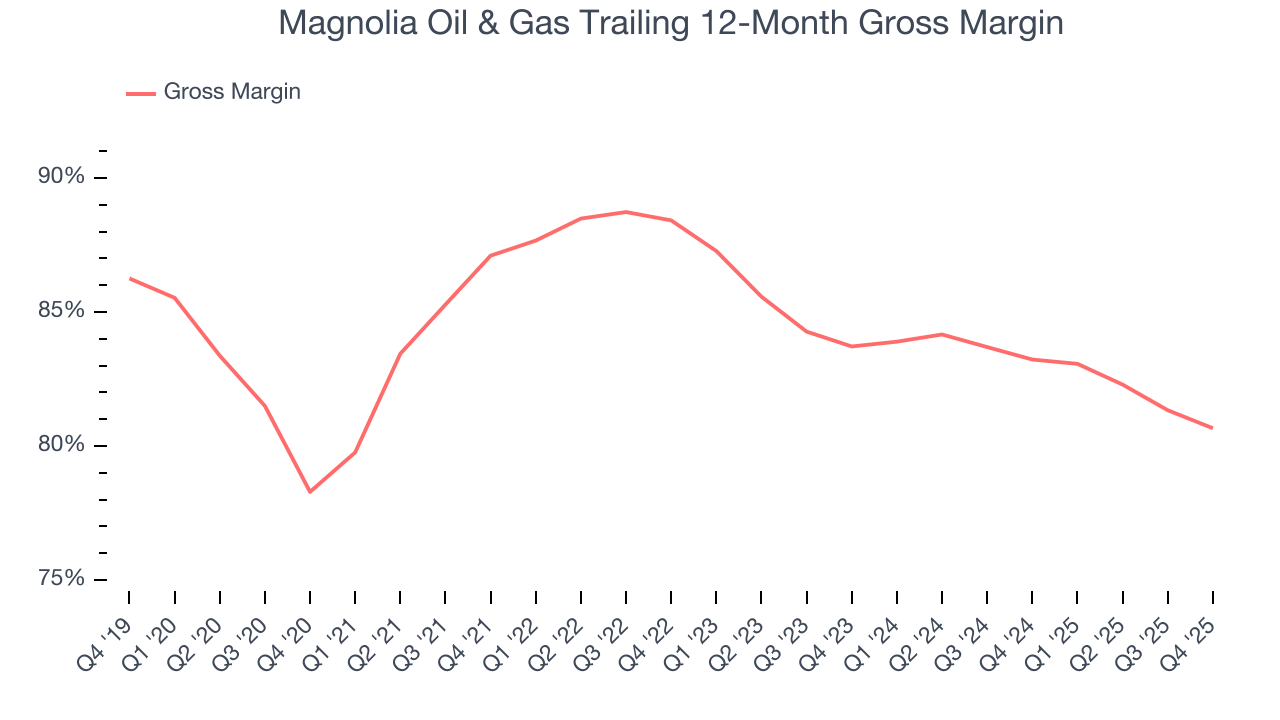
Magnolia Oil & Gas produced a 79.5% gross profit margin in Q4, down 2.8 percentage points year on year.
8. Adjusted EBITDA Margin
Magnolia Oil & Gas has been a well-oiled machine over the last five years. It demonstrated elite profitability for an upstream and integrated energy business, boasting an average EBITDA margin of 72%.
Analyzing the trend in its profitability, Magnolia Oil & Gas’s EBITDA margin decreased by 6.7 percentage points over the last year. Even though its historical margin was healthy, shareholders will want to see Magnolia Oil & Gas become more profitable in the future.
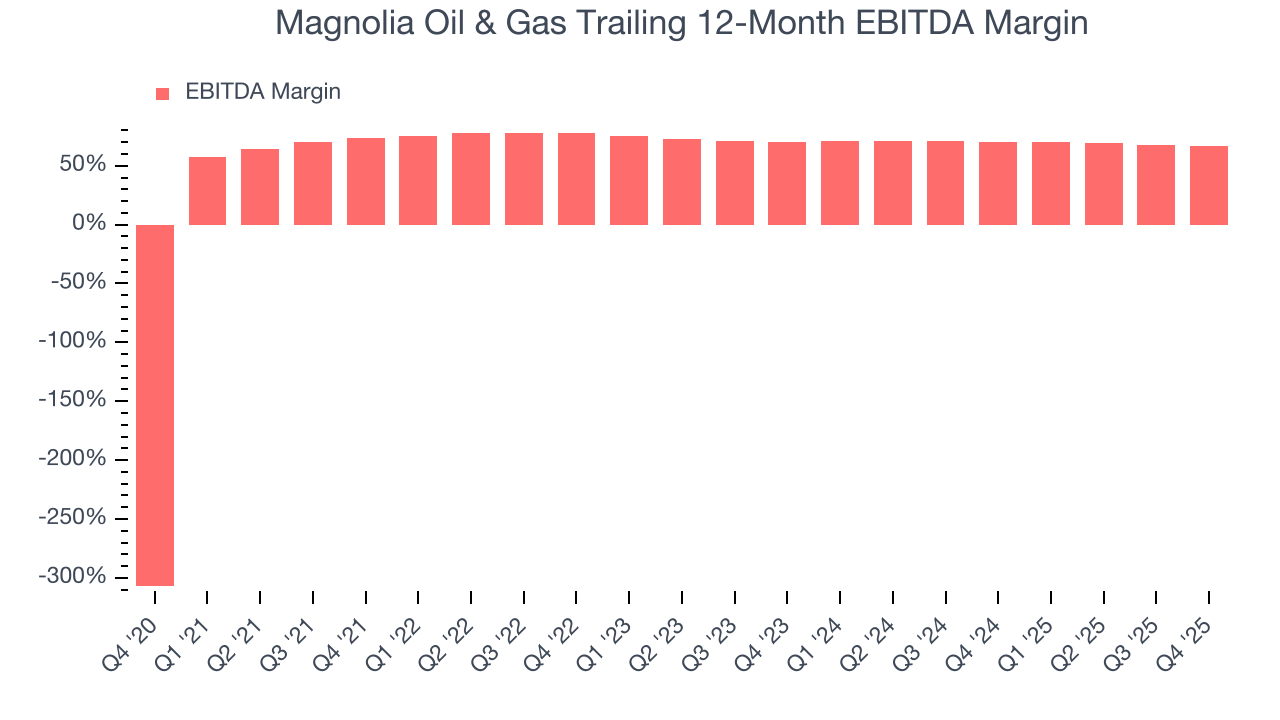
This quarter, Magnolia Oil & Gas generated an EBITDA margin profit margin of 65.6%, down 4.7 percentage points year on year. This contraction shows it was less efficient because its expenses increased relative to its revenue. This adjusted EBITDA fell short of Wall Street’s estimates.
9. Cash Is King
As mentioned above, adjusted EBITDA ignores capital structure and drilling expenditure decisions. These are two huge aspects of an Energy producer, so in order to understand a comprehensive picture of business quality, an investor needs to account for these. Said differently, adjusted EBITDA margins could be solid but free cash flow is abysmal because decline rates of the asset are extreme and the drilling is expensive. Free cash flow tells you about not only the economics of the production that has happened but how much it costs to stay in business as well (further drilling or extraction).
Magnolia Oil & Gas has shown terrific cash profitability, driven by its lucrative business model that enables it to reinvest, return capital to investors, and stay ahead of the competition. The company’s free cash flow margin was among the best in the energy upstream and integrated energy sector, averaging an eye-popping 40.1% over the last five years.
The level of free cash flow is important, but its durability across cycles is just as critical. Consistent margins are far more valuable than volatile swings driven by commodity prices.
Magnolia Oil & Gas’s ratio of quarterly free cash flow volatility to WTI crude price volatility over the past five years was 2.7 (lower is better), indicating excellent insulation from commodity swings. This stability supports superior capital access in downturns and positions Magnolia Oil & Gas to act as a consolidator when weaker peers are forced to retrench.
You may be asking why we wait until the free cash flow line to perform this stability analysis versus commodity prices. Why not compare revenue or EBITDA to WTI in the case of Magnolia Oil & Gas? Because what ultimately matters is not how much revenue or profit you earn when prices are high but how much cash you can generate when prices are low. Free cash flow is the superior metric because it includes everything from hedging prowess to growth and maintenance capex to management behavior during good times and bad.
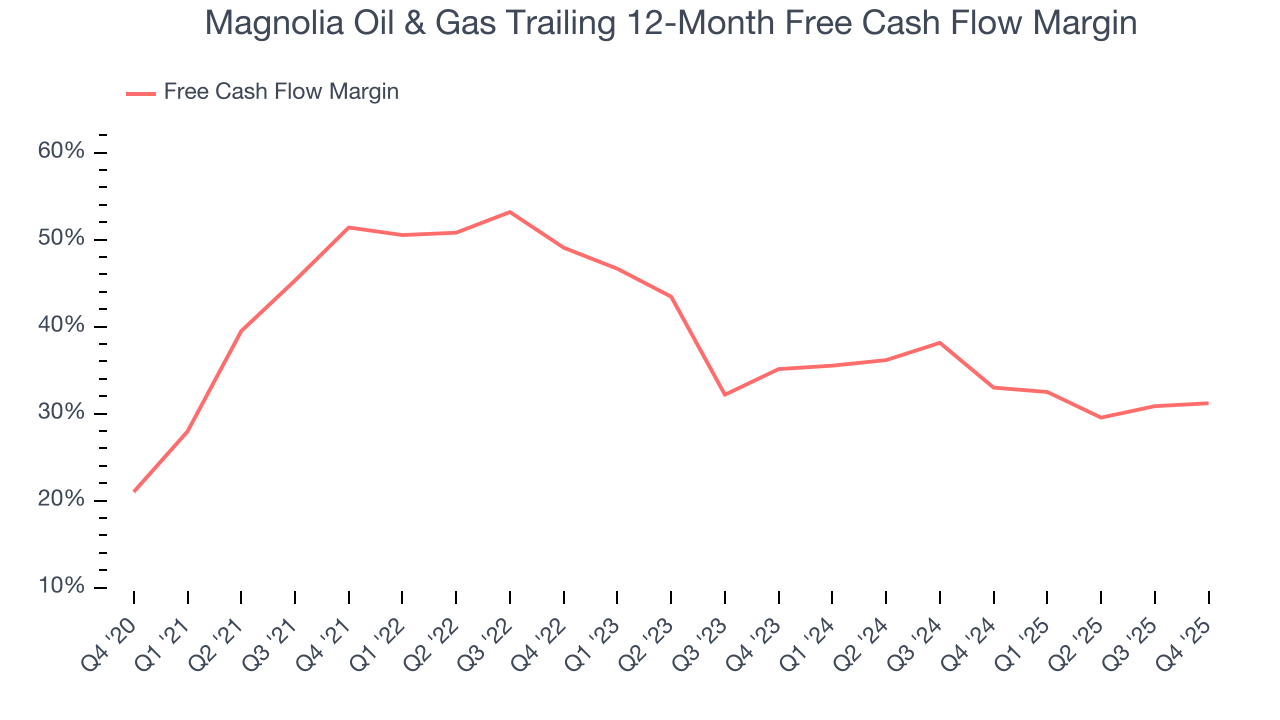
Magnolia Oil & Gas’s free cash flow clocked in at $89.42 million in Q4, equivalent to a 28.2% margin. This result was good as its margin was 1.3 percentage points higher than in the same quarter last year, but we note it was lower than its five-year cash profitability. Nevertheless, we wouldn’t put too much weight on a single quarter because investment needs can be seasonal, causing short-term swings. Long-term trends carry greater meaning.
10. Return on Invested Capital (ROIC)
Free cash flow shows how much money a producer generated, while ROIC shows how efficiently that money was earned. ROIC measures the operating profit produced for each dollar of capital invested, whether from debt or equity. Cash generation measures quantity while ROIC measures the quality of value creation.
We at StockStory like to look at ROIC over a ten-year period because energy investment cycles can involve up to five years of ramping production and another five years of harvesting. A decade view captures buying, extracting, and monetizing rather than just part of that picture. Magnolia Oil & Gas’s nine-year average ROIC was 36.7%, placing it among the best energy upstream and integrated energy companies. This illustrates its management team’s ability to invest in highly profitable ventures and produce tangible results for shareholders.
We like to invest in businesses with high returns, but the trend in a company’s ROIC is what often surprises the market and moves the stock price. Over the last few years, Magnolia Oil & Gas’s ROIC has unfortunately decreased significantly. Only time will tell if its new bets can bear fruit and potentially reverse the trend.
11. Balance Sheet Assessment
Magnolia Oil & Gas reported $266.8 million of cash and $411.5 million of debt on its balance sheet in the most recent quarter. As investors in high-quality companies, we primarily focus on two things: 1) that a company’s debt level isn’t too high and 2) that its interest payments are not excessively burdening the business.
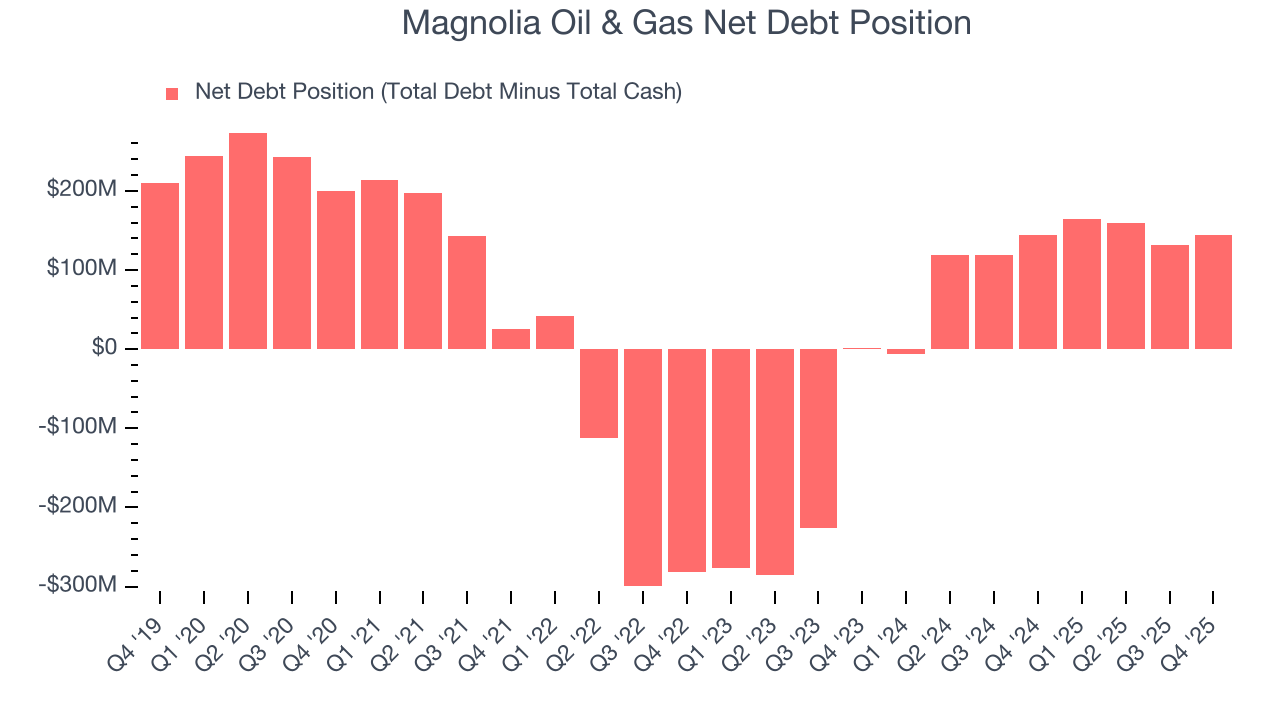
With $876.9 million of EBITDA over the last 12 months, we view Magnolia Oil & Gas’s 0.2× net-debt-to-EBITDA ratio as safe. We also see its $21.62 million of annual interest expenses as appropriate. The company’s profits give it plenty of breathing room, allowing it to continue investing in growth initiatives.
12. Key Takeaways from Magnolia Oil & Gas’s Q4 Results
It was good to see Magnolia Oil & Gas narrowly top analysts’ revenue expectations this quarter. We were also glad its EPS outperformed Wall Street’s estimates. On the other hand, its EBITDA slightly missed. Zooming out, we think this was a mixed quarter. The stock remained flat at $29.21 immediately following the results.
13. Is Now The Time To Buy Magnolia Oil & Gas?
Updated: March 18, 2026 at 1:08 AM EDT
A common mistake we notice when investors are deciding whether to buy a stock or not is that they simply look at the latest earnings results. Business quality and valuation matter more, so we urge you to understand these dynamics as well.
There are things to like about Magnolia Oil & Gas. To kick things off, its revenue growth over the last five years was impressive for the sector. And while its declining EBITDA margin shows the business has become less efficient, its admirable gross margin indicates excellent unit economics. On top of that, its impressive EBITDA margins show it has a highly efficient business model.
Magnolia Oil & Gas’s P/E ratio based on the next 12 months is 15.4x. Looking at the energy upstream and integrated energy landscape right now, Magnolia Oil & Gas trades at a pretty interesting price. If you believe in the company and its growth potential, now is an opportune time to buy shares.
Wall Street analysts have a consensus one-year price target of $30.17 on the company (compared to the current share price of $29.97).