
Peabody Energy (BTU)
Peabody Energy keeps us up at night. Its poor sales growth and falling returns on capital suggest its growth opportunities are shrinking.― StockStory Analyst Team
1. News
2. Summary
Why We Think Peabody Energy Will Underperform
Beginning with a single wagon hauling coal in Illinois back when Grover Cleveland was president, Peabody Energy (NYSE:BTU) mines coal used by electricity generators and steel manufacturers.
- Expenses have increased as a percentage of revenue over the last five years as its EBITDA margin fell by 15.8 percentage points
- Gross margin of 25.1% reflects its high production costs and unfavorable asset base
- Sales tumbled by 3.7% annually over the last ten years, showing market trends are working against its favor during this cycle


Peabody Energy doesn’t meet our quality standards. There are superior stocks for sale in the market.
Why There Are Better Opportunities Than Peabody Energy


At $35.18 per share, Peabody Energy trades at 10.5x forward P/E. This multiple is cheaper than most energy upstream and integrated energy peers, but we think this is justified.
It’s better to pay up for high-quality businesses with higher long-term earnings potential rather than to buy lower-quality stocks because they appear cheap. These challenged businesses often don’t re-rate, a phenomenon known as a “value trap”.
3. Peabody Energy (BTU) Research Report: Q4 CY2025 Update
Coal mining company Peabody Energy (NYSE:BTU) reported revenue ahead of Wall Street’s expectations in Q4 CY2025, but sales fell by 9% year on year to $1.02 billion. Its non-GAAP profit of $0.08 per share was in line with analysts’ consensus estimates.
Peabody Energy (BTU) Q4 CY2025 Highlights:
- Revenue: $1.02 billion vs analyst estimates of $994.2 million (9% year-on-year decline, 2.8% beat)
- Adjusted EPS: $0.08 vs analyst estimates of $0.07 (in line)
- Adjusted EBITDA: $118.1 million vs analyst estimates of $119.6 million (11.6% margin, 1.2% miss)
- Operating Margin: 0.8%, down from 3.6% in the same quarter last year
- Free Cash Flow was -$62 million compared to -$15.8 million in the same quarter last year
- Market Capitalization: $3.91 billion
Company Overview
Beginning with a single wagon hauling coal in Illinois back when Grover Cleveland was president, Peabody Energy (NYSE:BTU) mines coal used by electricity generators and steel manufacturers.
The company operates coal mining sites in the United States and Australia, extracting two main types of coal that serve distinct purposes. Thermal coal is used by power plants to generate electricity, while metallurgical coal (also called "met coal") is a key ingredient in steel production, where it provides the carbon needed in blast furnaces. For instance, a steel mill building rebar for construction projects would use Peabody's metallurgical coal as an essential raw material in its manufacturing process.
Peabody organizes its business into geographic segments. Its Seaborne operations in Australia produce both thermal and metallurgical coal that is shipped internationally through ports along Australia's east coast. In the United States, the company operates mines in the Powder River Basin of Wyoming and Montana, which is known for low-sulfur thermal coal, along with other thermal coal operations across the country and a metallurgical coal mine in Alabama.
The company primarily sells coal under long-term supply agreements with customers, though some sales occur on shorter-term contracts or spot market transactions. Most U.S. coal is transported by rail directly from mine sites to power plants, while export coal moves by rail to ports where it is loaded onto ships. Peabody generates revenue by selling tons of coal to its customers, with pricing varying based on coal type, quality specifications, and whether it's sold domestically or internationally. Beyond coal mining, the company also brokers and markets coal from other producers and has entered into a joint venture to develop solar energy projects on reclaimed mining land.
4. Mixed or Offshore Upstream E&P
This category includes smaller or niche E&P companies operating in specialized basins, geographies, or resource types outside major classifications. These firms may target unconventional resources, frontier regions, or specific commodity niches. Tailwinds include potential for outsized returns from successful exploration, acquisition opportunities during industry downturns, and specialized expertise commanding premium valuations. Headwinds include higher operational and geological risks, limited scale reducing negotiating power and cost efficiencies, and constrained capital market access during challenging commodity environments. Regulatory risks and ESG concerns may disproportionately affect smaller operators with fewer resources for compliance.
Peabody Energy's main competitors include Arch Resources (NYSE:ARCH), Alliance Resource Partners (NASDAQ:ARLP), CONSOL Energy (NYSE:CEIX), Hallador Energy (NASDAQ:HNRG), and privately-held companies like Foresight Energy and American Consolidated Natural Resources.
5. Economies of Scale
The scale of a company’s revenue base is an important lens through which to view the topline, as it signals whether a producer has gone from a vulnerable commodity taker into a durable operating platform. Larger producers generate revenue across many wells, pads, takeaway routes, and geographies rather than relying on a single field or drilling program. Peabody Energy’s $3.86 billion of revenue in the last year is mid-sized for the industry.
6. Revenue Growth
Cyclical industries such as Energy can make mediocre companies look great for a time, but a long-term view reveals which businesses can actually withstand and adapt to changing conditions. Regrettably, Peabody Energy’s sales grew at a sluggish 6% compounded annual growth rate over the last five years. This was below our standard for the energy upstream and integrated energy sector and is a poor baseline for our analysis.
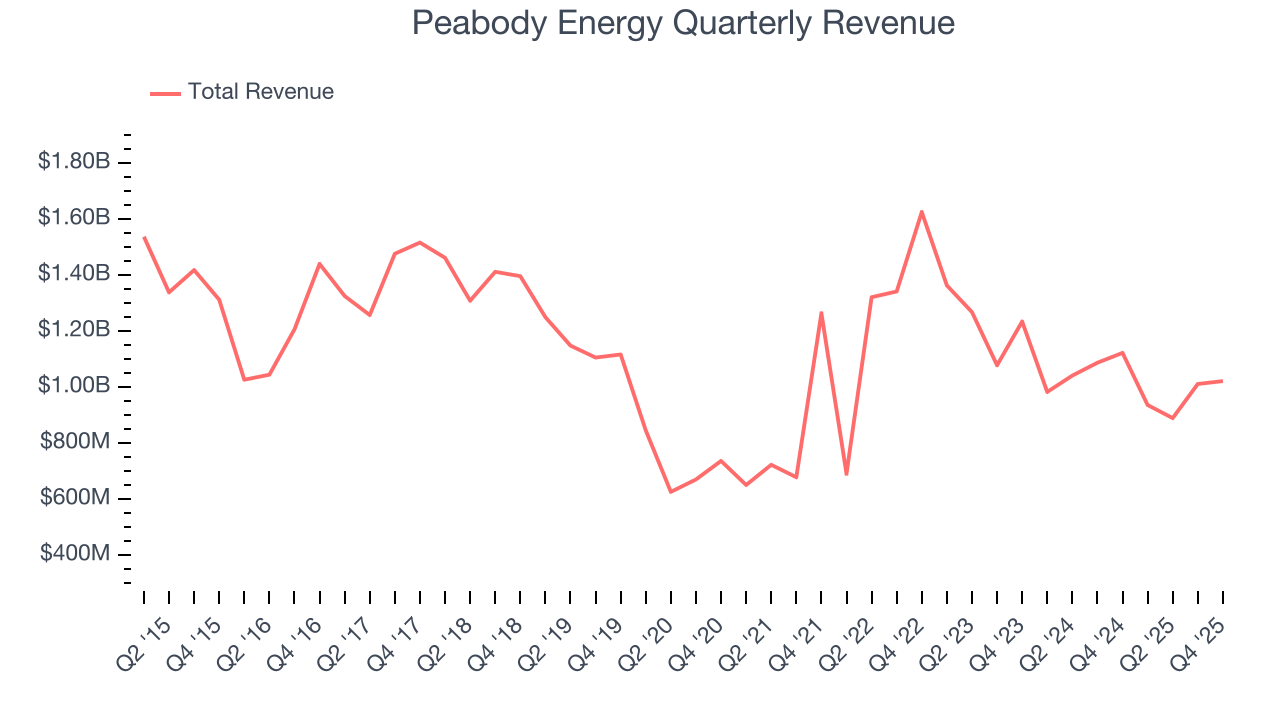
Even a long stretch in Energy can be shaped by a single commodity cycle, so extending the view to ten years adds another perspective and reveals which companies are built to grow regardless of the pricing regime. Peabody Energy’s performance shows it grew in the past five-year but relinquished its gains over the last ten years, as its revenue fell by 3.7% annually.
Revenue provides useful context, but it is heavily influenced by commodity prices and acquisitions. Production volumes, by contrast, reveal whether the underlying asset base is actually growing. Over the last two years, Peabody Energy’s total oil volume per day - Upstream averaged 1.4% year-on-year declines. while natural gas volume per day - Upstream averaged 8.4% year-on-year declines.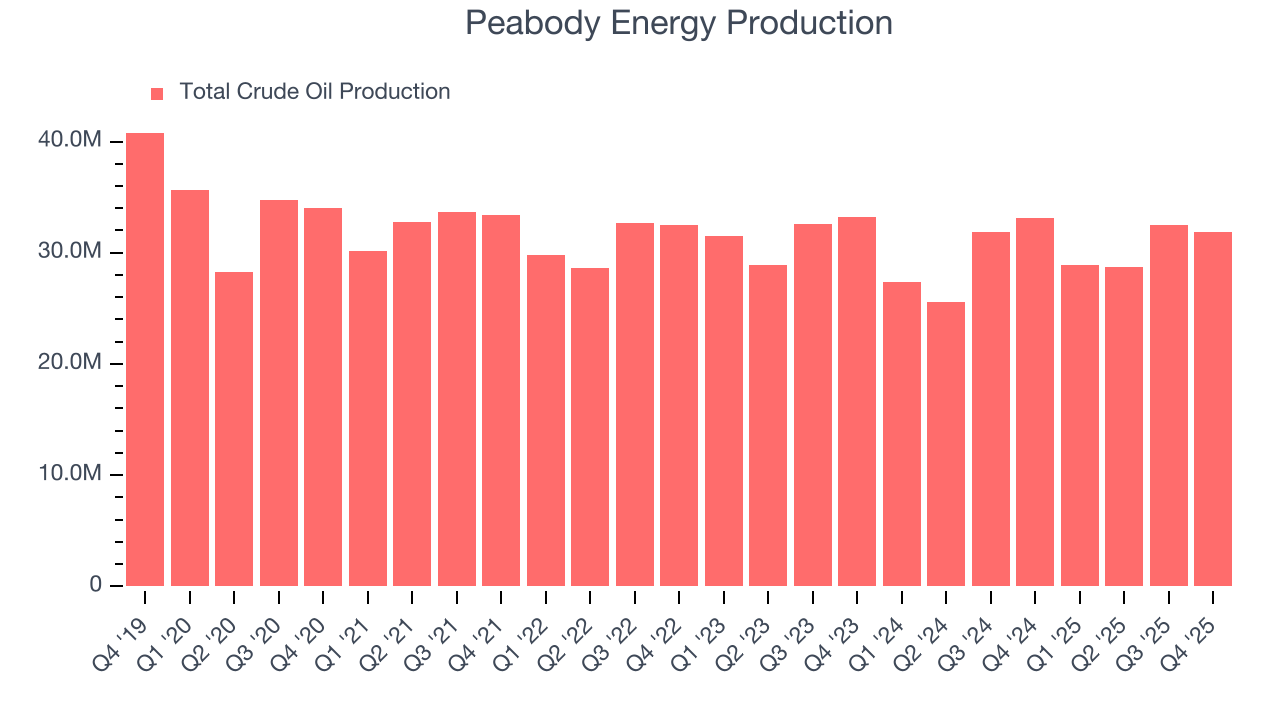
This quarter, Peabody Energy’s revenue fell by 9% year on year to $1.02 billion but beat Wall Street’s estimates by 2.8%. This quarter, Peabody Energy missed Wall Street’s estimates and reported a rather uninspiring 3.6% year-on-year production decline, generating 31,900 Mboe of production.
7. Gross Margin
While energy gross margins can be distorted by commodity prices, hedging, and short-term cost swings, sustained margins across a full cycle reflect a producer’s underlying asset quality, infrastructure position, and cost structure.
Peabody Energy, which averaged 25.1% gross margin over the last five years, exhibiting bottom-tier unit economics in the sector. It means the company will struggle at higher commodity prices than peers with better gross margins. 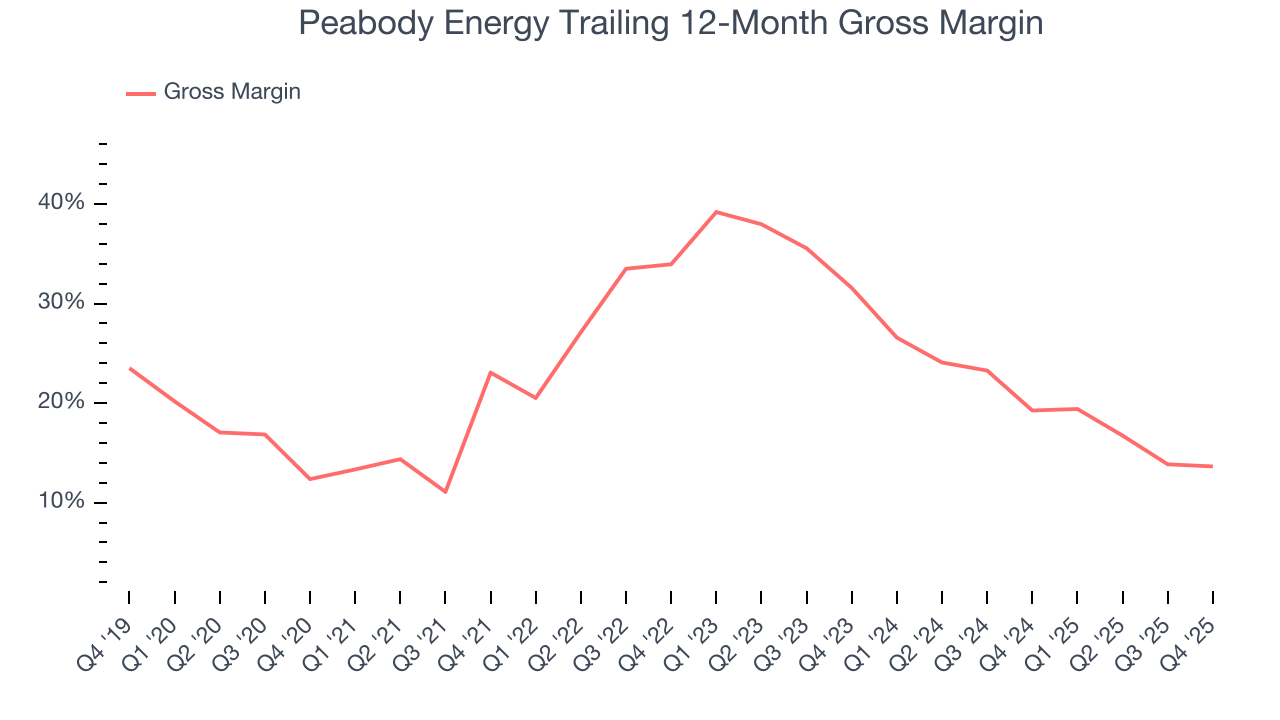
Peabody Energy’s gross profit margin came in at 14.1% this quarter, in line with the same quarter last year.
8. Adjusted EBITDA Margin
Adjusted EBITDA margin is an important measure of profitability for the sector and accounts for the gross margins and operating costs mentioned previously. Unlike operating margin, it is not distorted by accounting conventions around reserves, drilling costs, and assumptions on commodity consumption from the well or basin. Adjusted EBITDA highlights the economic reality of how much cash the rock produces before the capital structure (debt service) and the drilling budget (capex) are considered.
Peabody Energy was profitable over the last five years but held back by its large cost base. Its average EBITDA margin of 25.5% was weak for an upstream and integrated energy business.
Looking at the trend in its profitability, Peabody Energy’s EBITDA margin decreased by 15.8 percentage points over the last year. Peabody Energy’s performance was poor no matter how you look at it - it shows that costs were rising and it couldn’t pass them onto its customers.
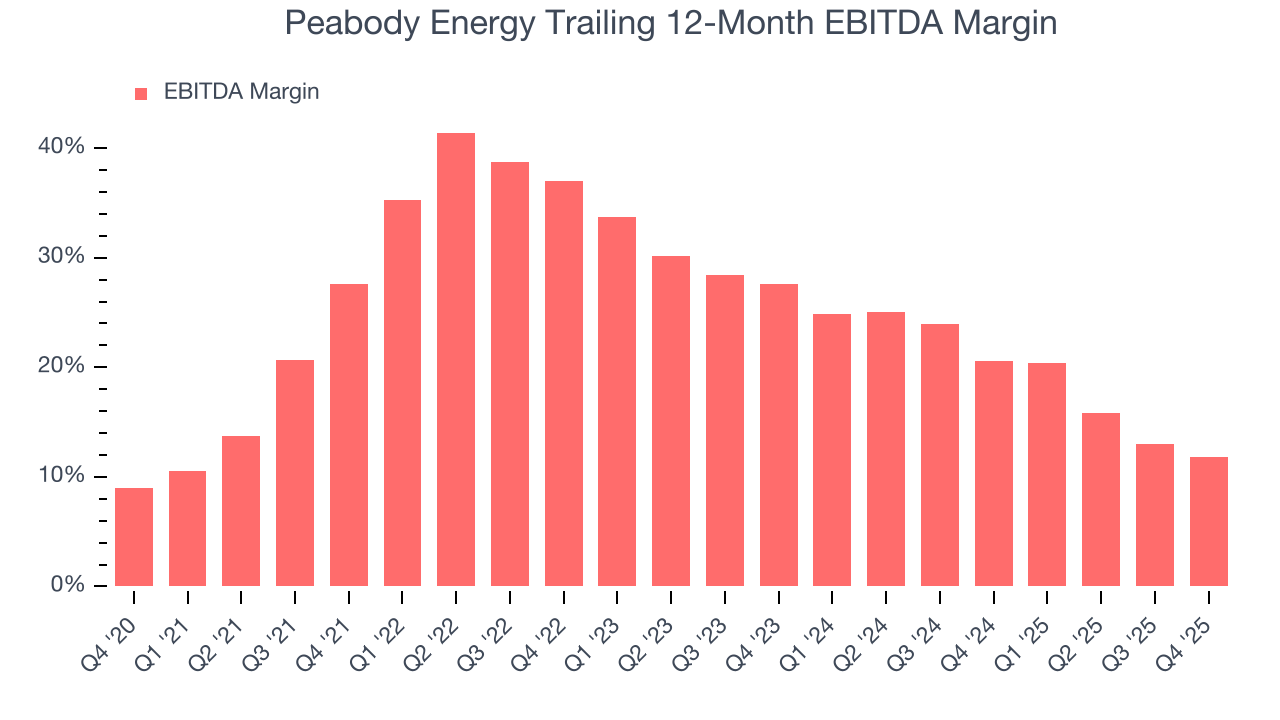
This quarter, Peabody Energy generated an EBITDA margin profit margin of 11.6%, down 4.2 percentage points year on year. This contraction shows it was less efficient because its expenses increased relative to its revenue. This adjusted EBITDA fell short of Wall Street’s estimates.
9. Cash Is King
Adjusted EBITDA shows how profitable a company’s existing “rock” is before financing and reinvestment, while free cash flow shows how much value remains after paying to replace those wells. Because production declines over time, strong EBITDA can coexist with weak FCF if drilling is expensive or declines are steep. FCF therefore captures both operating efficiency and the cost of sustaining production.
Peabody Energy has shown decent cash profitability, giving it some flexibility to reinvest or return capital to investors. The company’s free cash flow margin averaged 9.4% over the last five years, slightly better than the broader energy upstream and integrated energy sector.
Absolute FCF margin levels matter but so does stability of free cash flow. All else equal, we’d prefer a 25.0% average free cash flow margin that is quite steady no matter how commodity prices behave rather than extremely high margins when times are good and negative ones when they’re tough.
Peabody Energy’s ratio of quarterly free cash flow volatility to WTI crude price volatility over the past five years was 13.8 (lower is better), indicating that its cash generation is far more sensitive to commodity-price swings than most peers. This elevated volatility limits its access to capital in downturns and makes it unlikely to act as a consolidator when weaker competitors come under pressure.
You may be asking why we wait until the free cash flow line to perform this stability analysis versus commodity prices. Why not compare revenue or EBITDA to WTI Crude prices in the case of Peabody Energy? Because what ultimately matters is not how much revenue or profit you earn when prices are high but how much cash you can generate when prices are low. Free cash flow is the superior metric because it includes everything from hedging prowess to growth and maintenance capex to management behavior during good times and bad.
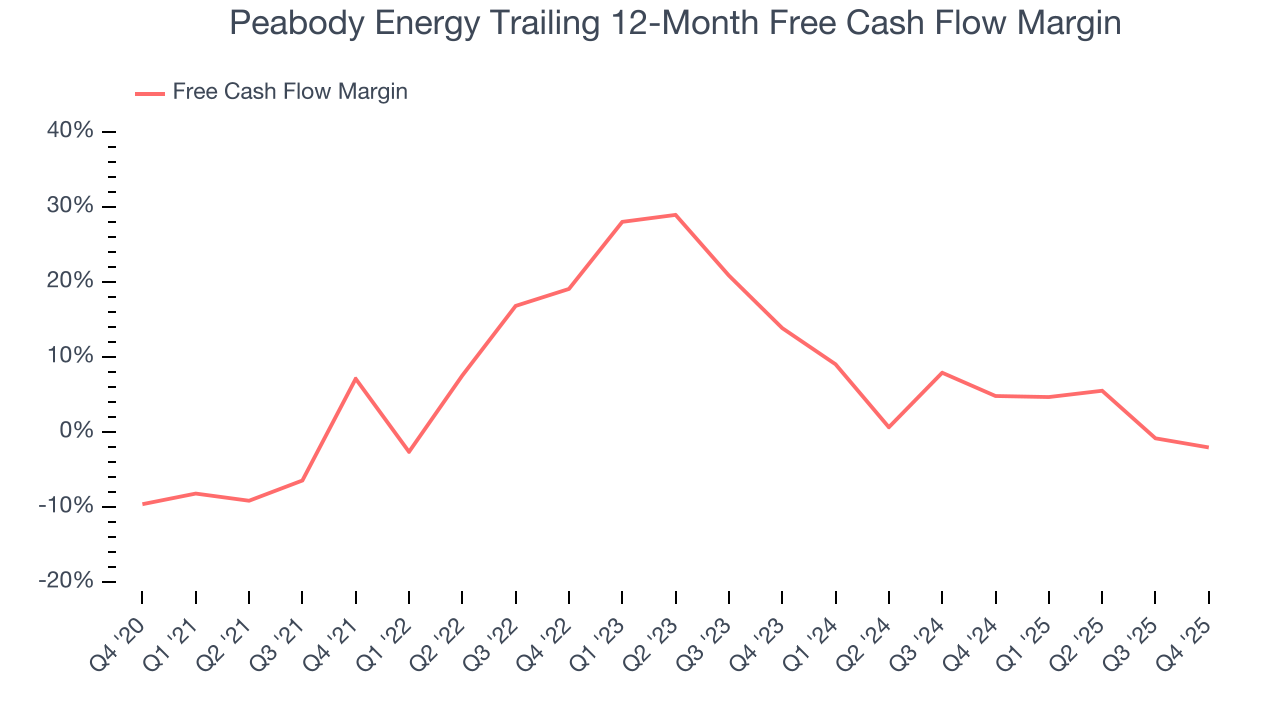
Peabody Energy burned through $62 million of cash in Q4, equivalent to a negative 6.1% margin. The company’s cash burn increased from $15.8 million of lost cash in the same quarter last year. These numbers deviate from its longer-term margin, indicating it is a seasonal business that must build up inventory during certain quarters.
10. Return on Invested Capital (ROIC)
Free cash flow shows how much money a producer generated, while ROIC shows how efficiently that money was earned. ROIC measures the operating profit produced for each dollar of capital invested, whether from debt or equity. Cash generation measures quantity while ROIC measures the quality of value creation.
We at StockStory like to look at ROIC over a ten-year period because energy investment cycles can involve up to five years of ramping production and another five years of harvesting. A decade view captures buying, extracting, and monetizing rather than just part of that picture. Although Peabody Energy hasn’t been the highest-quality company lately because of its poor top-line performance, it found a few growth initiatives in the past that worked out wonderfully. Its ten-year average ROIC was 20%, splendid for an upstream and integrated energy business.
We like to invest in businesses with high returns, but the trend in a company’s ROIC is what often surprises the market and moves the stock price. Unfortunately, Peabody Energy’s ROIC has decreased significantly over the last few years. We like what management has done in the past, but its declining returns are perhaps a symptom of fewer profitable growth opportunities.
11. Balance Sheet Assessment
One of the best ways to mitigate bankruptcy risk is to hold more cash than debt.
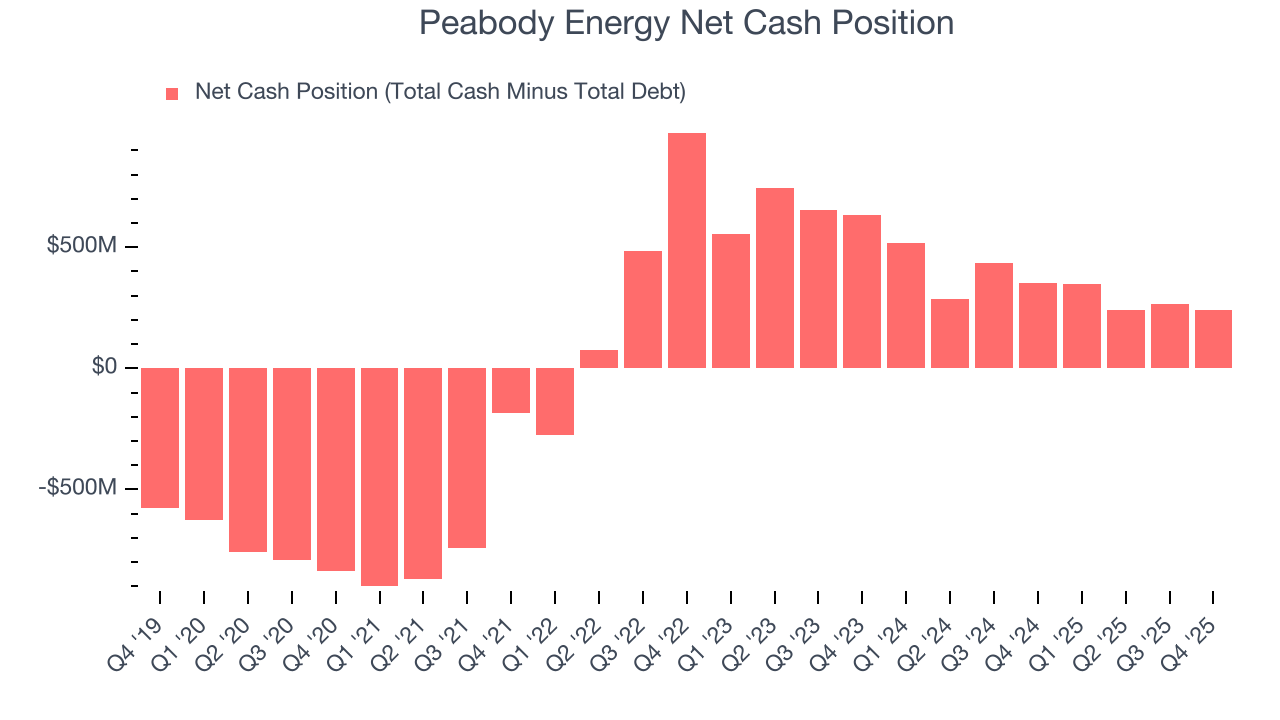
Peabody Energy is a well-capitalized company with $575.3 million of cash and $336.4 million of debt on its balance sheet. This $238.9 million net cash position is 6.1% of its market cap and gives it the freedom to borrow money, return capital to shareholders, or invest in growth initiatives. Leverage is not an issue here.
12. Key Takeaways from Peabody Energy’s Q4 Results
We enjoyed seeing Peabody Energy beat analysts’ revenue expectations this quarter. We were also glad its EPS was in line with Wall Street’s estimates. On the other hand, its production slightly missed and its EBITDA fell slightly short of Wall Street’s estimates. Zooming out, we think this was a mixed quarter. The stock remained flat at $33.27 immediately after reporting.
13. Is Now The Time To Buy Peabody Energy?
Updated: March 17, 2026 at 1:12 AM EDT
A common mistake we notice when investors are deciding whether to buy a stock or not is that they simply look at the latest earnings results. Business quality and valuation matter more, so we urge you to understand these dynamics as well.
Peabody Energy falls short of our quality standards. First off, its revenue growth over the last five years was bottom-tier for the sector. While its stellar ROIC suggests it has been a well-run company historically, the downside is its declining EBITDA margin shows the business has become less efficient. On top of that, its gross margins show its business model is much less lucrative than other companies.
Peabody Energy’s P/E ratio based on the next 12 months is 10.5x. This multiple tells us a lot of good news is priced in - we think there are better opportunities elsewhere.
Wall Street analysts have a consensus one-year price target of $39.75 on the company (compared to the current share price of $35.18).