
Gulfport Energy (GPOR)
Gulfport Energy catches our eye. Its powerful free cash flow generation enables it to reinvest profits or return capital to shareholders.― StockStory Analyst Team
1. News
2. Summary
Why Gulfport Energy Is Interesting
With drilling operations focused on the Utica Shale in eastern Ohio and the SCOOP play in central Oklahoma, Gulfport Energy (NYSE:GPOR) drills for and produces natural gas from underground shale formations.
- Excellent EBITDA margin highlights the strength of its business model
- Highly-profitable operating model results in strong unit economics and a stellar gross margin of 68.6%
- One risk is its push for growth has led to negative returns on capital, signaling value destruction


Gulfport Energy has some noteworthy aspects. If you’re a believer, the price looks reasonable.
Why Is Now The Time To Buy Gulfport Energy?


Gulfport Energy’s stock price of $204.98 implies a valuation ratio of 8.3x forward P/E. This multiple seems like a bargain for the top-line momentum you get.
It could be a good time to invest if you see something the market doesn’t.
3. Gulfport Energy (GPOR) Research Report: Q4 CY2025 Update
Natural gas producer Gulfport Energy (NYSE:GPOR) beat Wall Street’s revenue expectations in Q4 CY2025, with sales up 66% year on year to $398.2 million. Its non-GAAP profit of $5.75 per share was 1.9% above analysts’ consensus estimates.
Gulfport Energy (GPOR) Q4 CY2025 Highlights:
- Revenue: $398.2 million vs analyst estimates of $366.2 million (66% year-on-year growth, 8.7% beat)
- Adjusted EPS: $5.75 vs analyst estimates of $5.64 (1.9% beat)
- Adjusted EBITDA: $234.8 million vs analyst estimates of $232.7 million (59% margin, 0.9% beat)
- Operating Margin: 44.9%, up from -131% in the same quarter last year
- Free Cash Flow Margin: 10.2%, down from 29.9% in the same quarter last year
- Oil production: down -9.1% year on year
- Market Capitalization: $3.66 billion
Company Overview
With drilling operations focused on the Utica Shale in eastern Ohio and the SCOOP play in central Oklahoma, Gulfport Energy (NYSE:GPOR) drills for and produces natural gas from underground shale formations.
The company's operations center on two main areas. In the Appalachian Basin, it targets the Utica and Marcellus shale formations across approximately 208,000 net reservoir acres in Belmont, Harrison, Jefferson, and Monroe Counties in eastern Ohio. The Utica formation sits between 600 to 750 feet thick at depths several thousand feet below the surface, while the Marcellus formation overlays it at shallower depths. This Appalachian region accounts for roughly 80% of the company's production. In Oklahoma's Anadarko Basin, Gulfport operates in the SCOOP (South Central Oklahoma Oil Province) play, holding around 73,000 net reservoir acres primarily in Garvin, Grady, and Stephens Counties. Here, it targets the Woodford Shale, Springer formation, and other hydrocarbon-bearing rock layers.
As an exploration and production company, Gulfport generates revenue by selling the natural gas, oil, and natural gas liquids (NGLs) it extracts to purchasers through both short-term spot contracts and longer-term agreements. For instance, a utility company might purchase Gulfport's natural gas to supply electricity to homes, or a petrochemical manufacturer might buy its NGLs as feedstock for plastics production. The company's marketing operations handle securing buyers, arranging transportation through pipelines, and managing the logistical complexities of moving product from wellhead to customer. Gulfport has entered into long-term gathering, processing, and transportation agreements that reserve pipeline capacity for specific production volumes, ensuring its natural gas can reach markets efficiently.
4. Mixed or Offshore Upstream E&P
This category includes smaller or niche E&P companies operating in specialized basins, geographies, or resource types outside major classifications. These firms may target unconventional resources, frontier regions, or specific commodity niches. Tailwinds include potential for outsized returns from successful exploration, acquisition opportunities during industry downturns, and specialized expertise commanding premium valuations. Headwinds include higher operational and geological risks, limited scale reducing negotiating power and cost efficiencies, and constrained capital market access during challenging commodity environments. Regulatory risks and ESG concerns may disproportionately affect smaller operators with fewer resources for compliance.
Gulfport Energy's competitors in Appalachian natural gas production include EQT Corporation (NYSE:EQT), Chesapeake Energy (NASDAQ:CHK), Range Resources (NYSE:RRC), and Southwestern Energy (NYSE:SWN). In Oklahoma, it competes with Continental Resources and privately-held operators.
5. Revenue Scale
The size of the revenue base is a way to assess topline, and it tells an investor whether an Energy producer has crossed the line between being a more vulnerable commodity taker and a durable operating platform. Scaled businesses tend to produce and generate revenue from many wells, pads, takeaway routes, and geographies, not just a single field or drilling program. Gulfport Energy’s $1.42 billion of revenue in the last year is pretty small for the industry, suggesting the company is subscale business in an industry where scale matters.
6. Revenue Growth
Cyclical sectors like Energy often flatter weaker operators during favorable price environments, but a longer-term lens separates those from businesses that can consistently perform across market cycles. Over the last five years, Gulfport Energy grew its sales at a decent 10.4% compounded annual growth rate. Its growth was slightly above the average energy upstream and integrated energy company and shows its offerings resonate with customers.
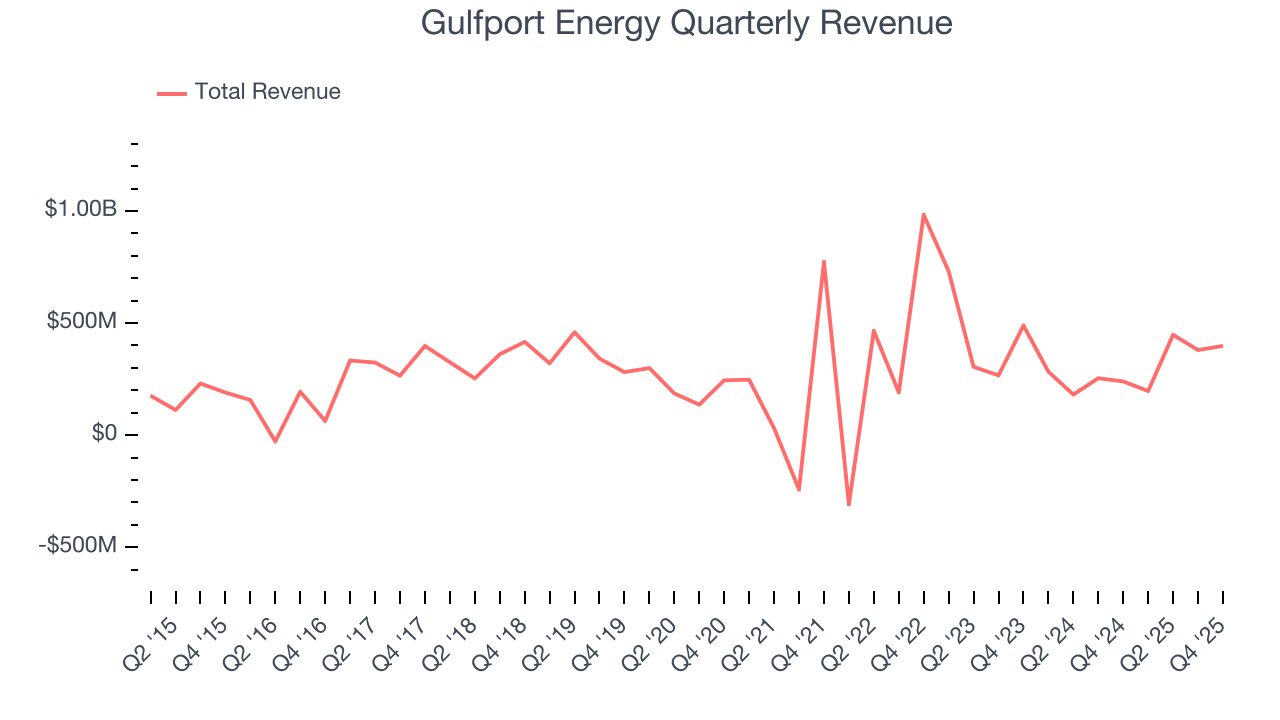
Within Energy, a singular timeframe, even if it’s quite long-term, only sheds light on how well a company rode the last commodity cycle. To better assess whether a company compounds through cycles, we validate our view with an even longer, ten-year view. Gulfport Energy’s annualized revenue growth of 7.2% over the last ten years is below its five-year trend, but we still think the results were good.
While looking at revenue is important, it can also introduce noise around commodity prices and M&A. Analyzing production, on the other hand, highlights what is happening inside the asset base and whether the economic footprint of a company is expanding. Over the last two years, Gulfport Energy’s oil production averaged 71.1% year-on-year growth. On the other hand, its natural gas production averaged 4.2% year-on-year declines. 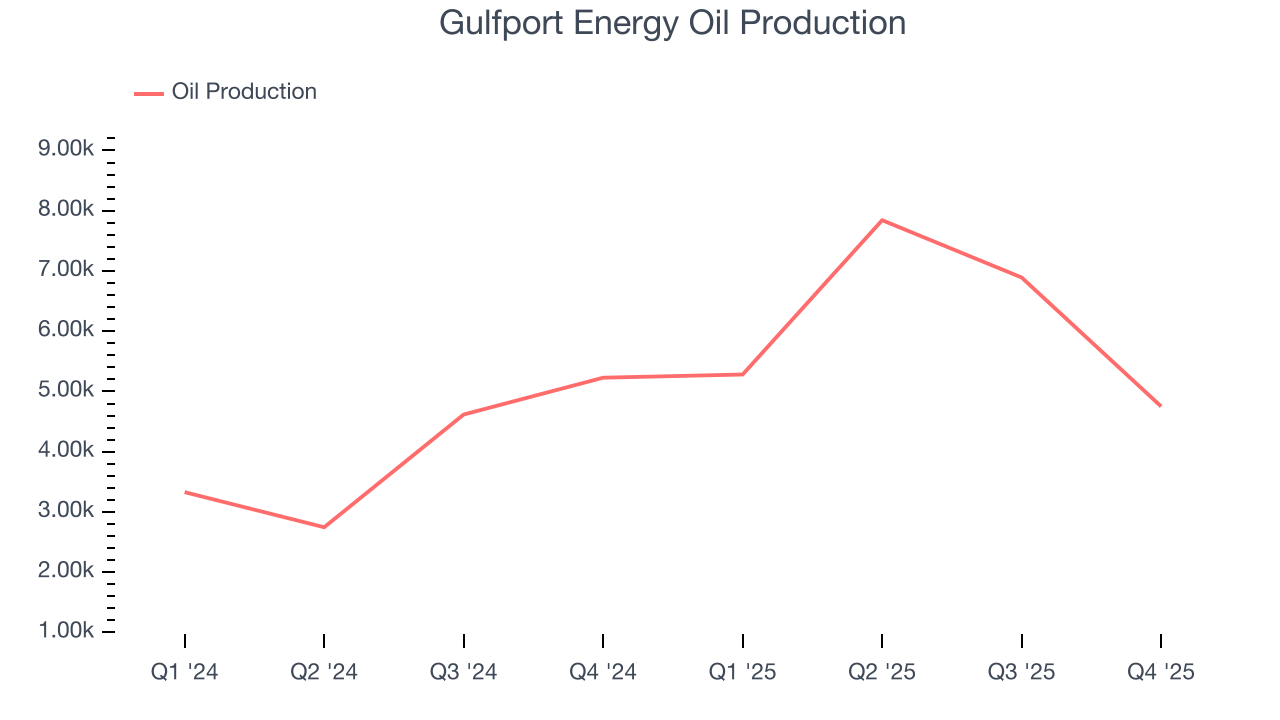
This quarter, Gulfport Energy reported magnificent year-on-year revenue growth of 66%, and its $398.2 million of revenue beat Wall Street’s estimates by 8.7%. This quarter, Gulfport Energy’s Oil production fell by 9.1% year on year.
7. Gross Margin
In a single quarter or year, gross margins in the sector can swing wildly due to commodity prices, hedging, or changes in labor costs. Over a multi-year period across different points in the cycle, gross margin differences can signal whether a company is a structurally-advantaged producer (“rock” quality, takeaway, operating costs) or not.
Gulfport Energy, which averaged 68.6% gross margin over the last five years, exhibits impressive unit economics in the sector. It means the company will remain profitable at lower commodity prices than peers with inferior gross margins and serves as an excellent starting point for ultimate operating profits and free cash flow generation. 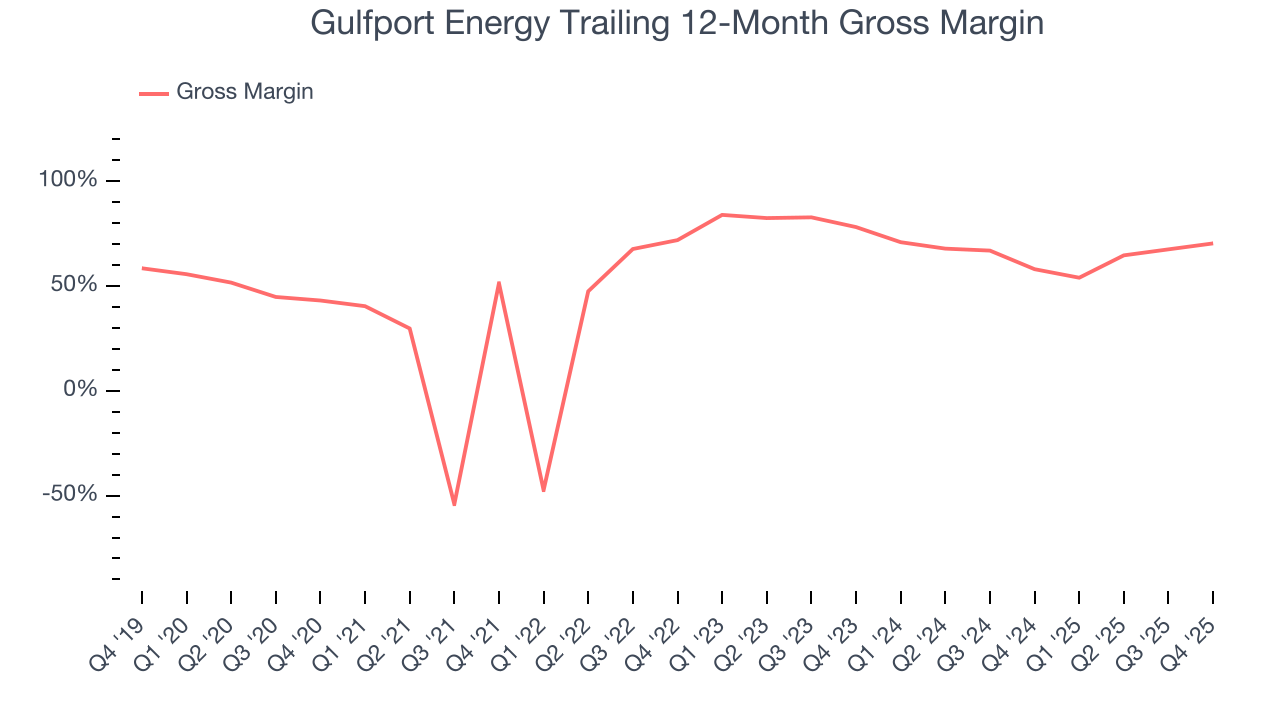
Gulfport Energy’s gross profit margin came in at 71.5% this quarter , marking a 14.2 percentage point increase from 57.3% in the same quarter last year. Note that energy margins can be volatile due to commodity price changes.
8. Adjusted EBITDA Margin
Gulfport Energy has been a well-oiled machine over the last five years. It demonstrated elite profitability for an upstream and integrated energy business, boasting an average EBITDA margin of 58.2%.
Looking at the trend in its profitability, Gulfport Energy’s EBITDA margin decreased by 8.5 percentage points over the last year. This raises questions about the company’s expense base because its revenue growth should have given it leverage on its fixed costs, resulting in better economies of scale and profitability.
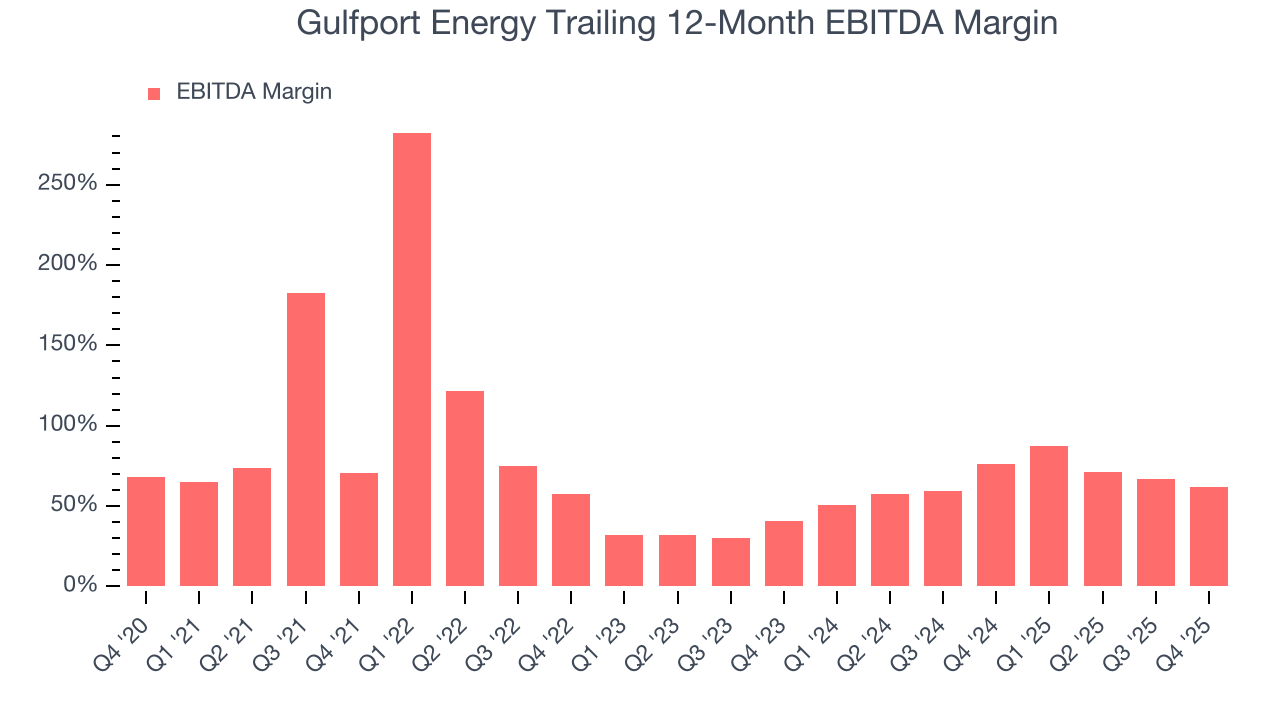
In Q4, Gulfport Energy generated an EBITDA margin profit margin of 59%, down 25.6 percentage points year on year. This contraction shows it was less efficient because its expenses grew faster than its revenue. This adjusted EBITDA beat Wall Street’s estimates by 0.9%.
9. Cash Is King
Adjusted EBITDA shows how profitable a company’s existing “rock” is before financing and reinvestment, while free cash flow shows how much value remains after paying to replace those wells. Because production declines over time, strong EBITDA can coexist with weak FCF if drilling is expensive or declines are steep. FCF therefore captures both operating efficiency and the cost of sustaining production.
Gulfport Energy has shown robust cash profitability, driven by its attractive business model that enables it to reinvest or return capital to investors. The company’s free cash flow margin averaged 17.3% over the last five years, quite impressive for an upstream and integrated energy business.
Absolute FCF margin levels matter but so does stability of free cash flow. All else equal, we’d prefer a 25.0% average free cash flow margin that is quite steady no matter how commodity prices behave rather than extremely high margins when times are good and negative ones when they’re tough.
Gulfport Energy’s ratio of quarterly free cash flow volatility to WTI crude price volatility over the past five years was 5.9 (lower is better), indicating excellent insulation from commodity swings. This stability supports capital access in downturns and positions Gulfport Energy to act as a consolidator when weaker peers are forced to retrench.
You may be asking why we wait until the free cash flow line to perform this stability analysis versus commodity prices. Why not compare revenue or EBITDA to WTI in the case of Gulfport Energy? Because what ultimately matters is not how much revenue or profit you earn when prices are high but how much cash you can generate when prices are low. Free cash flow is the superior metric because it includes everything from hedging prowess to growth and maintenance capex to management behavior during good times and bad.
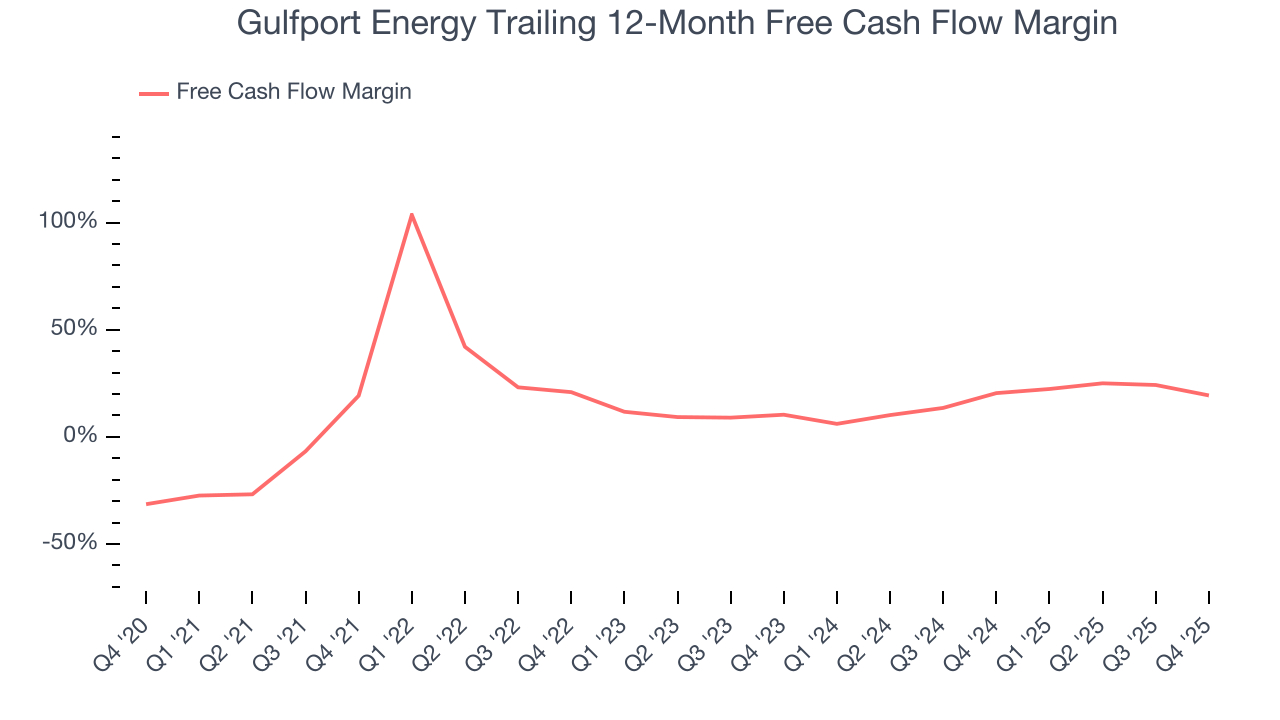
Gulfport Energy’s free cash flow clocked in at $40.76 million in Q4, equivalent to a 10.2% margin. The company’s cash profitability regressed as it was 19.6 percentage points lower than in the same quarter last year, but we wouldn’t read too much into the short term because investment needs can be seasonal, causing temporary swings. Long-term trends carry greater meaning.
10. Return on Invested Capital (ROIC)
Free cash flow tells investors how much money an Energy producer made, and ROIC takes this one step further by telling investors how well and effectively the business made it. ROIC illustrates how much operating profit a producer generated relative to the money it has raised (debt and equity).
We at StockStory like to look at ROIC over a ten-year period because energy investment cycles can involve up to five years of ramping production and another five years of harvesting. A decade view captures buying, extracting, and monetizing rather than just part of that picture. Although Gulfport Energy has shown solid business quality lately, it struggled to grow profitably in the past. Its ten-year average ROIC was negative 8.9%, meaning management lost money while trying to expand the business.
11. Balance Sheet Assessment
Gulfport Energy reported $1.81 million of cash and $788.7 million of debt on its balance sheet in the most recent quarter. As investors in high-quality companies, we primarily focus on two things: 1) that a company’s debt level isn’t too high and 2) that its interest payments are not excessively burdening the business.
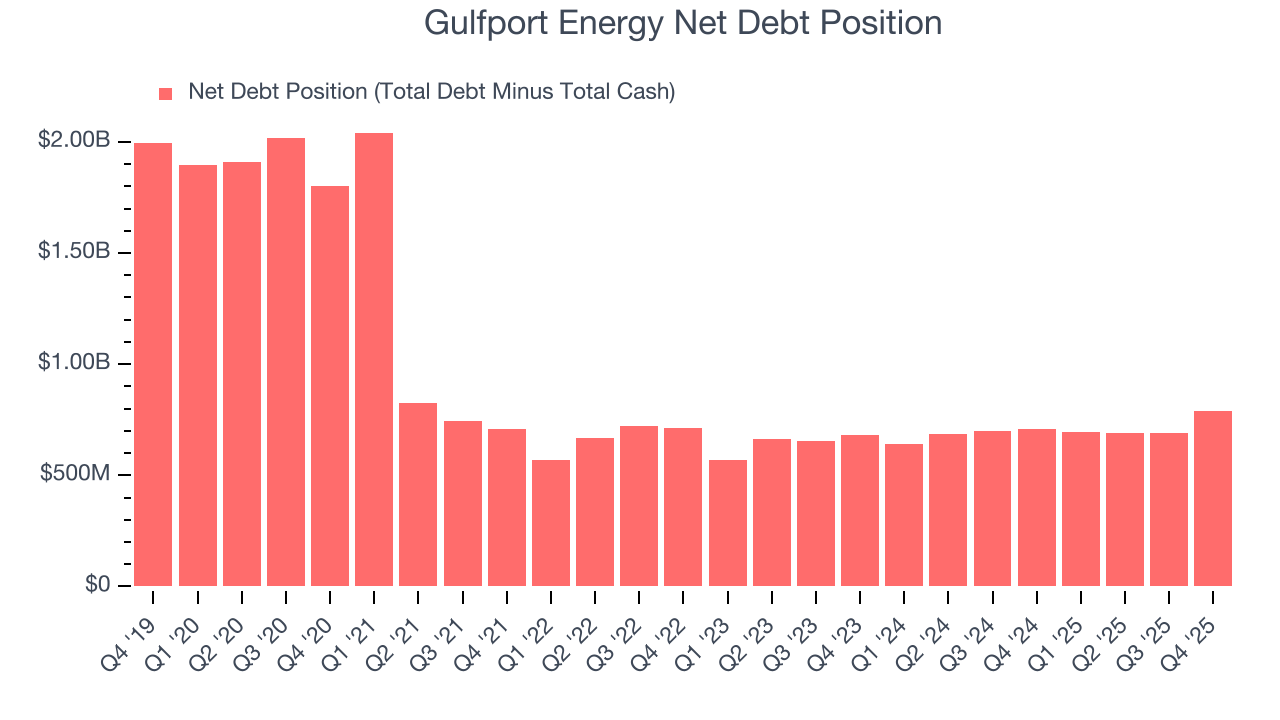
With $878.5 million of EBITDA over the last 12 months, we view Gulfport Energy’s 0.9× net-debt-to-EBITDA ratio as safe. We also see its $54.28 million of annual interest expenses as appropriate. The company’s profits give it plenty of breathing room, allowing it to continue investing in growth initiatives.
12. Key Takeaways from Gulfport Energy’s Q4 Results
We were impressed by how significantly Gulfport Energy blew past analysts’ revenue expectations this quarter. Overall, this print had some key positives. The stock traded up 6.3% to $210.04 immediately following the results.
13. Is Now The Time To Buy Gulfport Energy?
Updated: March 21, 2026 at 12:44 AM EDT
A common mistake we notice when investors are deciding whether to buy a stock or not is that they simply look at the latest earnings results. Business quality and valuation matter more, so we urge you to understand these dynamics as well.
Gulfport Energy possesses a number of positive attributes. To kick things off, its revenue growth over the last five years was average for the sector. And while its relatively low ROIC suggests management has struggled to find compelling investment opportunities, its impressive EBITDA margins show it has a highly efficient business model. On top of that, its admirable gross margin indicates excellent unit economics.
Gulfport Energy’s P/E ratio based on the next 12 months is 8.3x. When scanning the energy upstream and integrated energy space, Gulfport Energy trades at a fair valuation. If you’re a fan of the business and management team, now is a good time to scoop up some shares.
Wall Street analysts have a consensus one-year price target of $237.58 on the company (compared to the current share price of $204.98), implying they see 15.9% upside in buying Gulfport Energy in the short term.