
Tidewater (TDW)
Tidewater is interesting. It’s not only a cash cow but also has increased its profitability, showing its fundamentals are improving.― StockStory Analyst Team
1. News
2. Summary
Why Tidewater Is Interesting
Operating one of the world's largest fleets with over 200 vessels spanning 30 countries, Tidewater (NYSE:TDW) operates offshore service vessels that transport supplies, equipment, and workers to oil rigs and platforms.
- Annual revenue growth of 27.8% over the last five years was superb and indicates its market share increased during this cycle
- EBITDA profits and efficiency rose over the last five years as it benefited from some fixed cost leverage
- A drawback is its below-average returns on capital indicate management struggled to find compelling investment opportunities


Tidewater is solid, but not perfect. If you like the stock, the valuation looks reasonable.
Why Is Now The Time To Buy Tidewater?


At $72.47 per share, Tidewater trades at 17.6x forward P/E. Tidewater’s current multiple might be below that of most energy upstream and integrated energy peers, but we think this valuation is warranted after considering its business quality.
If you think the market is not giving the company enough credit for its fundamentals, now could be a good time to invest.
3. Tidewater (TDW) Research Report: Q4 CY2025 Update
Offshore vessel operator Tidewater (NYSE:TDW) reported Q4 CY2025 results exceeding the market’s revenue expectations, but sales fell by 2.4% year on year to $336.8 million. Its non-GAAP profit of $0.45 per share was 41.4% below analysts’ consensus estimates.
Tidewater (TDW) Q4 CY2025 Highlights:
- Revenue: $336.8 million vs analyst estimates of $331.3 million (2.4% year-on-year decline, 1.7% beat)
- Adjusted EPS: $0.45 vs analyst expectations of $0.77 (41.4% miss)
- Adjusted EBITDA: $135.5 million vs analyst estimates of $137.7 million (40.2% margin, 1.6% miss)
- Operating Margin: 19%, down from 23.6% in the same quarter last year
- Free Cash Flow Margin: 43.9%, up from 25.1% in the same quarter last year
- Market Capitalization: $3.73 billion
Company Overview
Operating one of the world's largest fleets with over 200 vessels spanning 30 countries, Tidewater (NYSE:TDW) operates offshore service vessels that transport supplies, equipment, and workers to oil rigs and platforms.
The company's fleet consists primarily of two vessel types, each serving distinct roles in offshore energy operations. Anchor Handling Towing Supply Vessels (AHTS) are powerful workhorses designed to tow and position mobile drilling rigs, handling the complex task of setting anchors that keep drilling units stable in deep waters. These vessels range from smaller units with up to 8,000 brake horsepower working in shallow coastal waters to large vessels exceeding 16,000 brake horsepower capable of operating in deep offshore environments. Platform Supply Vessels (PSVs) function as cargo carriers, equipped with below-deck liquid mud tanks, dry bulk tanks, and above-deck space for transporting drilling supplies, cement, water, fuel, and other materials needed to sustain offshore operations. Many PSVs feature dynamic positioning systems that use GPS and thrusters to maintain precise positioning without anchoring, allowing them to safely moor alongside rigs and platforms in challenging conditions.
A typical customer might charter a PSV to deliver drilling mud and casing pipes from a shore base to a floating production platform 100 miles offshore, while simultaneously deploying an AHTS vessel to reposition a semi-submersible drilling rig to a new well location. The company generates revenue by chartering its vessels to customers on day rates, with contract durations ranging from short-term spot charters to multi-year agreements. Its customer base includes international oil companies like Eni and Chevron, national oil companies controlled by foreign governments, offshore drilling contractors, and specialized service providers working in subsea construction and wind farm development. Tidewater organizes its operations across five geographic regions: the Americas, Asia Pacific, Middle East, Europe/Mediterranean, and West Africa, with vessels regularly moving between regions as projects conclude and new opportunities emerge.
4. Mixed or Offshore Upstream E&P
This category includes smaller or niche E&P companies operating in specialized basins, geographies, or resource types outside major classifications. These firms may target unconventional resources, frontier regions, or specific commodity niches. Tailwinds include potential for outsized returns from successful exploration, acquisition opportunities during industry downturns, and specialized expertise commanding premium valuations. Headwinds include higher operational and geological risks, limited scale reducing negotiating power and cost efficiencies, and constrained capital market access during challenging commodity environments. Regulatory risks and ESG concerns may disproportionately affect smaller operators with fewer resources for compliance.
Tidewater's competitors include other offshore vessel operators such as Havila Shipping (OSE:HAVI), Swire Pacific Offshore (privately held), Edison Chouest Offshore (privately held), and Bourbon Corporation (privately held).
5. Revenue Scale
The scale of a company’s revenue base is an important lens through which to view the topline, as it signals whether a producer has gone from a vulnerable commodity taker into a durable operating platform. Larger producers generate revenue across many wells, pads, takeaway routes, and geographies rather than relying on a single field or drilling program. Tidewater’s $1.35 billion of revenue in the last year is pretty small for the industry, suggesting the company is subscale business in an industry where scale matters.
6. Revenue Growth
A company’s long-term performance can give signals about its business quality. Even a bad business, especially in a cyclical industry, can shine for a year or so, but a top-tier one should exhibit resilience through cycles. Over the last five years, Tidewater grew its sales at an incredible 27.8% compounded annual growth rate. Its growth beat the average energy upstream and integrated energy company and shows its offerings resonate with customers, a helpful starting point for our analysis.
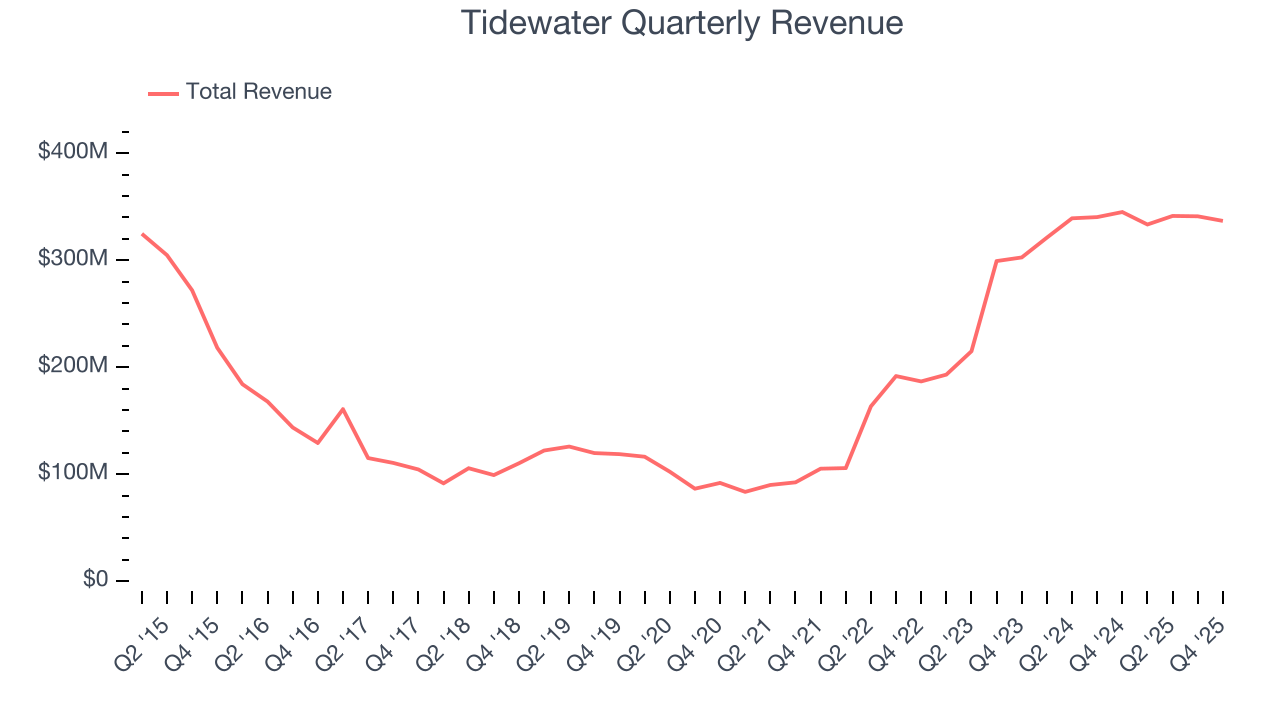
Energy cycles can be long enough that a single five-year period can still reflect one price environment, which is why an additional, decade-long view can help capture through-cycle performance. Tidewater’s annualized revenue growth of 1.9% over the last ten years is below its five-year trend, but we still think the results were respectable.
This quarter, Tidewater’s revenue fell by 2.4% year on year to $336.8 million but beat Wall Street’s estimates by 1.7%.
7. Gross Margin
In any given year, energy gross margins are heavily influenced by prices, hedging, and cost inflation, but over a full cycle these gross margins reveal which producers are structurally advantaged through superior “rock” quality, infrastructure access, and cost position.
Tidewater, which averaged 44.7% gross margin over the last five years, exhibits subpar unit economics in the sector. It means the company will struggle more at lower commodity prices than peers with better gross margins. 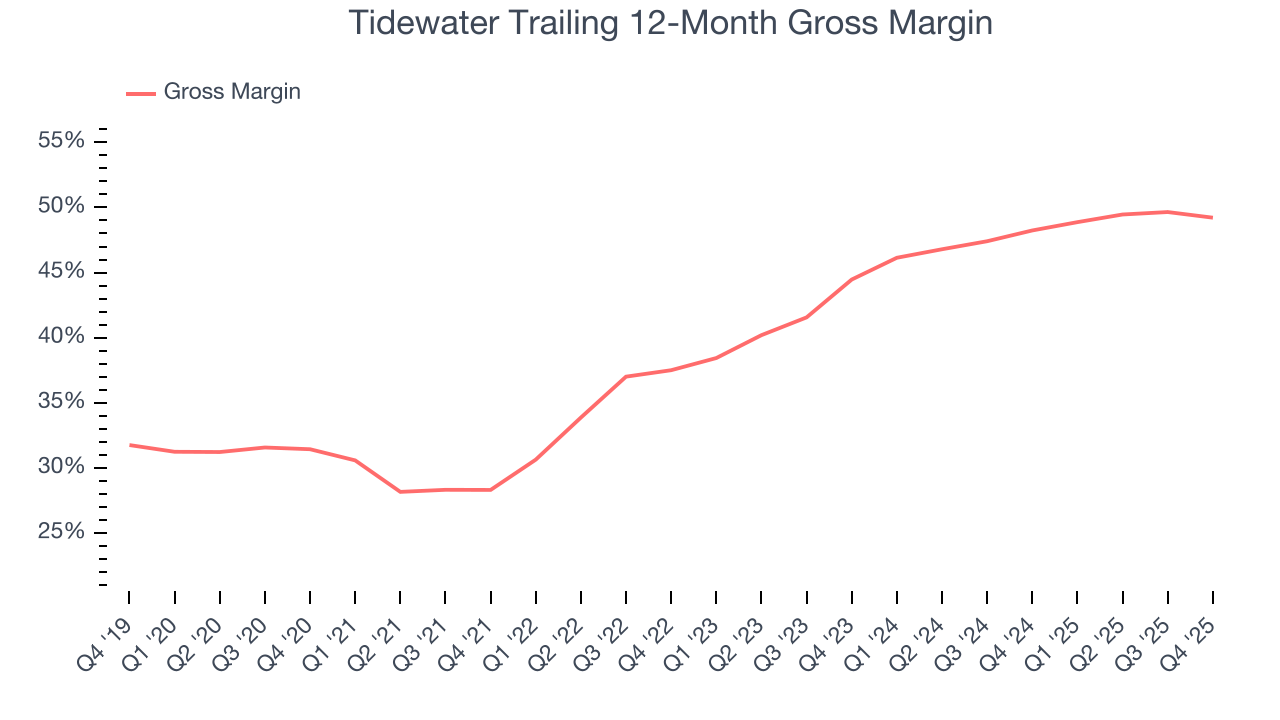
Tidewater produced a 48.7% gross profit margin in Q4, down 1.7 percentage points year on year.
8. Adjusted EBITDA Margin
Adjusted EBITDA margin captures the true operating profitability of an energy producer by removing accounting noise around depletion and capitalized drilling costs. It reveals how much cash the asset base generates before capital structure and reinvestment requirements shape reported earnings.
Tidewater has done a decent job managing its cost base over the last five years. The company has produced an average EBITDA margin of 33.7%, higher than the broader energy upstream and integrated energy sector.
Looking at the trend in its profitability, Tidewater’s EBITDA margin rose by 38.8 percentage points over the last year, as its sales growth gave it immense operating leverage.
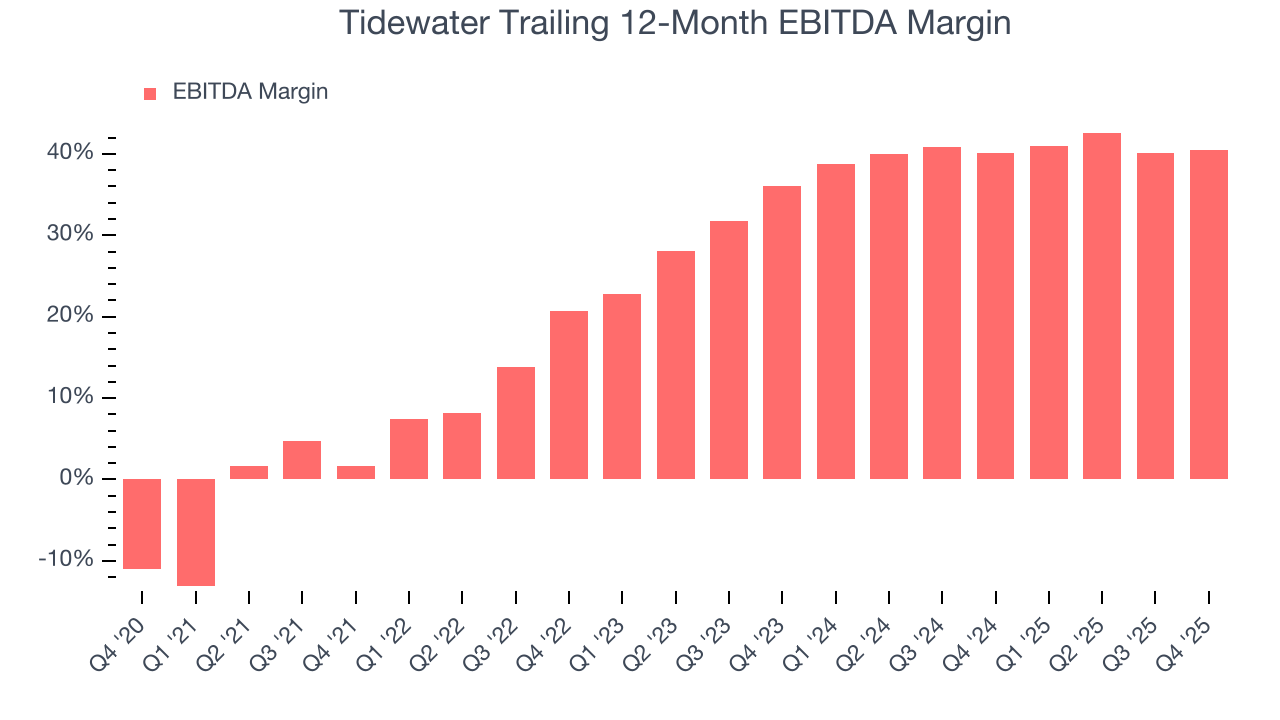
This quarter, Tidewater generated an EBITDA margin profit margin of 40.2%, up 1.6 percentage points year on year. This increase was a welcome development, especially since its revenue fell, showing it was more efficient because it scaled down its expenses. This adjusted EBITDA fell short of Wall Street’s estimates.
9. Cash Is King
Adjusted EBITDA shows how profitable a company’s existing wells are before financing and reinvestment decisions, but free cash flow shows how much value remains after paying the cost of replacing those wells. In upstream energy, production naturally declines over time, so companies must continuously reinvest just to stand still. A producer can report strong EBITDA margins yet generate little or no free cash flow if its wells decline quickly or if new drilling is expensive. Free cash flow therefore captures not only how efficiently a company produces hydrocarbons today, but also how costly it is to sustain that production into the future.
Tidewater has shown robust cash profitability, giving it an edge over its competitors and the ability to reinvest or return capital to investors. The company’s free cash flow margin averaged 14.8% over the last five years, quite impressive for an upstream and integrated energy business.
Absolute FCF margin levels matter but so does stability of free cash flow. All else equal, we’d prefer a 25.0% average free cash flow margin that is quite steady no matter how commodity prices behave rather than extremely high margins when times are good and negative ones when they’re tough.
Tidewater’s ratio of quarterly free cash flow volatility to WTI crude price volatility over the past five years was 7.5 (lower is better), indicating great insulation from commodity swings. indicating that its cash generation is relatively insulated from swings in commodity prices compared with most peers. This resilience supports access to capital in downturns and positions the company to act as a consolidator when distressed assets come to market at attractive prices.
You may be asking why we wait until the free cash flow line to perform this stability analysis versus commodity prices. Why not compare revenue or EBITDA to WTI in the case of Tidewater? Because what ultimately matters is not how much revenue or profit you earn when prices are high but how much cash you can generate when prices are low. Free cash flow is the superior metric because it includes everything from hedging prowess to growth and maintenance capex to management behavior during good times and bad.
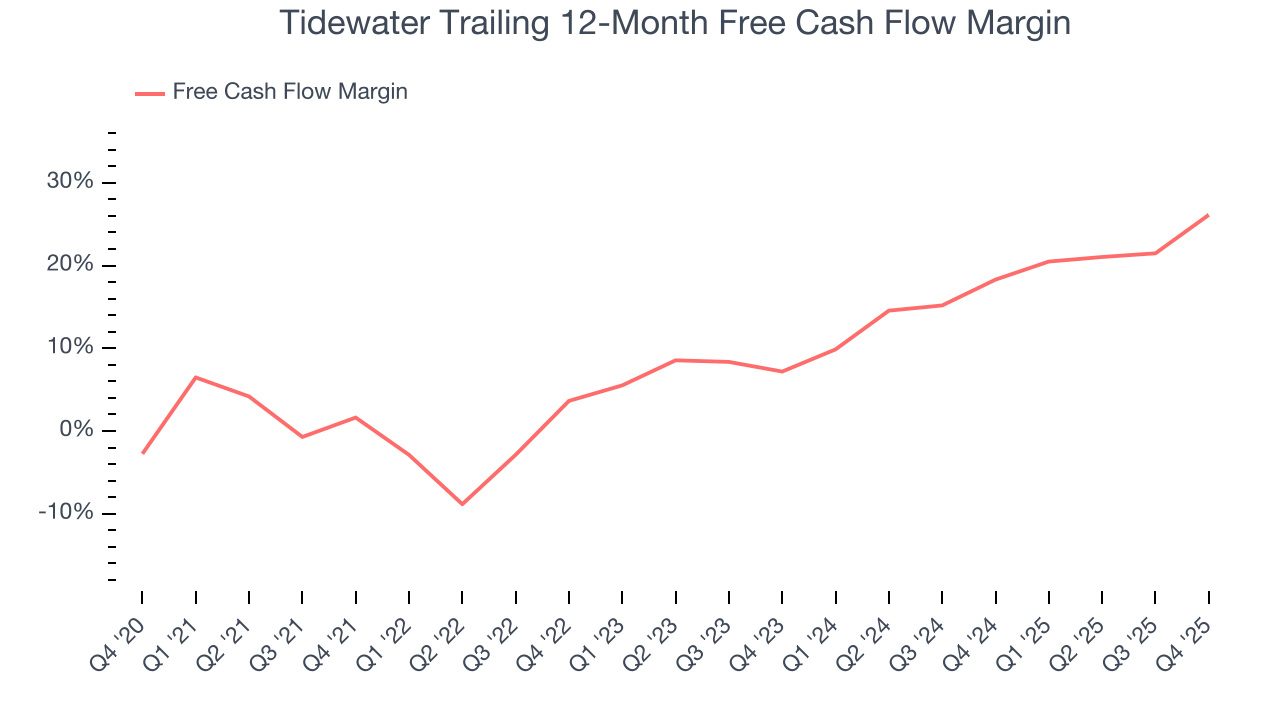
Tidewater’s free cash flow clocked in at $147.8 million in Q4, equivalent to a 43.9% margin. This result was good as its margin was 18.7 percentage points higher than in the same quarter last year, building on its favorable historical trend.
10. Return on Invested Capital (ROIC)
Free cash flow tells investors how much money an Energy producer made, and ROIC takes this one step further by telling investors how well and effectively the business made it. ROIC illustrates how much operating profit a producer generated relative to the money it has raised (debt and equity).
We at StockStory like to look at ROIC over a ten-year period because energy investment cycles can involve up to five years of ramping production and another five years of harvesting. A decade view captures buying, extracting, and monetizing rather than just part of that picture. Although Tidewater has shown solid fundamentals lately, it historically did a mediocre job investing in profitable growth initiatives. Its ten-year average ROIC was 0.8%, lower than the typical cost of capital (how much it costs to raise money) for energy upstream and integrated energy companies.
We like to invest in businesses with high returns, but the trend in a company’s ROIC is what often surprises the market and moves the stock price. Fortunately, Tidewater’s ROIC has increased significantly over the last few years. its rising ROIC is a good sign and could suggest its competitive advantage or profitable growth opportunities are expanding.
11. Balance Sheet Assessment
Tidewater reported $578.8 million of cash and $654.9 million of debt on its balance sheet in the most recent quarter. As investors in high-quality companies, we primarily focus on two things: 1) that a company’s debt level isn’t too high and 2) that its interest payments are not excessively burdening the business.
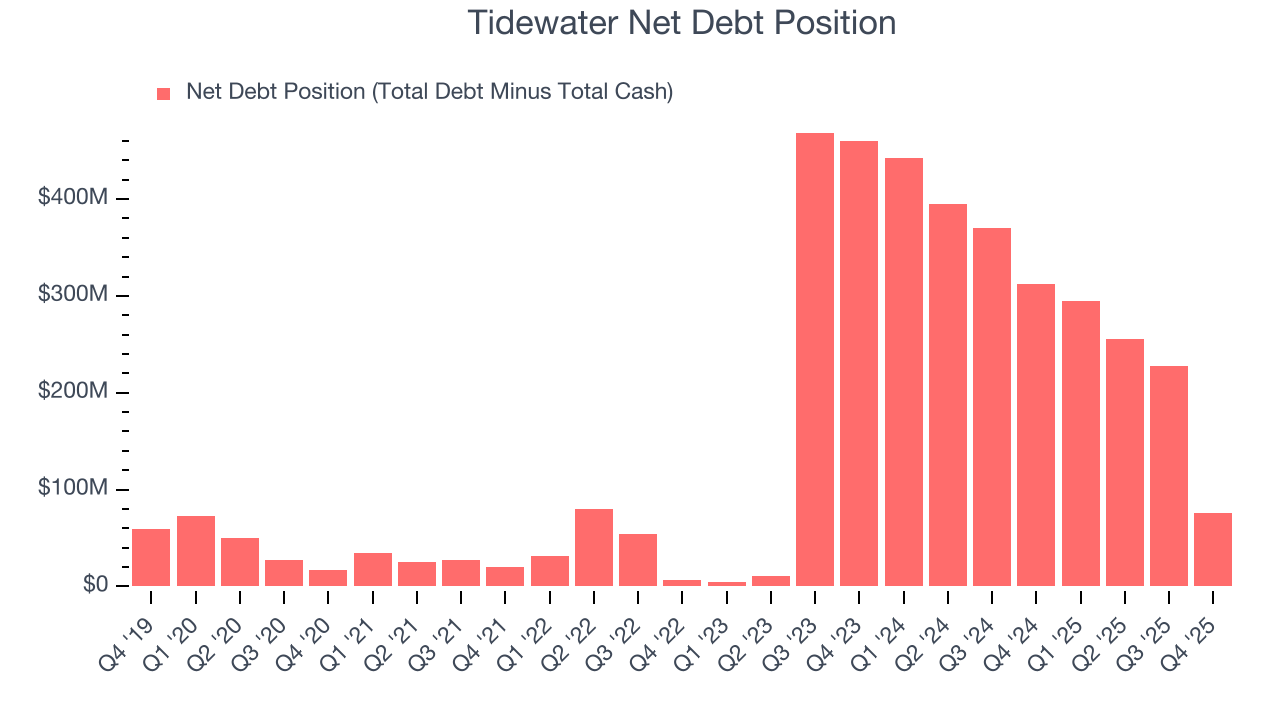
With $547.5 million of EBITDA over the last 12 months, we view Tidewater’s 0.1× net-debt-to-EBITDA ratio as safe. We also see its $57.53 million of annual interest expenses as appropriate. The company’s profits give it plenty of breathing room, allowing it to continue investing in growth initiatives.
12. Key Takeaways from Tidewater’s Q4 Results
It was encouraging to see Tidewater beat analysts’ revenue expectations this quarter. On the other hand, its EPS missed and its EBITDA fell short of Wall Street’s estimates. Overall, this quarter could have been better. The stock remained flat at $74.87 immediately after reporting.
13. Is Now The Time To Buy Tidewater?
Updated: March 23, 2026 at 1:18 AM EDT
Are you wondering whether to buy Tidewater or pass? We urge investors to not only consider the latest earnings results but also longer-term business quality and valuation as well.
Tidewater is a fine business. First off, its revenue growth over the last five years was top-tier for the sector. And while its relatively low ROIC suggests management has struggled to find compelling investment opportunities, its expanding EBITDA margin shows the business has become more efficient. On top of that, its rising returns show management's prior bets are starting to pay off.
Tidewater’s P/E ratio based on the next 12 months is 17.6x. Looking at the energy upstream and integrated energy space right now, Tidewater trades at a compelling valuation. If you’re a fan of the business and management team, now is a good time to scoop up some shares.
Wall Street analysts have a consensus one-year price target of $82.67 on the company (compared to the current share price of $72.47), implying they see 14.1% upside in buying Tidewater in the short term.