
APA Corporation (APA)
We’d invest in APA Corporation. It consistently invests in attractive growth opportunities, generating substantial cash flows and returns.― StockStory Analyst Team
1. News
2. Summary
Why We Like APA Corporation
Operating in three continents with a history stretching back to 1954, APA Corporation (NASDAQ:APA) explores for, develops, and produces crude oil, natural gas, and natural gas liquids in the U.S., Egypt, and the U.K. North Sea.
- Massive revenue base of $8.15 billion makes it a household name that influences purchasing decisions
- Healthy EBITDA margin shows it’s a well-run company with efficient processes
- Returns on capital are growing as management capitalizes on its market opportunities


APA Corporation is a standout company. The price looks reasonable based on its quality, so this could be a favorable time to buy some shares.
Why Is Now The Time To Buy APA Corporation?


At $44.56 per share, APA Corporation trades at 9.9x forward P/E. The stock’s multiple sure seems like a bargain relative to its business quality and fundamentals.
A powerful one-two punch is a company that can both grow earnings and earn a higher multiple over time. High-quality companies trading at big discounts to intrinsic value are good ways to set up this combination.
3. APA Corporation (APA) Research Report: Q4 CY2025 Update
Oil and gas producer APA Corporation (NASDAQ:APA) reported Q4 CY2025 results topping the market’s revenue expectations, but sales fell by 11.8% year on year to $1.87 billion. Its non-GAAP profit of $0.91 per share was 41.7% above analysts’ consensus estimates.
APA Corporation (APA) Q4 CY2025 Highlights:
- Revenue: $1.87 billion vs analyst estimates of $1.79 billion (11.8% year-on-year decline, 4.3% beat)
- Adjusted EPS: $0.91 vs analyst estimates of $0.64 (41.7% beat)
- Adjusted EBITDA: $1.19 billion vs analyst estimates of $1.11 billion (63.7% margin, 6.9% beat)
- Operating Margin: 28.7%, down from 37.9% in the same quarter last year
- Free Cash Flow Margin: 22.7%, up from 19.8% in the same quarter last year
- Oil production per day: down -10.6% year on year
- Market Capitalization: $13.79 billion
Company Overview
Operating in three continents with a history stretching back to 1954, APA Corporation (NASDAQ:APA) explores for, develops, and produces crude oil, natural gas, and natural gas liquids in the U.S., Egypt, and the U.K. North Sea.
The company's operations are diversified across conventional and unconventional plays, with about 62 percent of its 2024 production coming from the United States. In the U.S., APA focuses primarily on the Permian Basin of West Texas, where it holds approximately 1.4 million net acres across the Midland and Delaware sub-basins. The company operates around 4,300 gross oil and gas wells, targeting formations like the Wolfcamp, Spraberry, and Bone Spring. A pipeline company transporting natural gas from APA's Permian acreage might have contractual commitments to deliver specific volumes, while refiners purchasing APA's crude oil receive barrels priced against benchmarks like West Texas Intermediate, adjusted for quality and transportation costs.
Internationally, APA has significant conventional operations in Egypt's Western Desert, where it is the largest acreage holder with 5.3 million gross acres under production-sharing contracts with the Egyptian General Petroleum Corporation (EGPC). The company's Egyptian operations are conducted through a joint venture, with Sinopec holding a one-third minority interest. Natural gas produced in Egypt is sold primarily to EGPC under pricing formulas tied to Brent crude oil, while crude oil is either exported or sold domestically. In the U.K. North Sea, APA holds interests in mature offshore fields including Forties and Beryl, though the company suspended new drilling activity in 2023 and now focuses investment on asset safety and infrastructure integrity.
Beyond its established production areas, APA has exploration and development activities in Suriname, where it holds a 50 percent working interest with TotalEnergies in Block 58. The partners reached a final investment decision in 2024 for the GranMorgu development, which will use a floating production, storage, and offloading unit with capacity for 220,000 barrels per day located 150 kilometers offshore.
4. Mixed or Offshore Upstream E&P
This category includes smaller or niche E&P companies operating in specialized basins, geographies, or resource types outside major classifications. These firms may target unconventional resources, frontier regions, or specific commodity niches. Tailwinds include potential for outsized returns from successful exploration, acquisition opportunities during industry downturns, and specialized expertise commanding premium valuations. Headwinds include higher operational and geological risks, limited scale reducing negotiating power and cost efficiencies, and constrained capital market access during challenging commodity environments. Regulatory risks and ESG concerns may disproportionately affect smaller operators with fewer resources for compliance.
APA Corporation competes with other independent oil and gas producers including Devon Energy (NYSE:DVN), EOG Resources (NYSE:EOG), ConocoPhillips (NYSE:COP), and Occidental Petroleum (NYSE:OXY) in the Permian Basin and other regions.
5. Economies of Scale
In Energy, scale separates fragile single-asset producers from platform-style businesses that generate revenue across entire basins and infrastructure networks. APA Corporation’s $8.15 billion of revenue in the last year is top-tier for the industry, suggesting the type of diversification that reduces operational risk.
6. Revenue Growth
Cyclical industries such as Energy can make mediocre companies look great for a time, but a long-term view reveals which businesses can actually withstand and adapt to changing conditions. Over the last five years, APA Corporation grew its sales at a solid 15.6% compounded annual growth rate. Its growth surpassed the average energy upstream and integrated energy company and shows its offerings resonate with customers, a great starting point for our analysis.
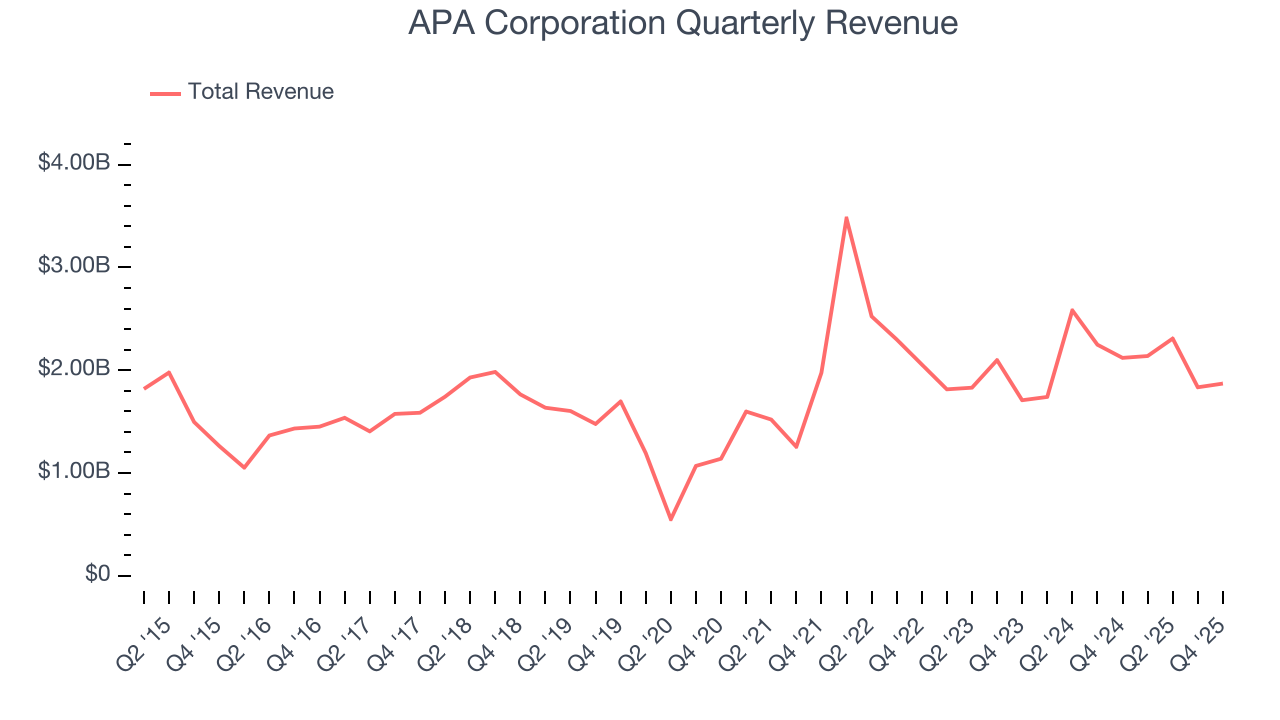
Even a long stretch in Energy can be shaped by a single commodity cycle, so extending the view to ten years adds another perspective and reveals which companies are built to grow regardless of the pricing regime. APA Corporation’s annualized revenue growth of 2.2% over the last ten years is below its five-year trend, but we still think the results were respectable.
While looking at revenue is important, it can also introduce noise around commodity prices and M&A. Analyzing production, on the other hand, highlights what is happening inside the asset base and whether the economic footprint of a company is expanding. Over the last two years, APA Corporation’s oil production per day averaged 32.4% year-on-year growth while its natural gas production per day averaged 7.1% year-on-year growth. 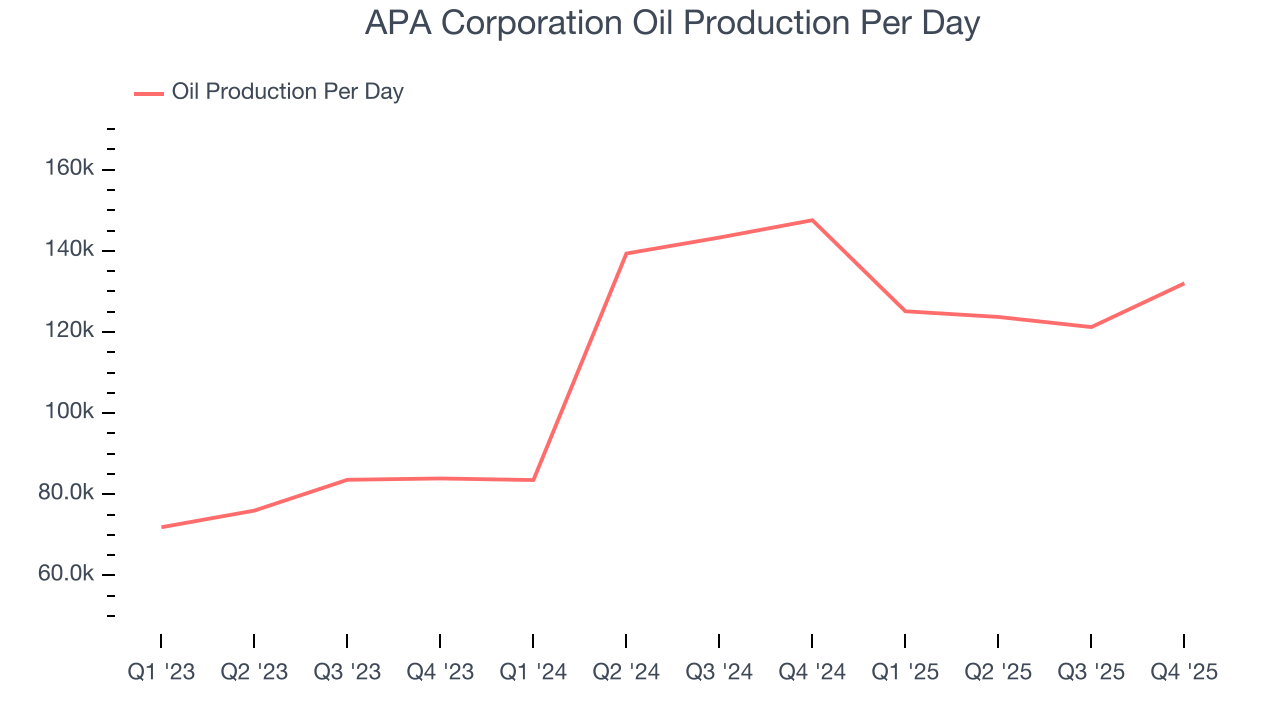
This quarter, APA Corporation’s revenue fell by 11.8% year on year to $1.87 billion but beat Wall Street’s estimates by 4.3%. This quarter, APA Corporation’s Oil production per day fell by 10.6% year on year.
7. Gross Margin
In a single quarter or year, gross margins in the sector can swing wildly due to commodity prices, hedging, or changes in labor costs. Over a multi-year period across different points in the cycle, gross margin differences can signal whether a company is a structurally-advantaged producer (“rock” quality, takeaway, operating costs) or not.
APA Corporation, which averaged 65.1% gross margin over the last five years, exhibits good unit economics in the sector. It means the company will remain profitable at lower commodity prices than peers with inferior gross margins and serves as an encouraging starting point for ultimate operating profits and free cash flow generation. 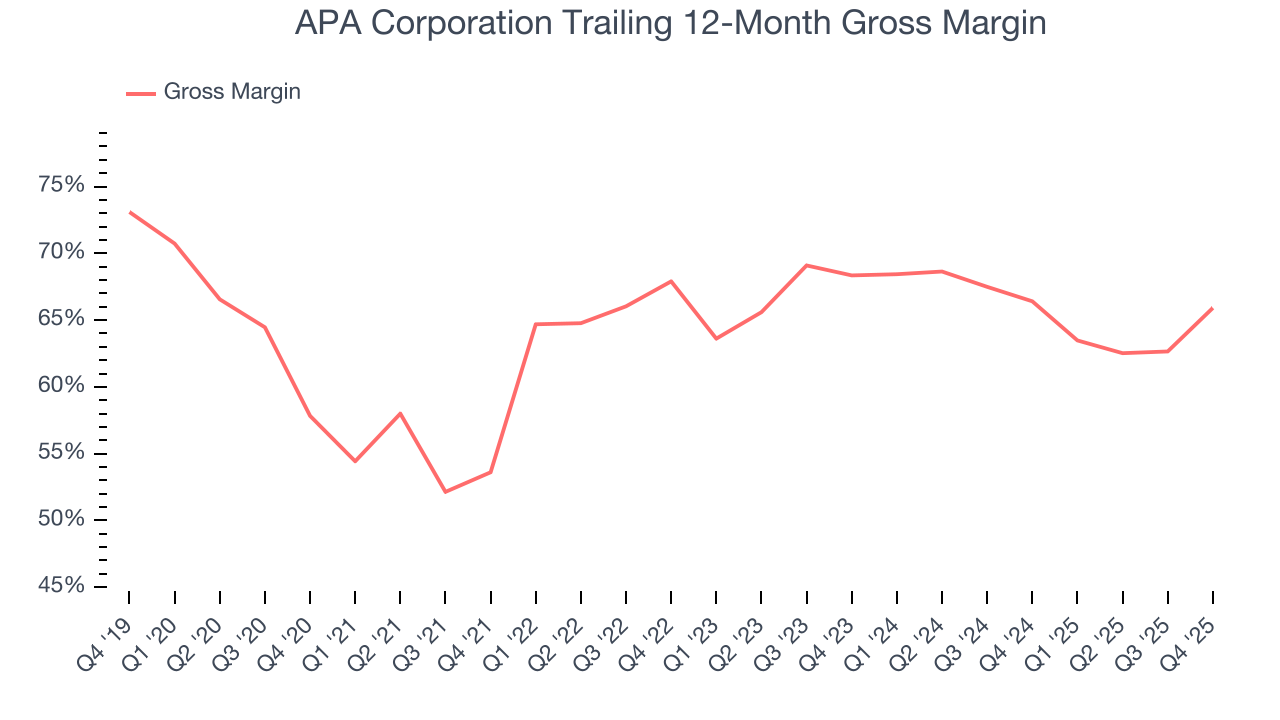
APA Corporation’s gross profit margin came in at 81.4% this quarter , marking a 14.7 percentage point increase from 66.7% in the same quarter last year. Note that energy margins can be volatile due to commodity price changes.
8. Adjusted EBITDA Margin
APA Corporation has been a well-oiled machine over the last five years. It demonstrated elite profitability for an upstream and integrated energy business, boasting an average EBITDA margin of 63.5%.
Looking at the trend in its profitability, APA Corporation’s EBITDA margin decreased by 10.4 percentage points over the last year. This raises questions about the company’s expense base because its revenue growth should have given it leverage on its fixed costs, resulting in better economies of scale and profitability.
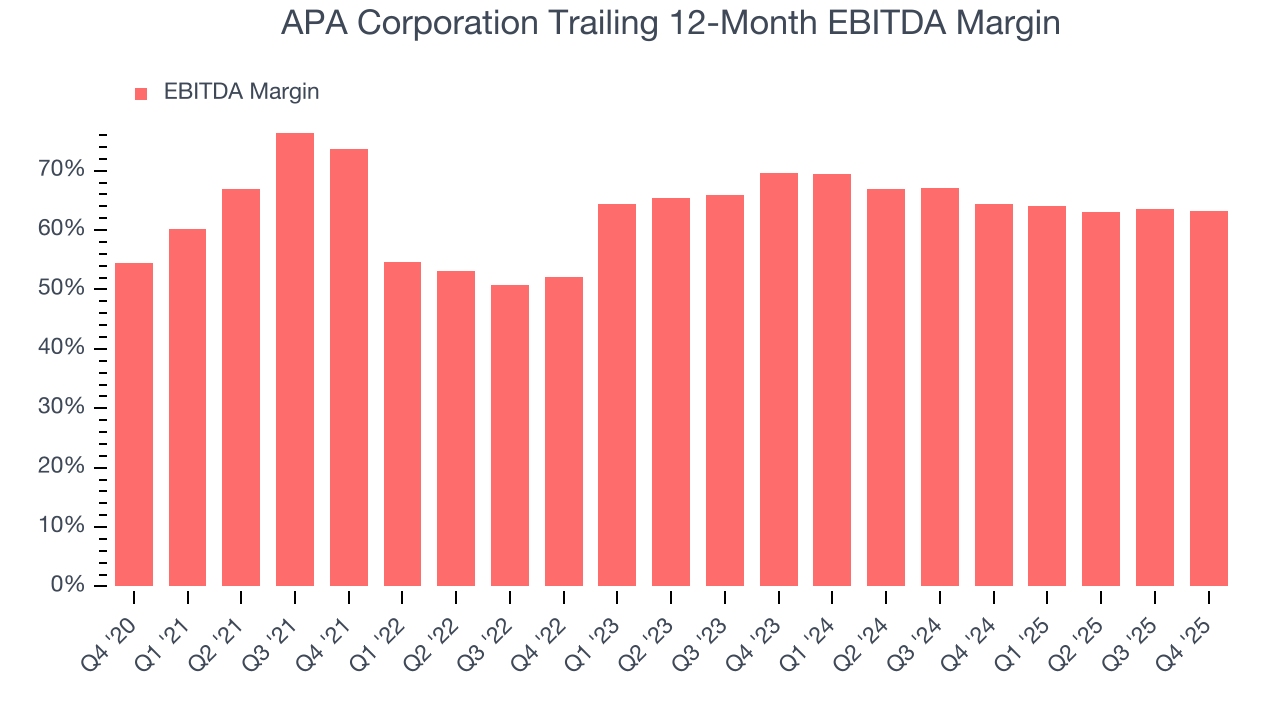
In Q4, APA Corporation generated an EBITDA margin profit margin of 63.7%, down 1.3 percentage points year on year. This reduction is quite minuscule and indicates the company’s overall cost structure has been relatively stable. This adjusted EBITDA beat Wall Street’s estimates by 6.7%.
9. Cash Is King
Adjusted EBITDA shows how profitable a company’s existing “rock” is before financing and reinvestment, while free cash flow shows how much value remains after paying to replace those wells. Because production declines over time, strong EBITDA can coexist with weak FCF if drilling is expensive or declines are steep. FCF therefore captures both operating efficiency and the cost of sustaining production.
APA Corporation has shown terrific cash profitability, driven by its lucrative business model that enables it to reinvest, return capital to investors, and stay ahead of the competition. The company’s free cash flow margin was among the best in the energy upstream and integrated energy sector, averaging 17.9% over the last five years.
While the level of free cash flow margins is important, their consistency matters just as much.
APA Corporation’s ratio of quarterly free cash flow volatility to WTI Crude price volatility over the past five years was 3.6 (lower is better), indicating unusually strong insulation from commodity swings. This stability supports superior capital access in downturns and positions APA Corporation to act as a consolidator when weaker peers are forced to retrench.
You may be asking why we wait until the free cash flow line to perform this stability analysis versus commodity prices. Why not compare revenue or EBITDA to WTI Crude prices in the case of APA Corporation? Because what ultimately matters is not how much revenue or profit you earn when prices are high but how much cash you can generate when prices are low. Free cash flow is the superior metric because it includes everything from hedging prowess to growth and maintenance capex to management behavior during good times and bad.
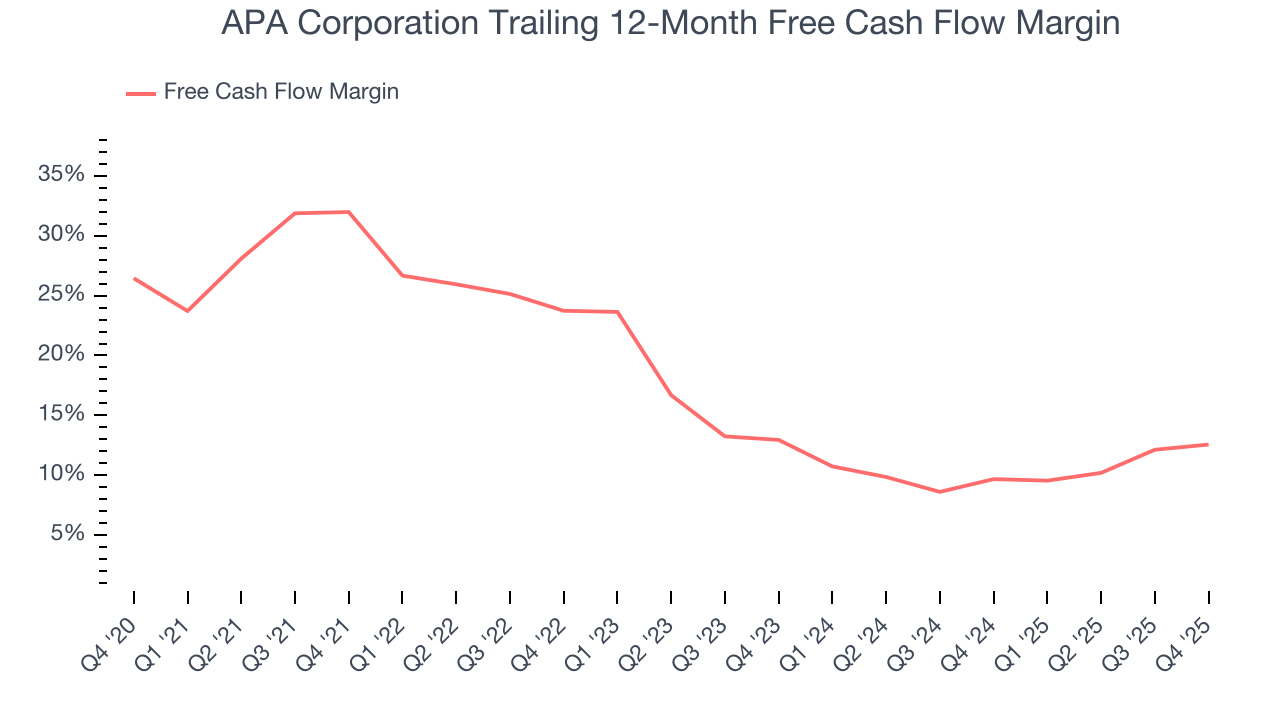
APA Corporation’s free cash flow clocked in at $425 million in Q4, equivalent to a 22.7% margin. This result was good as its margin was 2.9 percentage points higher than in the same quarter last year. Its cash profitability was also above its five-year level, and we hope the company can build on this trend.
10. Return on Invested Capital (ROIC)
Free cash flow tells investors how much money an Energy producer made, and ROIC takes this one step further by telling investors how well and effectively the business made it. ROIC illustrates how much operating profit a producer generated relative to the money it has raised (debt and equity).
We at StockStory like to look at ROIC over a ten-year period because energy investment cycles can involve up to five years of ramping production and another five years of harvesting. A decade view captures buying, extracting, and monetizing rather than just part of that picture. APA Corporation’s ten-year average ROIC was 14.2%, beating other energy upstream and integrated energy companies by a wide margin. This illustrates its management team’s ability to invest in attractive growth opportunities and produce tangible results for shareholders.
We like to invest in businesses with high returns, but the trend in a company’s ROIC is what often surprises the market and moves the stock price. Unfortunately, APA Corporation’s ROIC has decreased significantly over the last few years. Only time will tell if its new bets can bear fruit and potentially reverse the trend.
11. Balance Sheet Assessment
APA Corporation reported $516 million of cash and $4.49 billion of debt on its balance sheet in the most recent quarter. As investors in high-quality companies, we primarily focus on two things: 1) that a company’s debt level isn’t too high and 2) that its interest payments are not excessively burdening the business.
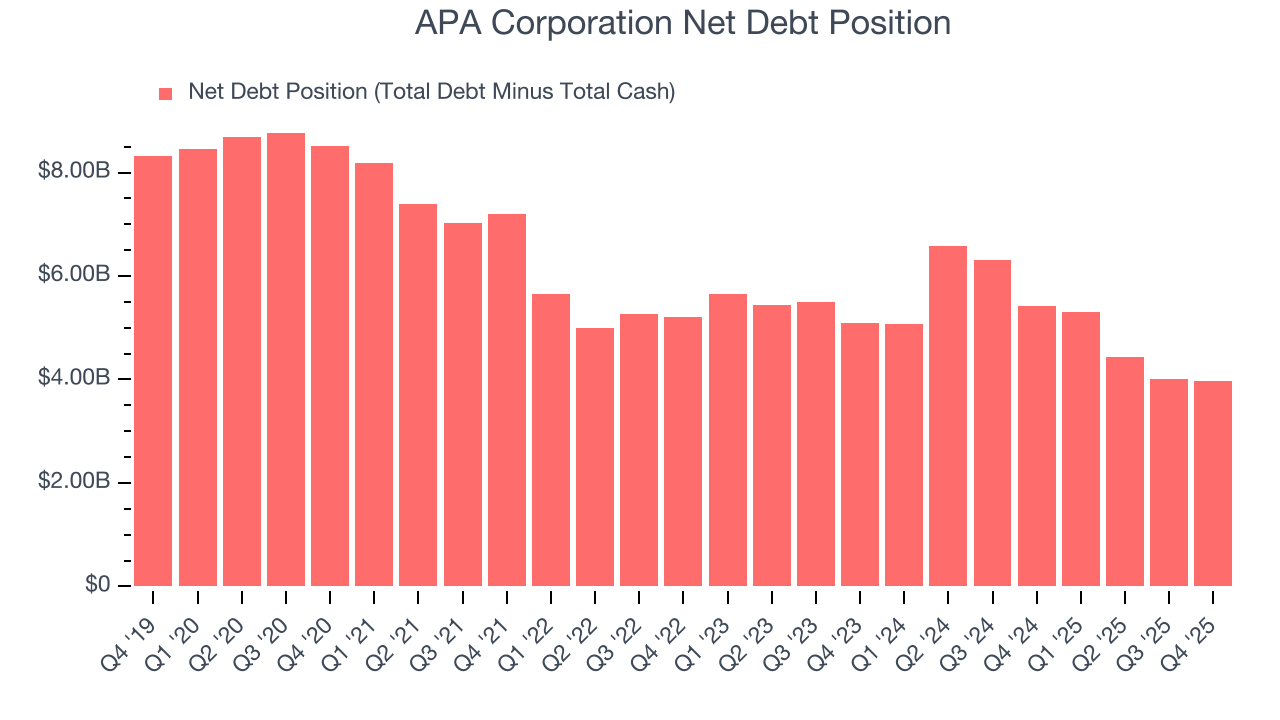
With $5.16 billion of EBITDA over the last 12 months, we view APA Corporation’s 0.8× net-debt-to-EBITDA ratio as safe. We also see its $260 million of annual interest expenses as appropriate. The company’s profits give it plenty of breathing room, allowing it to continue investing in growth initiatives.
12. Key Takeaways from APA Corporation’s Q4 Results
It was good to see APA Corporation beat analysts’ EPS expectations this quarter. We were also excited its revenue outperformed Wall Street’s estimates by a wide margin. Zooming out, we think this quarter featured some important positives. The stock traded up 5.9% to $41.32 immediately following the results.
13. Is Now The Time To Buy APA Corporation?
Updated: March 29, 2026 at 1:04 AM EDT
Before making an investment decision, investors should account for APA Corporation’s business fundamentals and valuation in addition to what happened in the latest quarter.
There is a lot to like about APA Corporation. First of all, the company’s revenue growth over the last five years was solid for the sector. And while its declining EBITDA margin shows the business has become less efficient, its top-tier scale enables operational efficiencies, capital market access, and investment in advanced technologies. On top of that, APA Corporation’s impressive EBITDA margins show it has a highly efficient business model.
APA Corporation’s P/E ratio based on the next 12 months is 9.9x. Looking across the spectrum of energy upstream and integrated energy businesses, APA Corporation’s fundamentals shine bright. We like the stock at this bargain price.
Wall Street analysts have a consensus one-year price target of $35.39 on the company (compared to the current share price of $44.56).