
California Resources (CRC)
California Resources is interesting. Its strong free cash flow generation allows it to invest in growth while maintaining a margin of safety.― StockStory Analyst Team
1. News
2. Summary
Why California Resources Is Interesting
Operating some of California's most productive oil fields including Elk Hills and Belridge, California Resources (NYSE:CRC) explores for and produces crude oil, natural gas, and natural gas liquids from fields across California.
- exceptional earning stability allow investors to sleep easy at night, positioning as a consolidator during commodity price downturns
- Strong free cash flow margin of 14.9% gives it the option to reinvest, repurchase shares, or pay dividends
- On the flip side, its efficiency has decreased over the last five years as its EBITDA margin fell by 3 percentage points


California Resources has some noteworthy aspects. If you like the stock, the valuation looks fair.
Why Is Now The Time To Buy California Resources?


California Resources’s stock price of $65.29 implies a valuation ratio of 25.9x forward P/E. While California Resources’s valuation is higher than that of many in the energy upstream and integrated energy space, we still think the valuation is fair given the top-line growth.
If you think the market is undervaluing the company, now could be a good time to build a position.
3. California Resources (CRC) Research Report: Q4 CY2025 Update
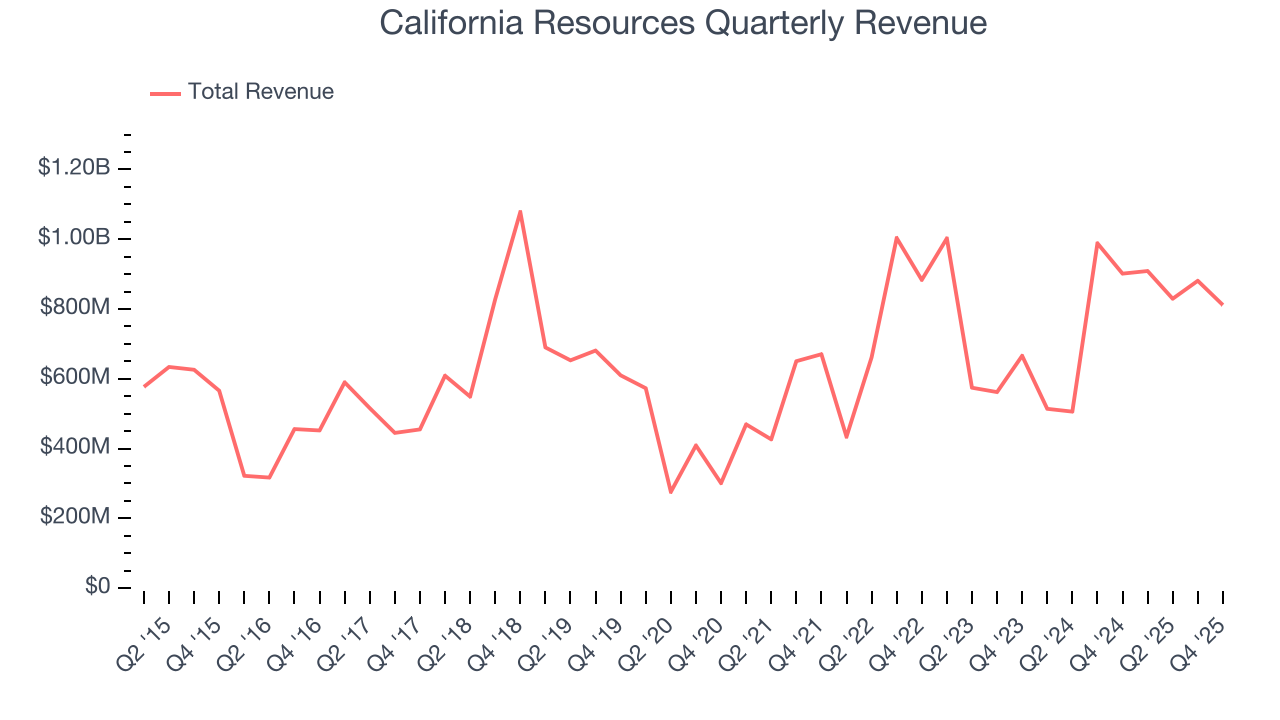
Oil and gas producer California Resources (NYSE:CRC) beat Wall Street’s revenue expectations in Q4 CY2025, but sales fell by 10% year on year to $811.5 million. Its non-GAAP profit of $0.47 per share was 6.3% below analysts’ consensus estimates.
California Resources (CRC) Q4 CY2025 Highlights:
- Revenue: $811.5 million vs analyst estimates of $795.3 million (10% year-on-year decline, 2% beat)
- Adjusted EPS: $0.47 vs analyst expectations of $0.50 (6.3% miss)
- Adjusted EBITDA: $219.8 million vs analyst estimates of $250.6 million (27.1% margin, 12.3% miss)
- Operating Margin: 5.8%, down from 7.1% in the same quarter last year
- Free Cash Flow Margin: 14.2%, up from 13.1% in the same quarter last year
- Oil production per day: down -2.7% year on year
- Market Capitalization: $5.67 billion
Company Overview
Operating some of California's most productive oil fields including Elk Hills and Belridge, California Resources (NYSE:CRC) explores for and produces crude oil, natural gas, and natural gas liquids from fields across California.
The company's operations span multiple California basins, with its most significant holdings in the San Joaquin basin. At the Belridge field, California Resources holds substantially all working and mineral interests, operating both waterflood and steamflood operations to extract oil from underground reservoirs. Steamflooding involves injecting steam into the reservoir to heat heavy oil, making it easier to pump to the surface. The company's Elk Hills field features natural gas processing facilities with a combined capacity of 330 million cubic feet per day, along with a cryogenic gas plant that chills natural gas to extremely cold temperatures to separate out valuable natural gas liquids like propane and butane. An on-site 550-megawatt power plant generates electricity to power operations at Elk Hills and nearby fields.
In the Los Angeles basin, California Resources operates in the Wilmington field under production-sharing-like arrangements with the state and city of Long Beach, where it first recovers costs and then receives a share of profits. The company sells nearly all its crude oil to California refineries through gathering systems connected to third-party pipelines, while natural gas not used in its own operations is sold into the California market at index-based prices.
Beyond traditional oil and gas operations, California Resources is developing carbon capture and storage projects through its Carbon TerraVault business segment. In December 2024, the Environmental Protection Agency issued California's first Class VI permits, allowing the company to inject and permanently store carbon dioxide deep underground in the 26R reservoir at Elk Hills. The company also owns or operates several power plants totaling over 900 megawatts of capacity, with electricity either used in its own operations or sold into California's wholesale electricity market.
4. Mixed or Offshore Upstream E&P
This category includes smaller or niche E&P companies operating in specialized basins, geographies, or resource types outside major classifications. These firms may target unconventional resources, frontier regions, or specific commodity niches. Tailwinds include potential for outsized returns from successful exploration, acquisition opportunities during industry downturns, and specialized expertise commanding premium valuations. Headwinds include higher operational and geological risks, limited scale reducing negotiating power and cost efficiencies, and constrained capital market access during challenging commodity environments. Regulatory risks and ESG concerns may disproportionately affect smaller operators with fewer resources for compliance.
California Resources competes with other California-focused oil and gas producers including Chevron (NYSE:CVX), which operates throughout the state, and Berry Corporation (NASDAQ:BRY), which focuses on the San Joaquin basin.
5. Economies of Scale
The scale of a company’s revenue base is an important lens through which to view the topline, as it signals whether a producer has gone from a vulnerable commodity taker into a durable operating platform. Larger producers generate revenue across many wells, pads, takeaway routes, and geographies rather than relying on a single field or drilling program. California Resources’s $3.43 billion of revenue in the last year lacks scale in an industry where it matters.
6. Revenue Growth
Cyclical sectors like Energy often flatter weaker operators during favorable price environments, but a longer-term lens separates those from businesses that can consistently perform across market cycles. Over the last five years, California Resources grew its sales at an impressive 17.1% compounded annual growth rate. Its growth beat the average energy upstream and integrated energy company and shows its offerings resonate with customers, a helpful starting point for our analysis.
Within Energy, a singular timeframe, even if it’s quite long-term, only sheds light on how well a company rode the last commodity cycle. To better assess whether a company compounds through cycles, we validate our view with an even longer, ten-year view. California Resources’s annualized revenue growth of 3.6% over the last ten years is below its five-year trend, but we still think the results suggest decent demand.
Revenue provides useful context, but it is heavily influenced by commodity prices and acquisitions. Production volumes, by contrast, reveal whether the underlying asset base is actually growing. Over the last two years, California Resources’s oil production per day averaged 59.6% year-on-year growth. On the other hand, its natural gas production per day averaged 7.2% year-on-year declines. 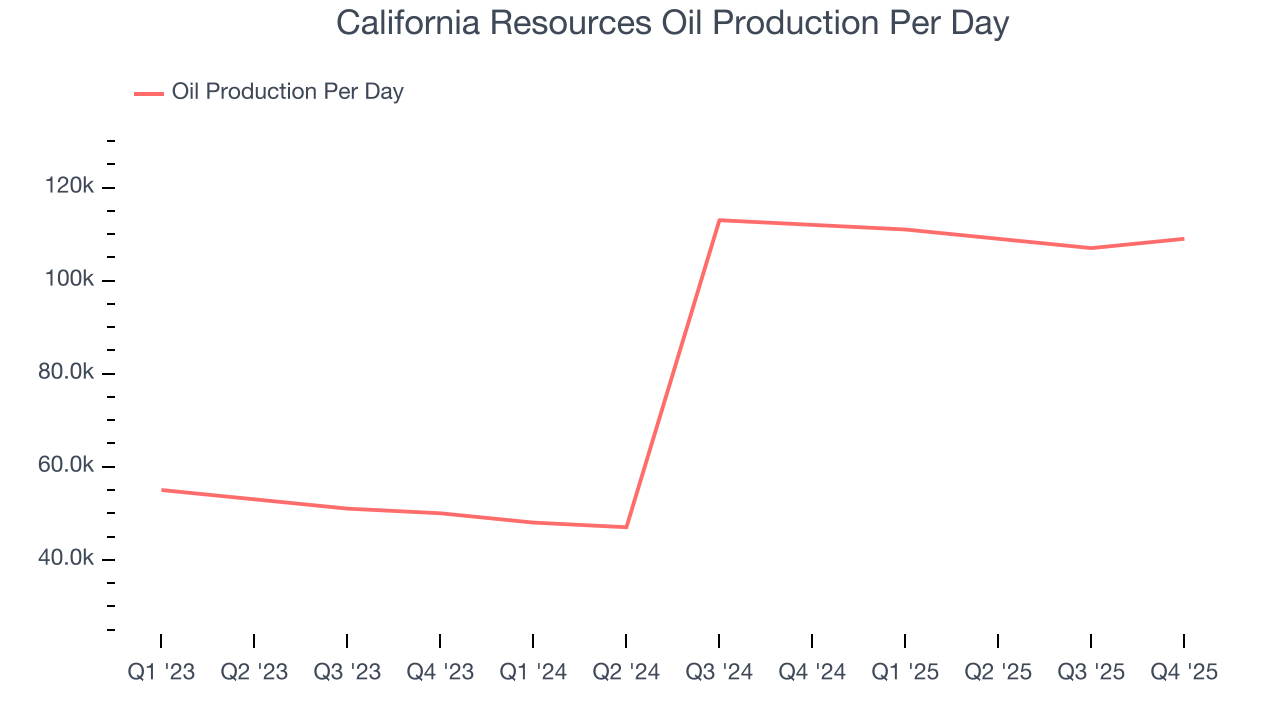
This quarter, California Resources’s revenue fell by 10% year on year to $811.5 million but beat Wall Street’s estimates by 2%. This quarter, California Resources’s Oil production per day fell by 2.7% year on year.
7. Gross Margin
In any given year, energy gross margins are heavily influenced by prices, hedging, and cost inflation, but over a full cycle these gross margins reveal which producers are structurally advantaged through superior “rock” quality, infrastructure access, and cost position.
California Resources, which averaged 55.1% gross margin over the last five years, exhibits decent unit economics in the sector. It means the company will remain profitable at lower commodity prices than peers with inferior gross margins and serves as an reasonable starting point for ultimate operating profits and free cash flow generation. 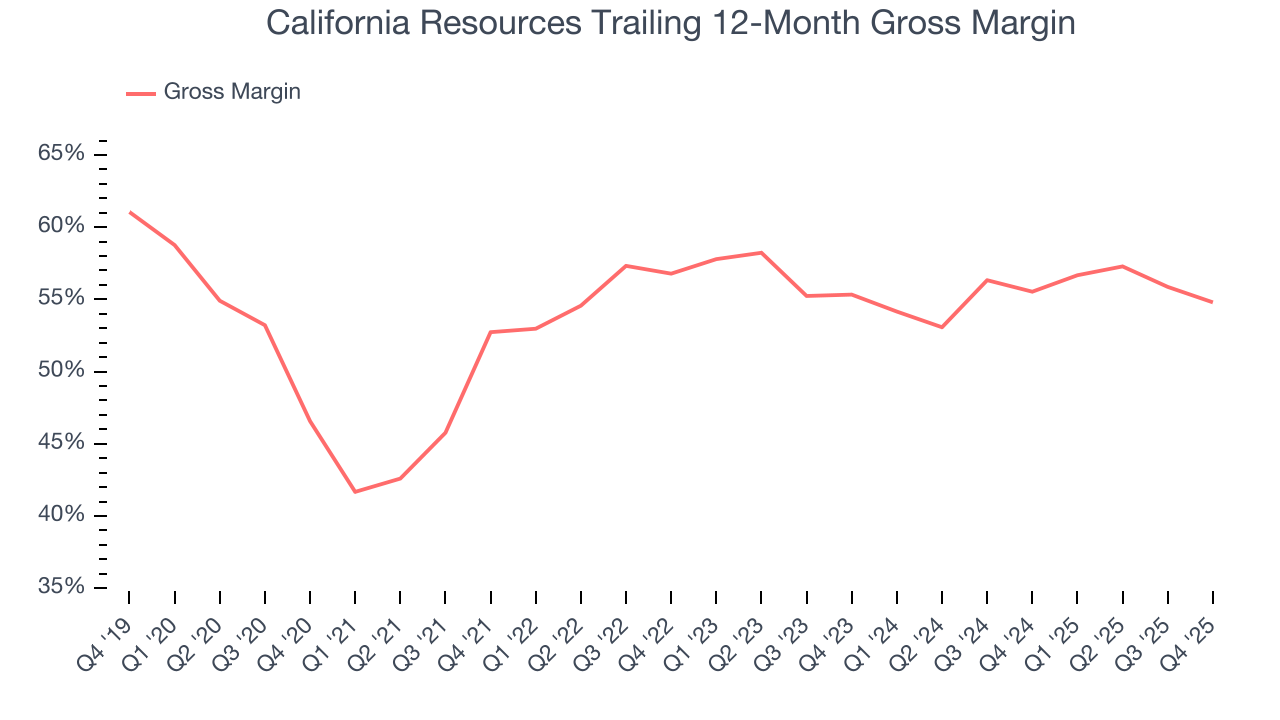
California Resources’s gross profit margin came in at 50.2% this quarter , marking a 4.6 percentage point decrease from 54.9% in the same quarter last year. Note that energy margins can be volatile due to commodity price changes.
8. Adjusted EBITDA Margin
California Resources has done a decent job managing its cost base over the last five years. The company has produced an average EBITDA margin of 34.8%, higher than the broader energy upstream and integrated energy sector.
Analyzing the trend in its profitability, California Resources’s EBITDA margin decreased by 3 percentage points over the last year. This raises questions about the company’s expense base because its revenue growth should have given it leverage on its fixed costs, resulting in better economies of scale and profitability.
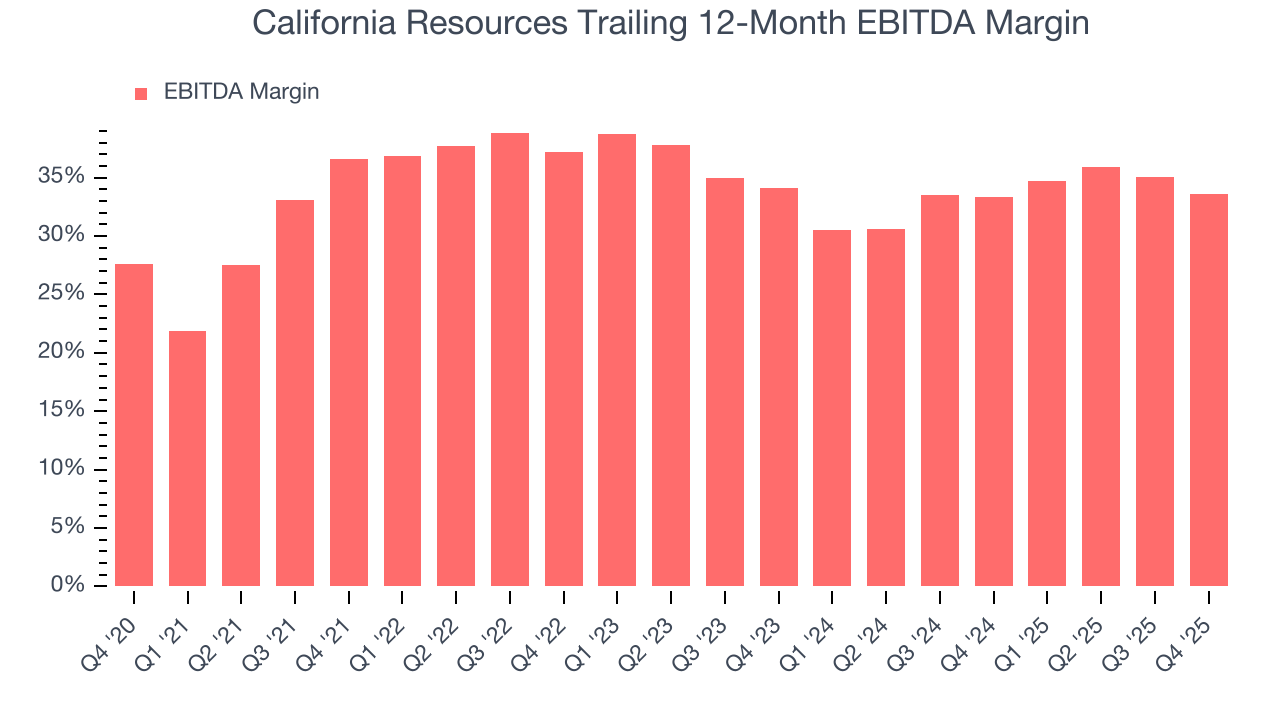
This quarter, California Resources generated an EBITDA margin profit margin of 27.1%, down 6.3 percentage points year on year. This contraction shows it was less efficient because its expenses increased relative to its revenue. This adjusted EBITDA fell short of Wall Street’s estimates.
9. Cash Is King
As mentioned above, adjusted EBITDA ignores capital structure and drilling expenditure decisions. These are two huge aspects of an Energy producer, so in order to understand a comprehensive picture of business quality, an investor needs to account for these. Said differently, adjusted EBITDA margins could be solid but free cash flow is abysmal because decline rates of the asset are extreme and the drilling is expensive. Free cash flow tells you about not only the economics of the production that has happened but how much it costs to stay in business as well (further drilling or extraction).
California Resources has shown robust cash profitability, driven by its attractive business model that enables it to reinvest or return capital to investors. The company’s free cash flow margin averaged 14.9% over the last five years, quite impressive for an upstream and integrated energy business.
While the level of free cash flow margins is important, their consistency matters just as much.
California Resources’s ratio of quarterly free cash flow volatility to WTI crude price volatility over the past five years was 3.1 (lower is better), indicating excellent insulation from commodity swings. This stability supports superior capital access in downturns and positions California Resources to act as a consolidator when weaker peers are forced to retrench.
You may be asking why we wait until the free cash flow line to perform this stability analysis versus commodity prices. Why not compare revenue or EBITDA to WTI Crude prices in the case of California Resources? Because what ultimately matters is not how much revenue or profit you earn when prices are high but how much cash you can generate when prices are low. Free cash flow is the superior metric because it includes everything from hedging prowess to growth and maintenance capex to management behavior during good times and bad.
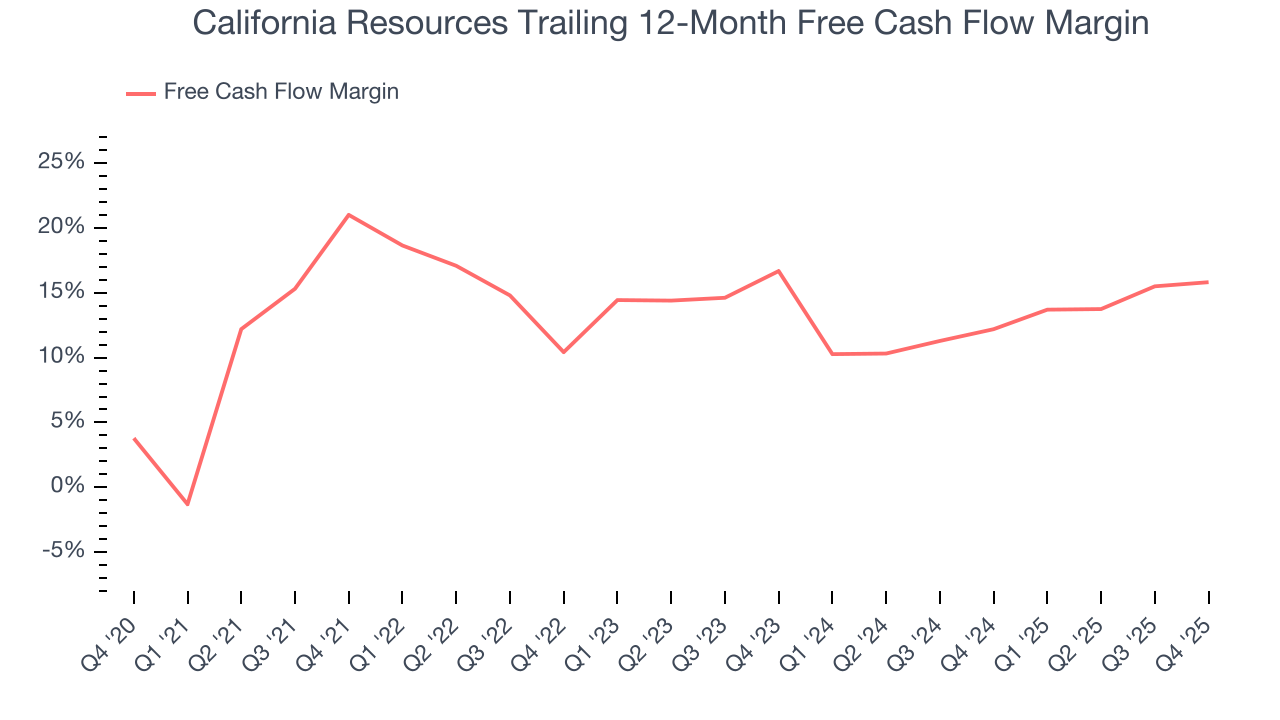
California Resources’s free cash flow clocked in at $115 million in Q4, equivalent to a 14.2% margin. This result was good as its margin was 1.1 percentage points higher than in the same quarter last year. We hope the company can build on this trend.
10. Balance Sheet Assessment
California Resources reported $132 million of cash and $1.35 billion of debt on its balance sheet in the most recent quarter. As investors in high-quality companies, we primarily focus on two things: 1) that a company’s debt level isn’t too high and 2) that its interest payments are not excessively burdening the business.
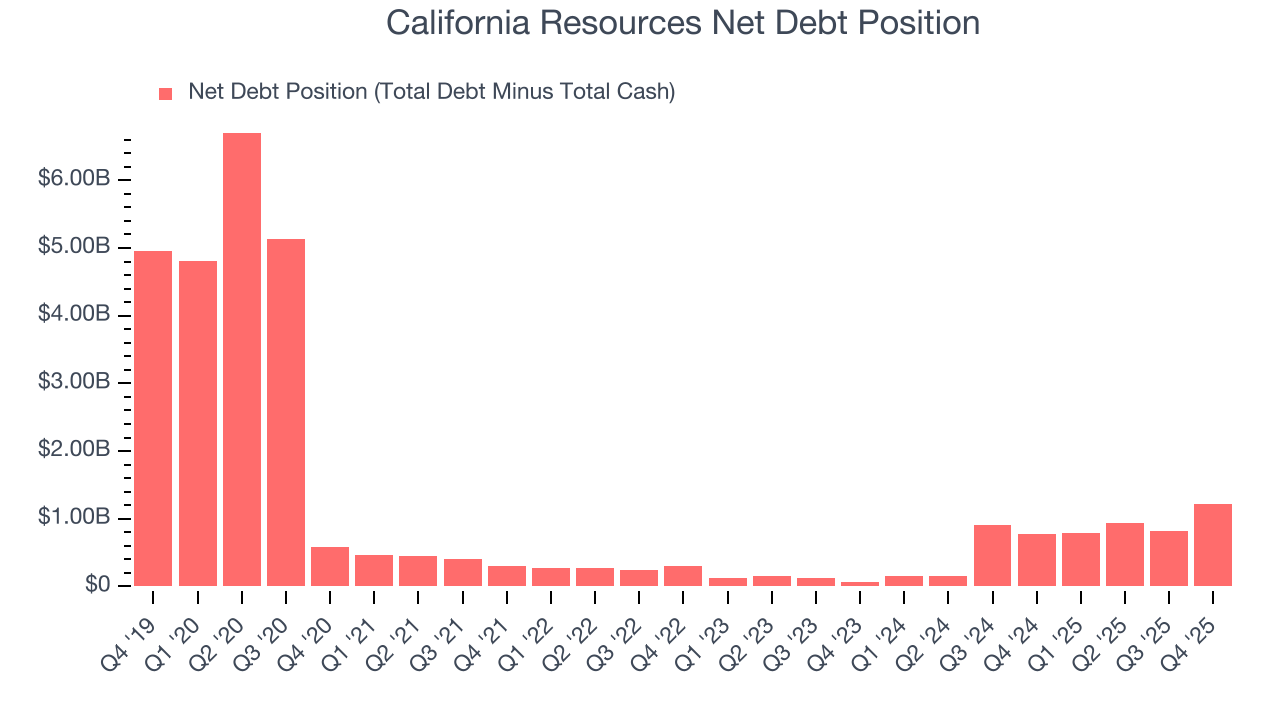
With $1.15 billion of EBITDA over the last 12 months, we view California Resources’s 1.1× net-debt-to-EBITDA ratio as safe. We also see its $106 million of annual interest expenses as appropriate. The company’s profits give it plenty of breathing room, allowing it to continue investing in growth initiatives.
11. Key Takeaways from California Resources’s Q4 Results
We enjoyed seeing California Resources beat analysts’ revenue expectations this quarter. On the other hand, its EBITDA missed and its EPS fell short of Wall Street’s estimates. Overall, this was a weaker quarter. The stock traded up 3.5% to $66.10 immediately after reporting.
12. Is Now The Time To Buy California Resources?
Updated: March 25, 2026 at 1:04 AM EDT
The latest quarterly earnings matters, sure, but we actually think longer-term fundamentals and valuation matter more. Investors should consider all these pieces before deciding whether or not to invest in California Resources.
In our opinion, California Resources is a solid company. First off, its revenue growth over the last five years was solid for the sector. And while its declining EBITDA margin shows the business has become less efficient, its free cash flowvolatility compared to commodity price volatility is very low, demonstrating top-tier free cash flow stability. On top of that, its strong free cash flow generation allows it to invest in growth initiatives while maintaining an ample cushion.
California Resources’s P/E ratio based on the next 12 months is 25.9x. Looking at the energy upstream and integrated energy space right now, California Resources trades at a compelling valuation. If you trust the business and its direction, this is an ideal time to buy.
Wall Street analysts have a consensus one-year price target of $74.69 on the company (compared to the current share price of $65.29), implying they see 14.4% upside in buying California Resources in the short term.