
Black Stone Minerals (BSM)
We’re wary of Black Stone Minerals. Its revenue growth has been weak and its profitability has caved, showing it’s struggling to adapt.― StockStory Analyst Team
1. News
2. Summary
Why We Think Black Stone Minerals Will Underperform
With roots dating to the late 1800s when railroads were expanding westward and land grants were common, Black Stone Minerals (NYSE:BSM) owns oil and natural gas mineral rights across the U.S., earning royalties when energy companies drill on its land.
- Modest revenue base of $469.9 million gives it less fixed cost leverage and fewer distribution channels than larger companies
- Efficiency has decreased over the last five years as its EBITDA margin fell by 11.3 percentage points
- On the bright side, its excellent EBITDA margin highlights the strength of its business model


Black Stone Minerals’s quality doesn’t meet our bar. We’ve identified better opportunities elsewhere.
Why There Are Better Opportunities Than Black Stone Minerals


Black Stone Minerals is trading at $15.39 per share, or 14x forward P/E. This multiple is lower than most energy upstream and integrated energy companies, but for good reason.
It’s better to pay up for high-quality businesses with higher long-term earnings potential rather than to buy lower-quality stocks because they appear cheap. These challenged businesses often don’t re-rate, a phenomenon known as a “value trap”.
3. Black Stone Minerals (BSM) Research Report: Q4 CY2025 Update
Mineral rights owner Black Stone Minerals (NYSE:BSM) announced better-than-expected revenue in Q4 CY2025, with sales up 41.8% year on year to $118.7 million. Its non-GAAP profit of $0.22 per share was 19.3% below analysts’ consensus estimates.
Black Stone Minerals (BSM) Q4 CY2025 Highlights:
- Revenue: $118.7 million vs analyst estimates of $98.2 million (41.8% year-on-year growth, 20.9% beat)
- Adjusted EPS: $0.22 vs analyst expectations of $0.27 (19.3% miss)
- Adjusted EBITDA: $76.71 million vs analyst estimates of $73.66 million (64.6% margin, 4.1% beat)
- Operating Margin: 63.1%, up from 56.8% in the same quarter last year
- Free Cash Flow Margin: 49.3%, down from 105% in the same quarter last year
- Market Capitalization: $3.21 billion
Company Overview
With roots dating to the late 1800s when railroads were expanding westward and land grants were common, Black Stone Minerals (NYSE:BSM) owns oil and natural gas mineral rights across the U.S., earning royalties when energy companies drill on its land.
The company's business model centers on owning the subsurface mineral rights beneath land across 41 states, covering approximately 16.8 million gross acres where it holds an average 43.3% ownership stake in those mineral interests. When energy companies want to drill for oil or natural gas, they lease these rights from Black Stone Minerals and pay royalties based on the value of what they extract. This means the company generates revenue without bearing the costs of exploration, drilling, or operating wells—those expenses fall to the energy operators.
Black Stone Minerals' holdings are concentrated in major producing basins including the Haynesville/Bossier shales in East Texas and Western Louisiana known for natural gas production, the oil-rich Permian Basin covering West Texas and southeastern New Mexico (encompassing both the Midland and Delaware sub-basins), the Bakken/Three Forks formations in the Williston Basin spanning North Dakota and Montana, and the Eagle Ford shale in South Texas. For example, when an operator like EOG Resources drills a horizontal well in San Augustine County, Texas to tap the Haynesville shale, Black Stone Minerals receives a percentage of the natural gas revenue without investing in the multi-million dollar drilling operation.
Beyond its core mineral interests, the company also owns non-operated working interests where it does participate in drilling costs and receives a proportionate share of production revenue, though this represents a smaller portion of its business. Additionally, Black Stone Minerals holds nonparticipating royalty interests and overriding royalty interests, which are different types of revenue-sharing arrangements tied to oil and gas production.
4. Mixed or Offshore Upstream E&P
This category includes smaller or niche E&P companies operating in specialized basins, geographies, or resource types outside major classifications. These firms may target unconventional resources, frontier regions, or specific commodity niches. Tailwinds include potential for outsized returns from successful exploration, acquisition opportunities during industry downturns, and specialized expertise commanding premium valuations. Headwinds include higher operational and geological risks, limited scale reducing negotiating power and cost efficiencies, and constrained capital market access during challenging commodity environments. Regulatory risks and ESG concerns may disproportionately affect smaller operators with fewer resources for compliance.
Black Stone Minerals competes with other mineral rights companies including Viper Energy (NASDAQ:VNOM), Sitio Royalties (NYSE:STR), Permian Resources (NYSE:PR), and TPG RE Finance Trust (NYSE:TRTX), along with numerous privately held mineral and royalty companies.
5. Revenue Scale
In Energy, scale separates fragile single-asset producers from platform-style businesses that generate revenue across entire basins and infrastructure networks. Black Stone Minerals’s $469.9 million of revenue in the last year is pretty small for the industry, suggesting the type of diversification that reduces operational risk.
6. Revenue Growth
Cyclical sectors like Energy often flatter weaker operators during favorable price environments, but a longer-term lens separates those from businesses that can consistently perform across market cycles. Over the last five years, Black Stone Minerals grew its sales at a sluggish 6.5% compounded annual growth rate. This wasn’t a great result compared to the rest of the energy upstream and integrated energy sector, but there are still things to like about Black Stone Minerals.
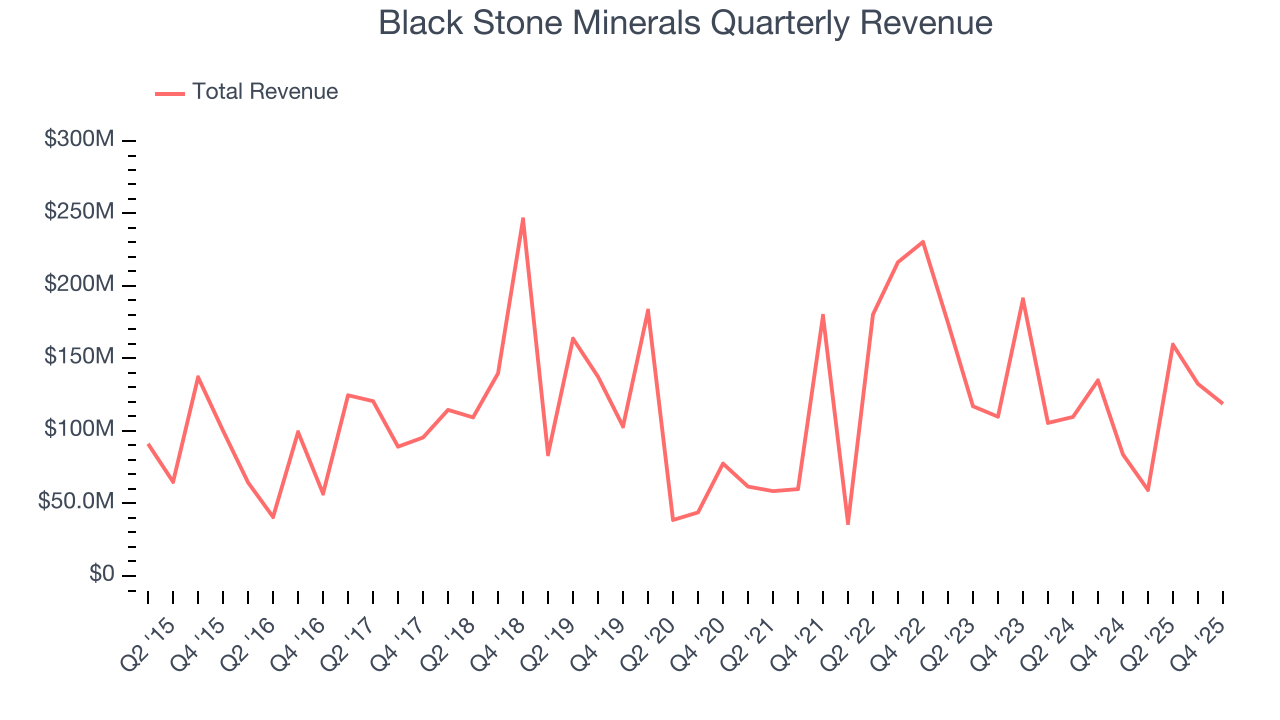
Energy cycles can be long enough that a single five-year period can still reflect one price environment, which is why an additional, decade-long view can help capture through-cycle performance. Black Stone Minerals’s annualized revenue growth of 1.8% over the last ten years is below its five-year trend, but we still think the results were respectable.
This quarter, Black Stone Minerals reported magnificent year-on-year revenue growth of 41.8%, and its $118.7 million of revenue beat Wall Street’s estimates by 20.9%.
7. Gross Margin
In a single quarter or year, gross margins in the sector can swing wildly due to commodity prices, hedging, or changes in labor costs. Over a multi-year period across different points in the cycle, gross margin differences can signal whether a company is a structurally-advantaged producer (“rock” quality, takeaway, operating costs) or not.
Black Stone Minerals, which averaged 87.4% gross margin over the last five years, exhibits impressive unit economics in the sector. It means the company will remain profitable at lower commodity prices than peers with inferior gross margins and serves as an excellent starting point for ultimate operating profits and free cash flow generation. 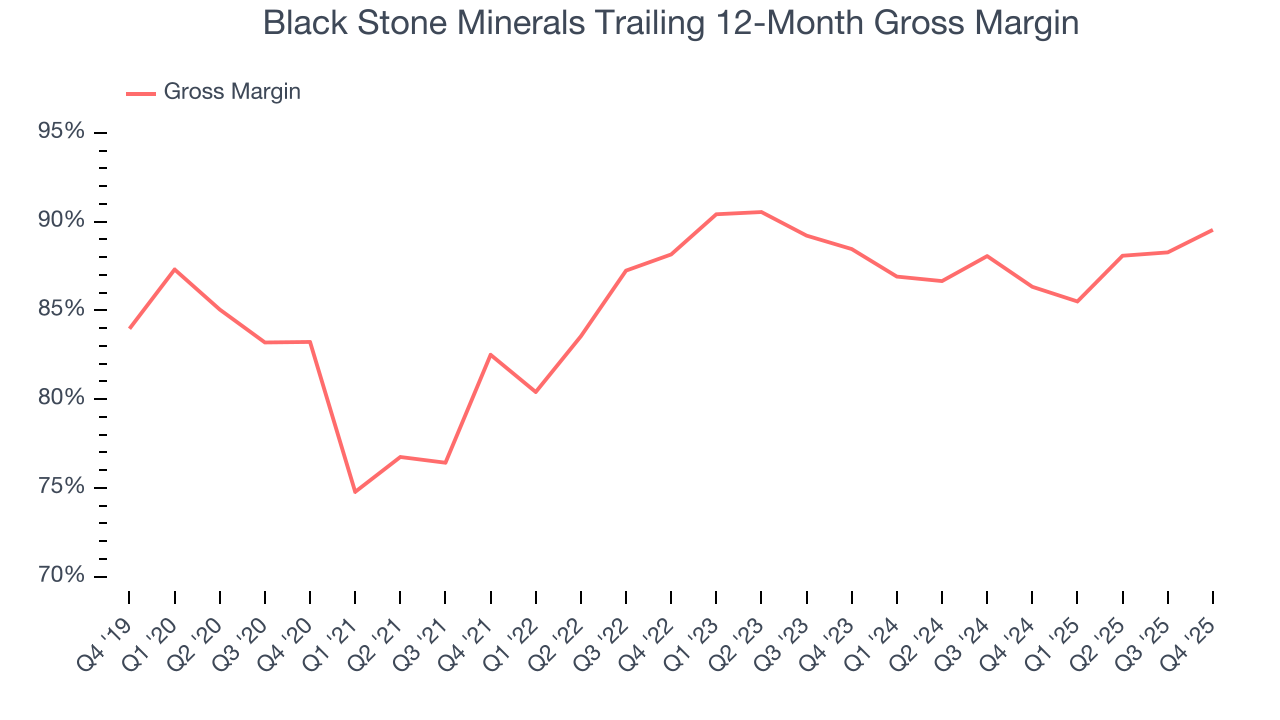
Black Stone Minerals’s gross profit margin came in at 90.6% this quarter, up 6.1 percentage points year on year.
8. Adjusted EBITDA Margin
Adjusted EBITDA margin strips out accounting distortions tied to depletion and historical drilling spend, providing a clearer view of the cash-generating power of the underlying asset base before financing and reinvestment decisions.
Black Stone Minerals has been a well-oiled machine over the last five years. It demonstrated elite profitability for an upstream and integrated energy business, boasting an average EBITDA margin of 77.2%.
Analyzing the trend in its profitability, Black Stone Minerals’s EBITDA margin decreased by 11.3 percentage points over the last year. This raises questions about the company’s expense base because its revenue growth should have given it leverage on its fixed costs, resulting in better economies of scale and profitability.
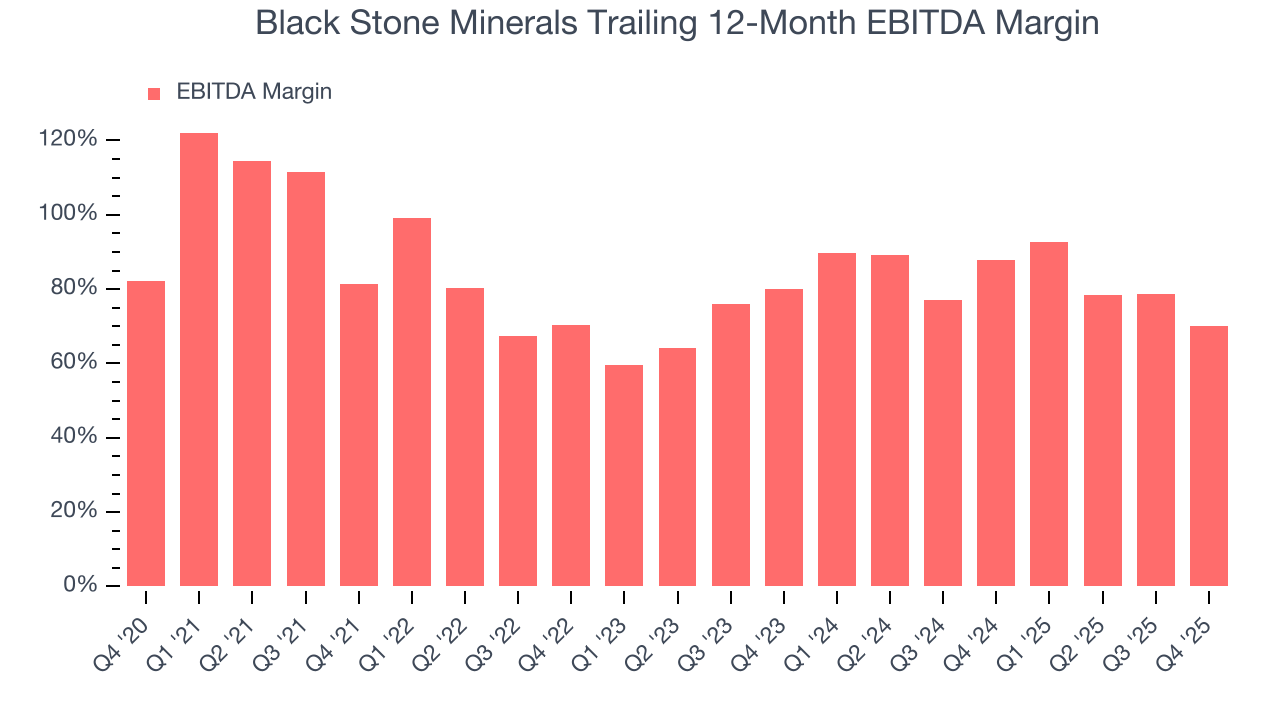
This quarter, Black Stone Minerals generated an EBITDA margin profit margin of 64.6%, down 43.1 percentage points year on year. This contraction shows it was less efficient because its expenses grew faster than its revenue. This adjusted EBITDA beat Wall Street’s estimates by 4.1%.
9. Cash Is King
Adjusted EBITDA shows how profitable a company’s existing “rock” is before financing and reinvestment, while free cash flow shows how much value remains after paying to replace those wells. Because production declines over time, strong EBITDA can coexist with weak FCF if drilling is expensive or declines are steep. FCF therefore captures both operating efficiency and the cost of sustaining production.
Black Stone Minerals has shown terrific cash profitability, enabling it to reinvest, return capital to investors, and stay ahead of the competition while maintaining an ample cushion. The company’s free cash flow margin was among the best in the energy upstream and integrated energy sector, averaging an eye-popping 74% over the last five years.
The level of free cash flow is important, but its durability across cycles is just as critical. Consistent margins are far more valuable than volatile swings driven by commodity prices.
Black Stone Minerals’s ratio of quarterly free cash flow volatility to WTI crude price volatility over the past five years was 2 (lower is better), indicating excellent insulation from commodity swings. This stability supports superior capital access in downturns and positions Black Stone Minerals to act as a consolidator when weaker peers are forced to retrench.
You may be asking why we wait until the free cash flow line to perform this stability analysis versus commodity prices. Why not compare revenue or EBITDA to WTI Crude prices in the case of Black Stone Minerals? Because what ultimately matters is not how much revenue or profit you earn when prices are high but how much cash you can generate when prices are low. Free cash flow is the superior metric because it includes everything from hedging prowess to growth and maintenance capex to management behavior during good times and bad.
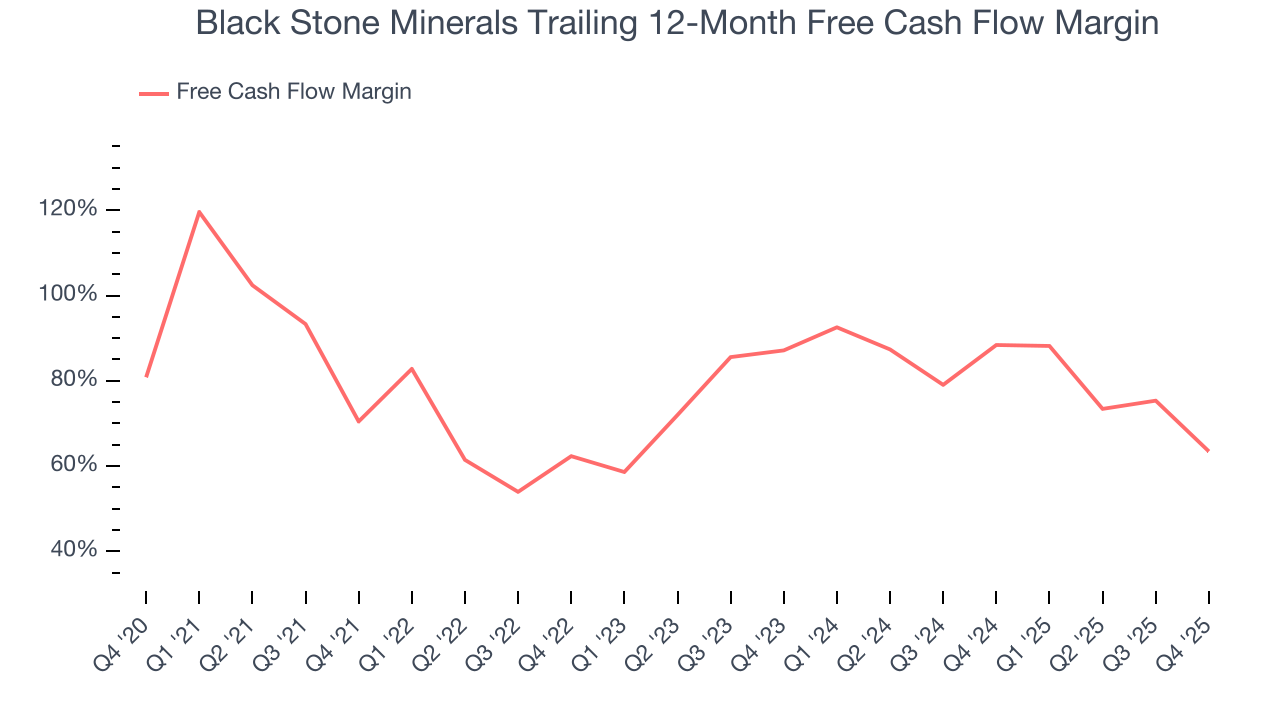
Black Stone Minerals’s free cash flow clocked in at $58.57 million in Q4, equivalent to a 49.3% margin. The company’s cash profitability regressed as it was 56 percentage points lower than in the same quarter last year, suggesting its historical struggles have dragged on.
10. Return on Invested Capital (ROIC)
Free cash flow shows how much money a producer generated, while ROIC shows how efficiently that money was earned. ROIC measures the operating profit produced for each dollar of capital invested, whether from debt or equity. Cash generation measures quantity while ROIC measures the quality of value creation.
We at StockStory like to look at ROIC over a ten-year period because energy investment cycles can involve up to five years of ramping production and another five years of harvesting. A decade view captures buying, extracting, and monetizing rather than just part of that picture. Black Stone Minerals’s ten-year average ROIC was 26.8%, placing it among the best energy upstream and integrated energy companies. This illustrates its management team’s ability to invest in highly profitable ventures and produce tangible results for shareholders.
We like to invest in businesses with high returns, but the trend in a company’s ROIC is what often surprises the market and moves the stock price. Unfortunately, Black Stone Minerals’s ROIC has decreased significantly over the last few years. Only time will tell if its new bets can bear fruit and potentially reverse the trend.
11. Balance Sheet Assessment
Black Stone Minerals reported $1.48 million of cash and $154 million of debt on its balance sheet in the most recent quarter. As investors in high-quality companies, we primarily focus on two things: 1) that a company’s debt level isn’t too high and 2) that its interest payments are not excessively burdening the business.
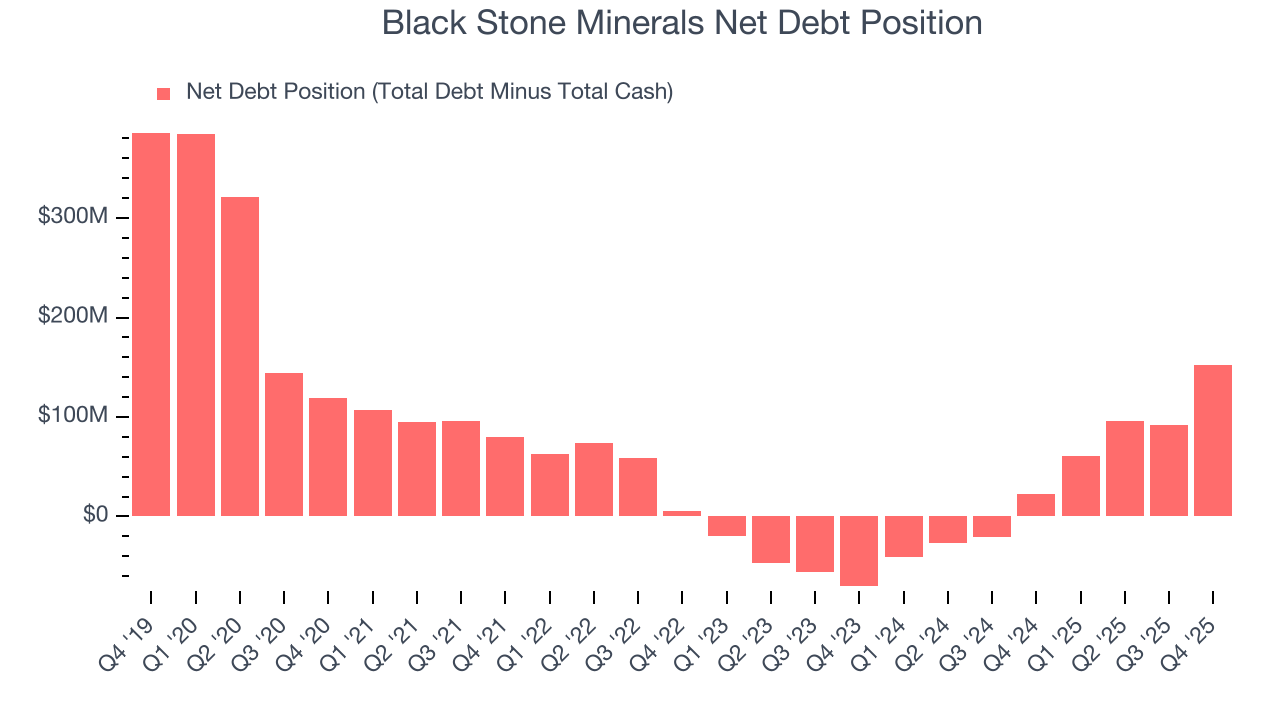
With $329.3 million of EBITDA over the last 12 months, we view Black Stone Minerals’s 0.5× net-debt-to-EBITDA ratio as safe. We also see its $8.69 million of annual interest expenses as appropriate. The company’s profits give it plenty of breathing room, allowing it to continue investing in growth initiatives.
12. Key Takeaways from Black Stone Minerals’s Q4 Results
We were impressed by how significantly Black Stone Minerals blew past analysts’ revenue expectations this quarter. We were also happy its EBITDA outperformed Wall Street’s estimates. On the other hand, its EPS missed. Zooming out, we think this was a mixed quarter. The stock traded up 1.3% to $15.32 immediately after reporting.
13. Is Now The Time To Buy Black Stone Minerals?
Updated: March 14, 2026 at 1:01 AM EDT
The latest quarterly earnings matters, sure, but we actually think longer-term fundamentals and valuation matter more. Investors should consider all these pieces before deciding whether or not to invest in Black Stone Minerals.
Black Stone Minerals isn’t a terrible business, but it isn’t one of our picks. To kick things off, its revenue growth was quite poor over the last five years, and analysts expect its demand to deteriorate over the next 12 months. While its admirable gross margin indicates excellent unit economics, the downside is its declining EBITDA margin shows the business has become less efficient. On top of that, its subscale operations hasn't hit a level of diversification where investors can sleep easy at night.
Black Stone Minerals’s P/E ratio based on the next 12 months is 14x. Beauty is in the eye of the beholder, but we don’t really see a big opportunity at the moment. We're fairly confident there are better investments elsewhere.
Wall Street analysts have a consensus one-year price target of $14 on the company (compared to the current share price of $15.39), implying they don’t see much short-term potential in Black Stone Minerals.