
Range Resources (RRC)
We’re not sold on Range Resources. Its weak sales growth and low returns on capital show it struggled to generate demand and profits.― StockStory Analyst Team
1. News
2. Summary
Why Range Resources Is Not Exciting
Focused almost entirely on the Marcellus Shale beneath Pennsylvania's forests and farmland, Range Resources (NYSE:RRC) drills for and produces natural gas, natural gas liquids, and oil from shale formations.
- ROIC of 1.4% reflects management’s challenges in identifying attractive investment opportunities
- Sales trends were unexciting over the last five years as its 8.9% annual growth was below the typical energy upstream and integrated energy company
- On the bright side, its impressive free cash flow profitability enables the company to fund new investments or reward investors with share buybacks/dividends


Range Resources’s quality is not up to our standards. There are more appealing investments to be made.
Why There Are Better Opportunities Than Range Resources


Range Resources’s stock price of $44.93 implies a valuation ratio of 12x forward P/E. This multiple is cheaper than most energy upstream and integrated energy peers, but we think this is justified.
It’s better to pay up for high-quality businesses with higher long-term earnings potential rather than to buy lower-quality stocks because they appear cheap. These challenged businesses often don’t re-rate, a phenomenon known as a “value trap”.
3. Range Resources (RRC) Research Report: Q4 CY2025 Update
Natural gas producer Range Resources (NYSE:RRC) reported revenue ahead of Wall Street’s expectations in Q4 CY2025, with sales up 8.6% year on year to $769.1 million. Its non-GAAP profit of $0.82 per share was 4.2% above analysts’ consensus estimates.
Range Resources (RRC) Q4 CY2025 Highlights:
- Revenue: $769.1 million vs analyst estimates of $755.7 million (8.6% year-on-year growth, 1.8% beat)
- Adjusted EPS: $0.82 vs analyst estimates of $0.79 (4.2% beat)
- Adjusted EBITDA: $372.1 million vs analyst estimates of $361.2 million (48.4% margin, 3% beat)
- Operating Margin: 34%, up from 13.2% in the same quarter last year
- Free Cash Flow Margin: 13.4%, up from 9.6% in the same quarter last year
- Oil production per day: up 3.6% year on year
- Market Capitalization: $10.21 billion
Company Overview
Focused almost entirely on the Marcellus Shale beneath Pennsylvania's forests and farmland, Range Resources (NYSE:RRC) drills for and produces natural gas, natural gas liquids, and oil from shale formations.
The company's operations center on extracting hydrocarbons from underground rock formations in the Appalachian region, particularly the Marcellus Shale, which stretches across Pennsylvania and neighboring states. Using horizontal drilling techniques, Range Resources operates wells that tap into these formations thousands of feet below the surface. The company controls approximately 763,000 net acres of leased land, with an average 95% working interest, meaning it owns the majority stake in most of its drilling projects and is responsible for operational decisions.
Once extracted, the raw natural gas undergoes processing through third-party facilities that separate it into different components. The lightest fraction becomes pipeline-quality natural gas sold to utilities that heat homes and businesses, as well as to industrial users and power plants. The heavier hydrocarbon streams—ethane, propane, butane, and natural gasoline collectively known as natural gas liquids—are sold separately to petrochemical companies that use them as feedstocks for plastics and other materials, or to marketers who distribute them domestically and internationally. Any oil produced is sold to refiners and crude oil transporters.
A utility company purchasing Range Resources' natural gas might distribute it through its pipeline network to residential customers for heating during winter months. A petrochemical facility might buy the company's ethane to manufacture polyethylene plastics used in packaging materials. The company generates revenue by selling these hydrocarbon products at prevailing market prices to its diverse customer base of utilities, industrial users, petrochemical companies, and commodity marketers.
4. Upstream Natural Gas E&P
Natural gas-focused E&P companies explore, develop, and produce natural gas resources serving power generation, industrial, and export markets. Natural gas is often positioned as a transition fuel given lower carbon intensity versus coal and oil. Tailwinds include growing LNG (liquefied natural gas) export demand, power generation switching from coal, and industrial consumption growth. Headwinds include natural gas price volatility driven by weather, storage levels, and competing supply sources. Infrastructure constraints may limit market access, while long-term demand faces uncertainty from renewable energy expansion and electrification trends potentially reducing gas consumption.
Range Resources competes with other Appalachian-focused natural gas producers including EQT Corporation (NYSE:EQT), Chesapeake Energy (NASDAQ:CHK), Southwestern Energy (NYSE:SWN), and Antero Resources (NYSE:AR).
5. Economies of Scale
The scale of a company’s revenue base is an important lens through which to view the topline, as it signals whether a producer has gone from a vulnerable commodity taker into a durable operating platform. Larger producers generate revenue across many wells, pads, takeaway routes, and geographies rather than relying on a single field or drilling program. Range Resources’s $2.93 billion of revenue in the last year lacks scale in an industry where it matters.
6. Revenue Growth
A company’s long-term performance can give signals about its business quality. Even a bad business, especially in a cyclical industry, can shine for a year or so, but a top-tier one should exhibit resilience through cycles. Regrettably, Range Resources’s sales grew at a mediocre 8.9% compounded annual growth rate over the last five years. This fell short of our benchmark for the energy upstream and integrated energy sector and is a tough starting point for our analysis.
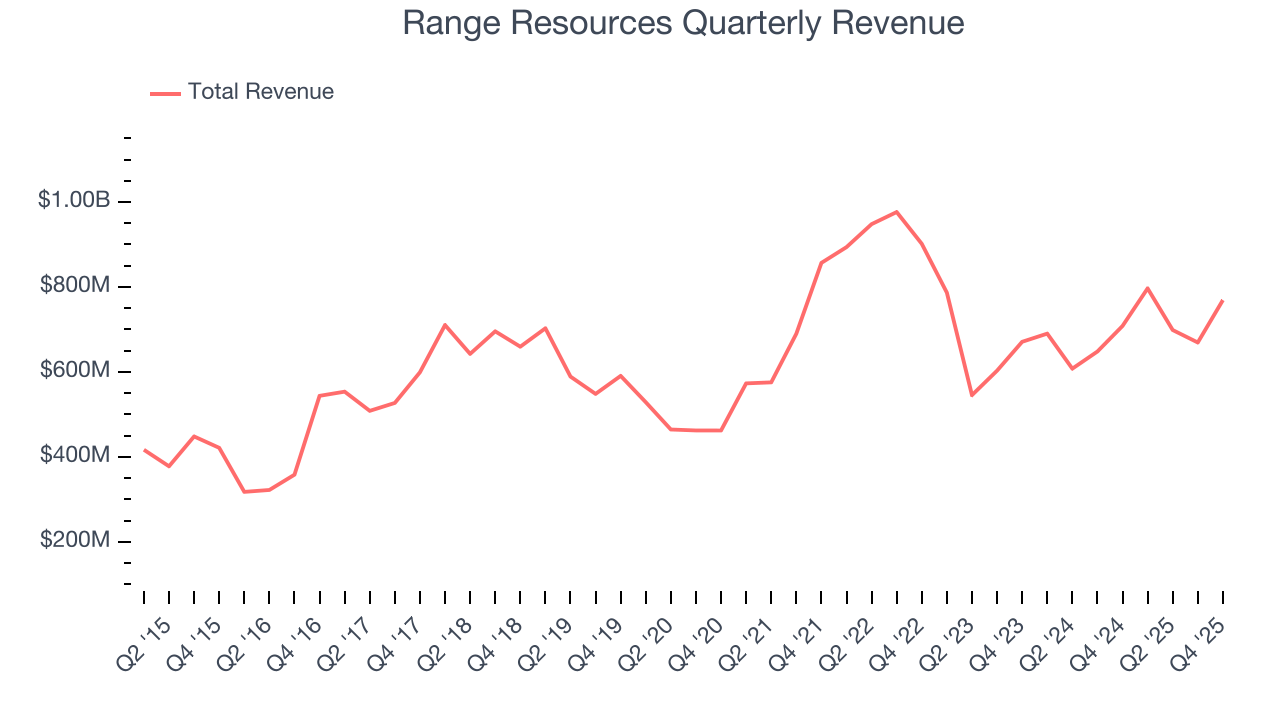
Energy cycles can be long enough that a single five-year period can still reflect one price environment, which is why an additional, decade-long view can help capture through-cycle performance. Range Resources’s annualized revenue growth of 5.8% over the last ten years is below its five-year trend, but we still think the results were good.
Revenue provides useful context, but it is heavily influenced by commodity prices and acquisitions. Production volumes, by contrast, reveal whether the underlying asset base is actually growing. Over the last two years, Range Resources’s oil production per day averaged 8.8% year-on-year declines. On the other hand, its nautral gas production per day averaged 2% year-on-year growth. 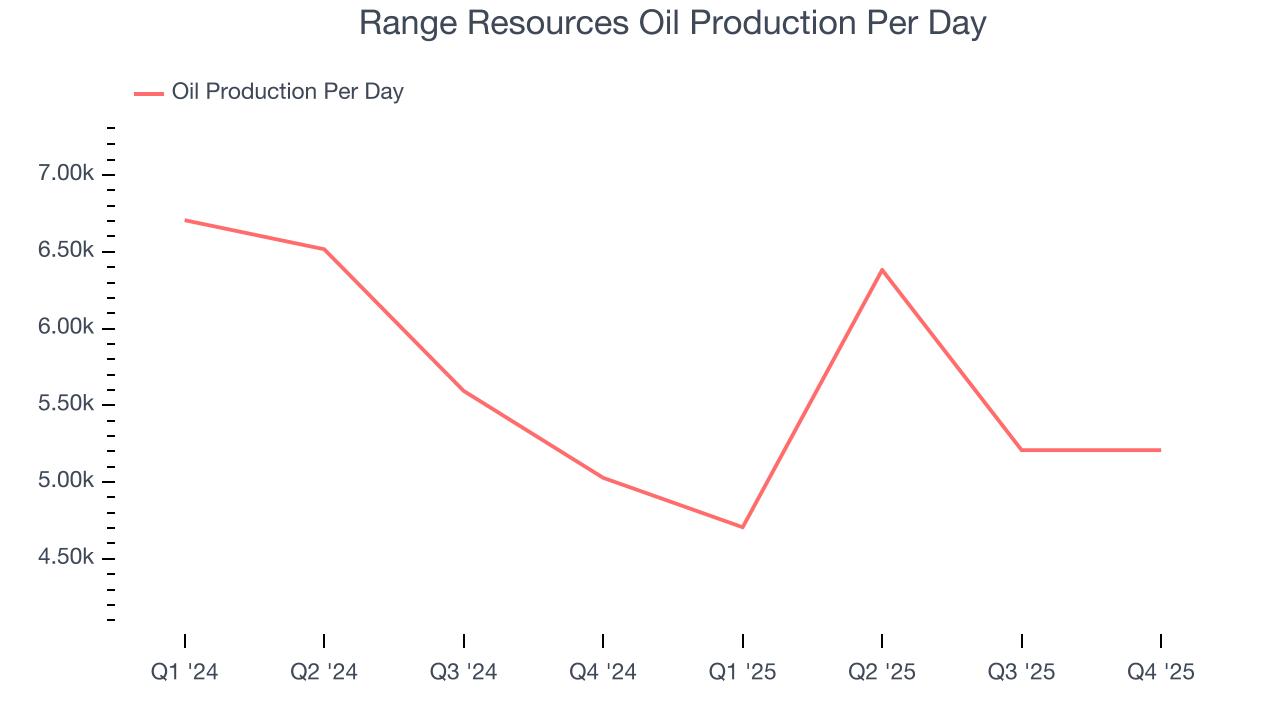
This quarter, Range Resources reported year-on-year revenue growth of 8.6%, and its $769.1 million of revenue exceeded Wall Street’s estimates by 1.8%. This quarter, Range Resources reported modest year-on-year Oil production per day growth of 3.6%.
7. Adjusted EBITDA Margin
Range Resources has been an efficient company over the last five years. It was one of the more profitable businesses in the energy upstream and integrated energy sector, boasting an average EBITDA margin of 50.1%.
Looking at the trend in its profitability, Range Resources’s EBITDA margin rose by 1.1 percentage points over the last year, as its sales growth gave it operating leverage.
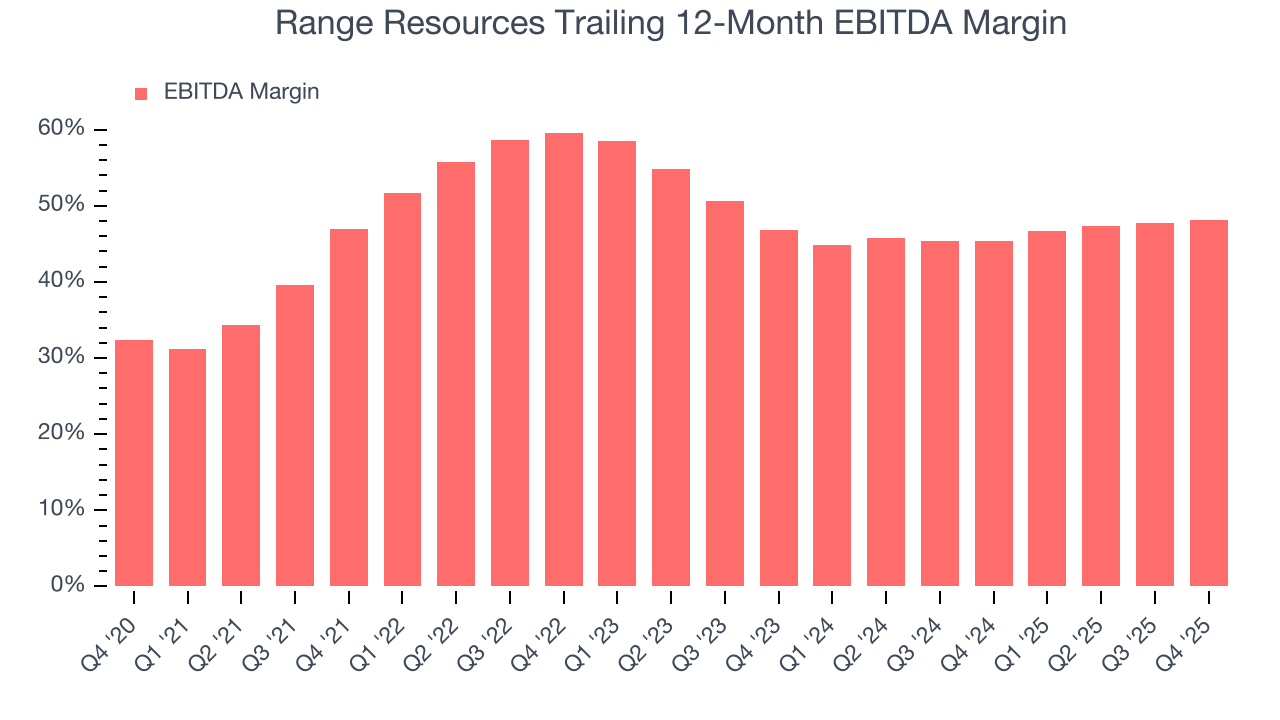
This quarter, Range Resources generated an EBITDA margin profit margin of 48.4%, up 1.2 percentage points year on year. This increase was a welcome development and shows it was more efficient. This adjusted EBITDA beat Wall Street’s estimates by 6.4%.
8. Cash Is King
Adjusted EBITDA shows how profitable a company’s existing wells are before financing and reinvestment decisions, but free cash flow shows how much value remains after paying the cost of replacing those wells. In upstream energy, production naturally declines over time, so companies must continuously reinvest just to stand still. A producer can report strong EBITDA margins yet generate little or no free cash flow if its wells decline quickly or if new drilling is expensive. Free cash flow therefore captures not only how efficiently a company produces hydrocarbons today, but also how costly it is to sustain that production into the future.
Range Resources has shown terrific cash profitability, enabling it to reinvest, return capital to investors, and stay ahead of the competition while maintaining an ample cushion. The company’s free cash flow margin was among the best in the energy upstream and integrated energy sector, averaging 20.3% over the last five years.
Absolute FCF margin levels matter but so does stability of free cash flow. All else equal, we’d prefer a 25.0% average free cash flow margin that is quite steady no matter how commodity prices behave rather than extremely high margins when times are good and negative ones when they’re tough.
Range Resources’s ratio of quarterly free cash flow volatility to Henry Hub gas-price volatility over the past five years was 2.2 (lower is better), indicating excellent insulation from commodity swings. This stability supports superior capital access in downturns and positions Range Resources to act as a consolidator when weaker peers are forced to retrench.
You may be asking why we wait until the free cash flow line to perform this stability analysis versus commodity prices. Why not compare revenue or EBITDA to Henry Hub in the case of Range Resources? Because what ultimately matters is not how much revenue or profit you earn when prices are high but how much cash you can generate when prices are low. Free cash flow is the superior metric because it includes everything from hedging prowess to growth and maintenance capex to management behavior during good times and bad.
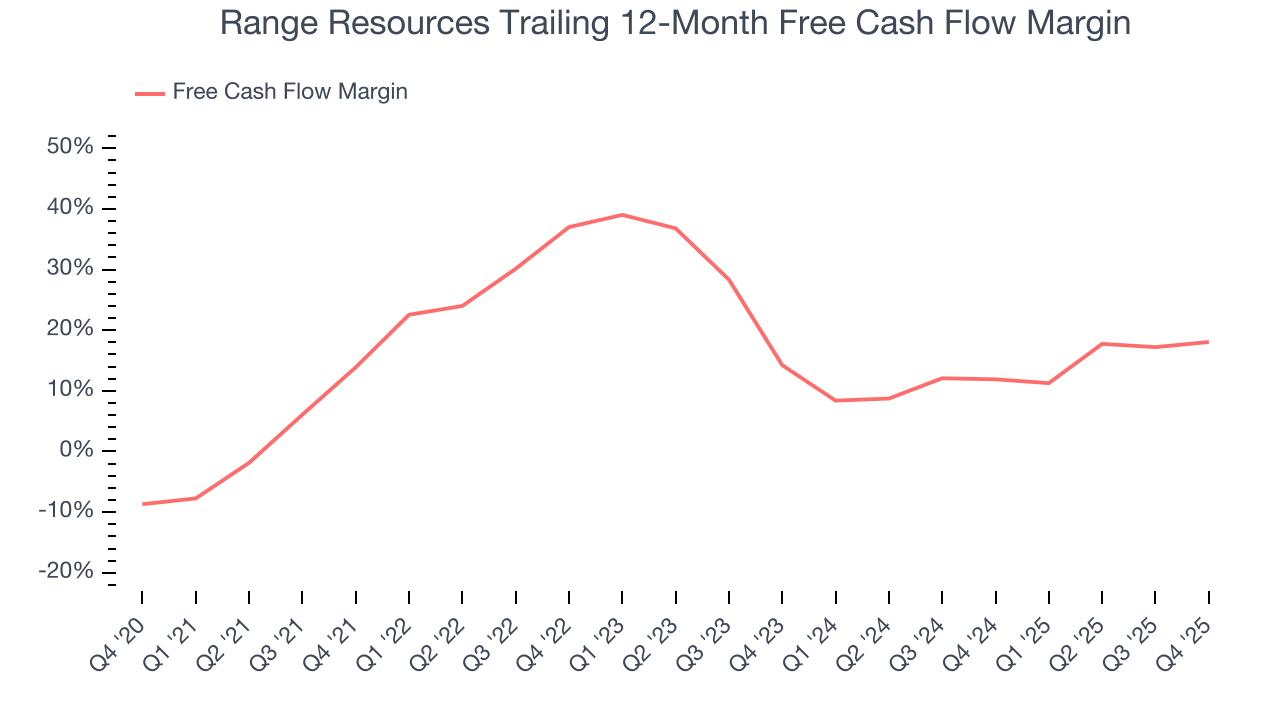
Range Resources’s free cash flow clocked in at $102.9 million in Q4, equivalent to a 13.4% margin. This result was good as its margin was 3.8 percentage points higher than in the same quarter last year, building on its favorable historical trend.
9. Return on Invested Capital (ROIC)
Free cash flow tells investors how much money an Energy producer made, and ROIC takes this one step further by telling investors how well and effectively the business made it. ROIC illustrates how much operating profit a producer generated relative to the money it has raised (debt and equity).
We at StockStory like to look at ROIC over a ten-year period because energy investment cycles can involve up to five years of ramping production and another five years of harvesting. A decade view captures buying, extracting, and monetizing rather than just part of that picture. Range Resources historically did a mediocre job investing in profitable growth initiatives. Its ten-year average ROIC was 1.4%, lower than the typical cost of capital (how much it costs to raise money) for energy upstream and integrated energy companies.
We like to invest in businesses with high returns, but the trend in a company’s ROIC is what often surprises the market and moves the stock price. Over the last few years, Range Resources’s ROIC has unfortunately decreased significantly. Paired with its already low returns, these declines suggest its profitable growth opportunities are few and far between.
10. Balance Sheet Assessment
Range Resources reported $204,000 of cash and $1.26 billion of debt on its balance sheet in the most recent quarter. As investors in high-quality companies, we primarily focus on two things: 1) that a company’s debt level isn’t too high and 2) that its interest payments are not excessively burdening the business.
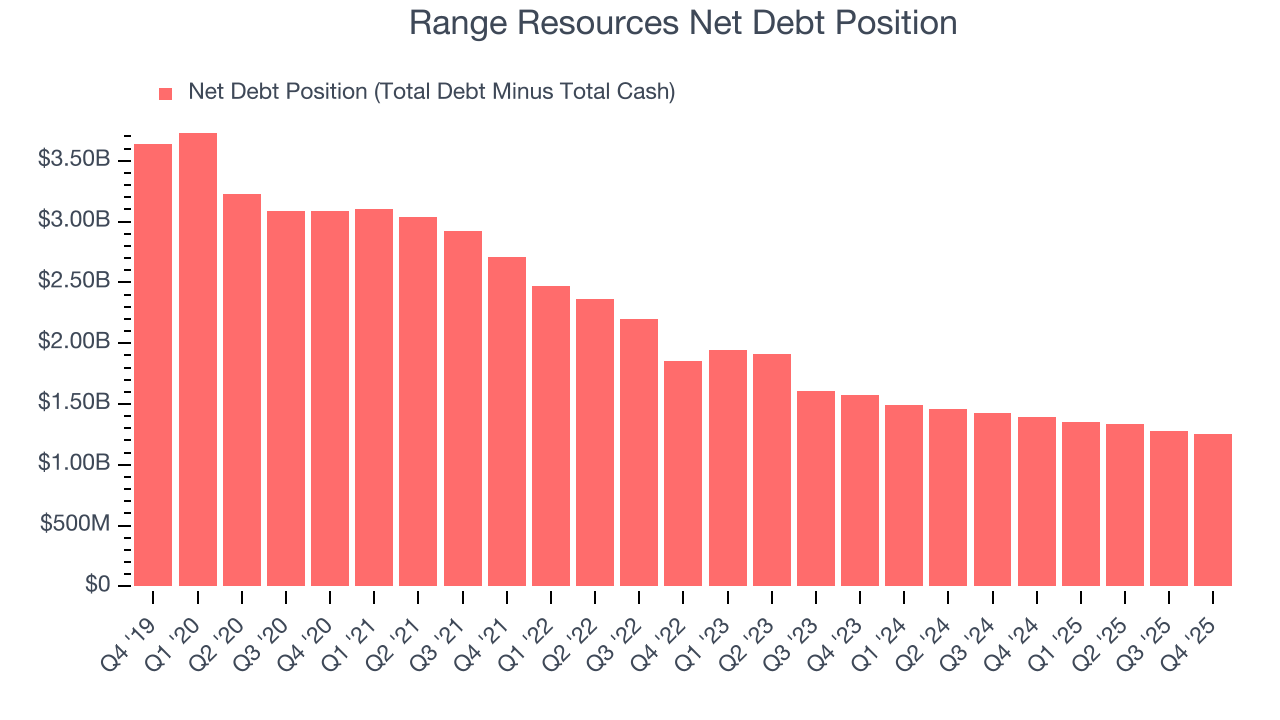
With $1.41 billion of EBITDA over the last 12 months, we view Range Resources’s 0.9× net-debt-to-EBITDA ratio as safe. We also see its $100 million of annual interest expenses as appropriate. The company’s profits give it plenty of breathing room, allowing it to continue investing in growth initiatives.
11. Key Takeaways from Range Resources’s Q4 Results
We were impressed by how significantly Range Resources blew past analysts’ revenue expectations this quarter. We were also glad its EPS outperformed Wall Street’s estimates. Zooming out, we think this was a solid print. The stock remained flat at $43.17 immediately after reporting.
12. Is Now The Time To Buy Range Resources?
Updated: March 22, 2026 at 1:01 AM EDT
The latest quarterly earnings matters, sure, but we actually think longer-term fundamentals and valuation matter more. Investors should consider all these pieces before deciding whether or not to invest in Range Resources.
There are some bright spots in Range Resources’s fundamentals, but its business quality ultimately falls short. Although its revenue growth over the last five years was subpar for the sector, its powerful free cash flow generation enables it to stay ahead of the competition through consistent reinvestment of profits. Tread carefully with this one, however, as its relatively low ROIC suggests management has struggled to find compelling investment opportunities.
Range Resources’s P/E ratio based on the next 12 months is 12x. While this valuation is fair, the upside isn’t great compared to the potential downside. We're fairly confident there are better investments elsewhere.
Wall Street analysts have a consensus one-year price target of $43.08 on the company (compared to the current share price of $44.93).