
Viper Energy (VNOM)
Viper Energy is a compelling stock. Its blend of strong revenue growth and impressive unit economics gives it attractive upside.― StockStory Analyst Team
1. News
2. Summary
Why We Like Viper Energy
Operating a business model that requires no drilling rigs or production equipment of its own, Viper Energy (NASDAQ:VNOM) owns mineral and royalty interests in oil and gas properties, collecting revenue when operators extract resources from land.
- Impressive 34% annual revenue growth over the last ten years indicates it’s winning market share this cycle
- Attractive asset base leads to wonderful unit economics and a best-in-class gross margin of 100%
- Excellent EBITDA margin highlights the strength of its business model, and its profits increased over the last five years as it scaled


Viper Energy is a standout company. The valuation looks reasonable based on its quality, so this could be a favorable time to invest in some shares.
Why Is Now The Time To Buy Viper Energy?


Viper Energy’s stock price of $46.05 implies a valuation ratio of 27.4x forward P/E. Many energy upstream and integrated energy names may carry a lower valuation multiple, but Viper Energy’s price is fair given its business quality.
Our work shows, time and again, that buying high-quality companies and holding them routinely leads to market outperformance. Over a multi-year investment horizon, entry price doesn’t matter nearly as much as business quality.
3. Viper Energy (VNOM) Research Report: Q4 CY2025 Update
Mineral and royalty company Viper Energy (NASDAQ:VNOM) announced better-than-expected revenue in Q4 CY2025, with sales up 90.2% year on year to $435 million. Its non-GAAP profit of $0.31 per share was in line with analysts’ consensus estimates.
Viper Energy (VNOM) Q4 CY2025 Highlights:
- Revenue: $435 million vs analyst estimates of $422 million (90.2% year-on-year growth, 3.1% beat)
- Adjusted EPS: $0.31 vs analyst estimates of $0.31 (in line)
- Adjusted EBITDA: $403 million vs analyst estimates of $382.8 million (92.6% margin, 5.3% beat)
- Operating Margin: -58.4%, down from 62.7% in the same quarter last year
- Free Cash Flow was $145 million, up from -$267.1 million in the same quarter last year
- Oil production: up 122% year on year
- Market Capitalization: $8.33 billion
Company Overview
Operating a business model that requires no drilling rigs or production equipment of its own, Viper Energy (NASDAQ:VNOM) owns mineral and royalty interests in oil and gas properties, collecting revenue when operators extract resources from land.
The company concentrates its holdings in the Permian Basin of West Texas, a geologically rich area spanning approximately 75,000 square miles around Midland that has produced oil continuously since the 1920s. Unlike traditional oil and gas operators that drill wells and manage production facilities, Viper owns the underlying mineral rights to acreage, which entitles it to a percentage of the revenue from any oil and gas extracted without bearing the costs of drilling, completion, or day-to-day operations.
When an operator like ExxonMobil or a smaller independent drills a well on land where Viper holds mineral interests, the company receives royalty payments based on production volumes and commodity prices. For instance, if a well on Viper's acreage produces 1,000 barrels of oil in a month and Viper owns a 2% royalty interest, it receives payment for 20 barrels at the prevailing market price, minus certain post-production costs. This structure allows Viper to benefit from rising commodity prices while the operator assumes exploration risks, capital expenditures, and operational responsibilities.
Viper's acreage portfolio spans nearly one million gross acres, with production coming from thousands of wells across multiple geological formations. The company maintains a close relationship with Diamondback Energy, which operates roughly half of Viper's net royalty acreage and owns approximately 45% of Viper's outstanding shares. This relationship provides Viper with acquisition opportunities and operational insights. The company generates revenue entirely from royalty payments tied to production volumes and hydrocarbon prices, making its financial performance directly linked to drilling activity on its acreage and fluctuations in oil and natural gas markets.
4. U.S. Shale E&P
US shale oil producers extract crude from tight rock formations using horizontal drilling and hydraulic fracturing (fracking) techniques, primarily in basins like the Permian, Bakken, and Eagle Ford. Tailwinds include short-cycle investment flexibility allowing rapid production adjustments, technological improvements enhancing well productivity, and proximity to refining and export infrastructure. Capital discipline has improved financial returns. Headwinds include commodity price sensitivity affecting drilling economics, accelerating well decline rates requiring continuous capital investment, and increasing regulatory and ESG scrutiny. Water usage, induced seismicity concerns, and evolving environmental regulations present ongoing operational challenges.
Viper Energy's competitors include other publicly traded mineral and royalty companies such as Sitio Royalties (NYSE:STR), Black Stone Minerals (NYSE:BSM), Permianville Royalty Trust (NYSE:PVL), and Texas Pacific Land Corporation (NYSE:TPL).
5. Revenue Scale
The size of the revenue base is a way to assess topline, and it tells an investor whether an Energy producer has crossed the line between being a more vulnerable commodity taker and a durable operating platform. Scaled businesses tend to produce and generate revenue from many wells, pads, takeaway routes, and geographies, not just a single field or drilling program. Viper Energy’s $1.4 billion of revenue in the last year is pretty small for the industry, suggesting the company hasn’t hit a level of diversification where investors can sleep easy at night.
6. Revenue Growth
A company’s long-term performance can give signals about its business quality. Even a bad business, especially in a cyclical industry, can shine for a year or so, but a top-tier one should exhibit resilience through cycles. Luckily, Viper Energy’s sales grew at an incredible 41% compounded annual growth rate over the last five years. Its growth surpassed the average energy upstream and integrated energy company and shows its offerings resonate with customers, a great starting point for our analysis.
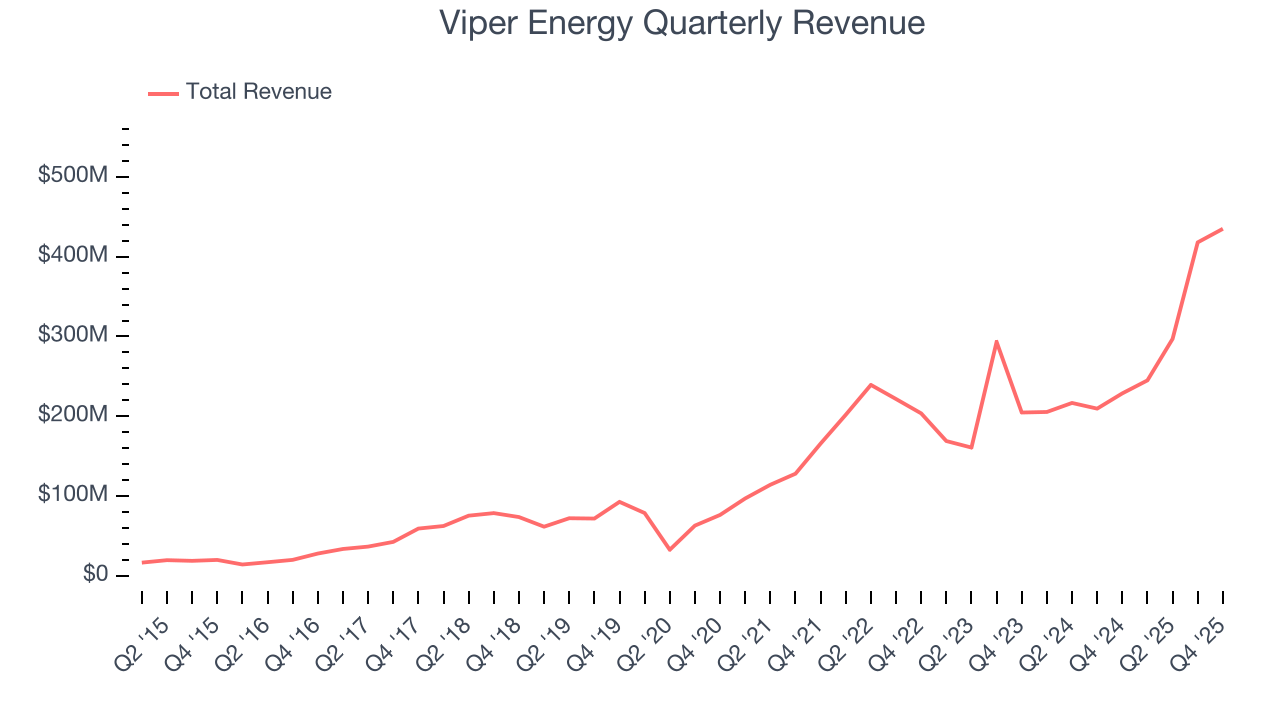
Energy cycles can be long enough that a single five-year period can still reflect one price environment, which is why an additional, decade-long view can help capture through-cycle performance. Viper Energy’s annualized revenue growth of 34% over the last ten years is below its five-year trend, but we still think the results suggest decent demand.
Revenue provides useful context, but it is heavily influenced by commodity prices and acquisitions. Production volumes, by contrast, reveal whether the underlying asset base is actually growing. Over the last two years, Viper Energy’s oil production averaged 96.1% year-on-year growth while its natural gas production averaged 130% year-on-year growth. 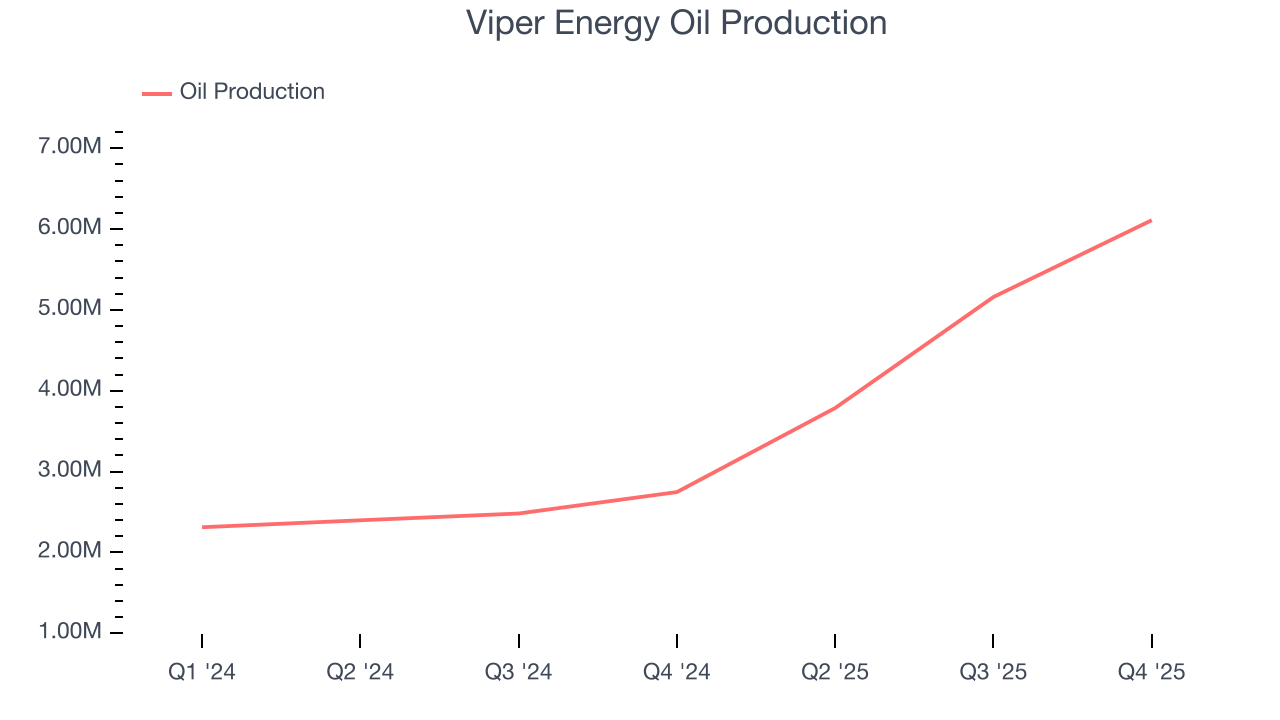
This quarter, Viper Energy reported magnificent year-on-year revenue growth of 90.2%, and its $435 million of revenue beat Wall Street’s estimates by 3.1%. This quarter, Viper Energy reported magnificent year-on-year Oil production growth of 122%.
7. Gross Margin
In any given year, energy gross margins are heavily influenced by prices, hedging, and cost inflation, but over a full cycle these gross margins reveal which producers are structurally advantaged through superior “rock” quality, infrastructure access, and cost position.
Viper Energy, which averaged 100% gross margin over the last five years, exhibits enviable unit economics in the sector. It means the company will remain profitable at lower commodity prices than peers with inferior gross margins and serves as an advantaged starting point for ultimate operating profits and free cash flow generation. 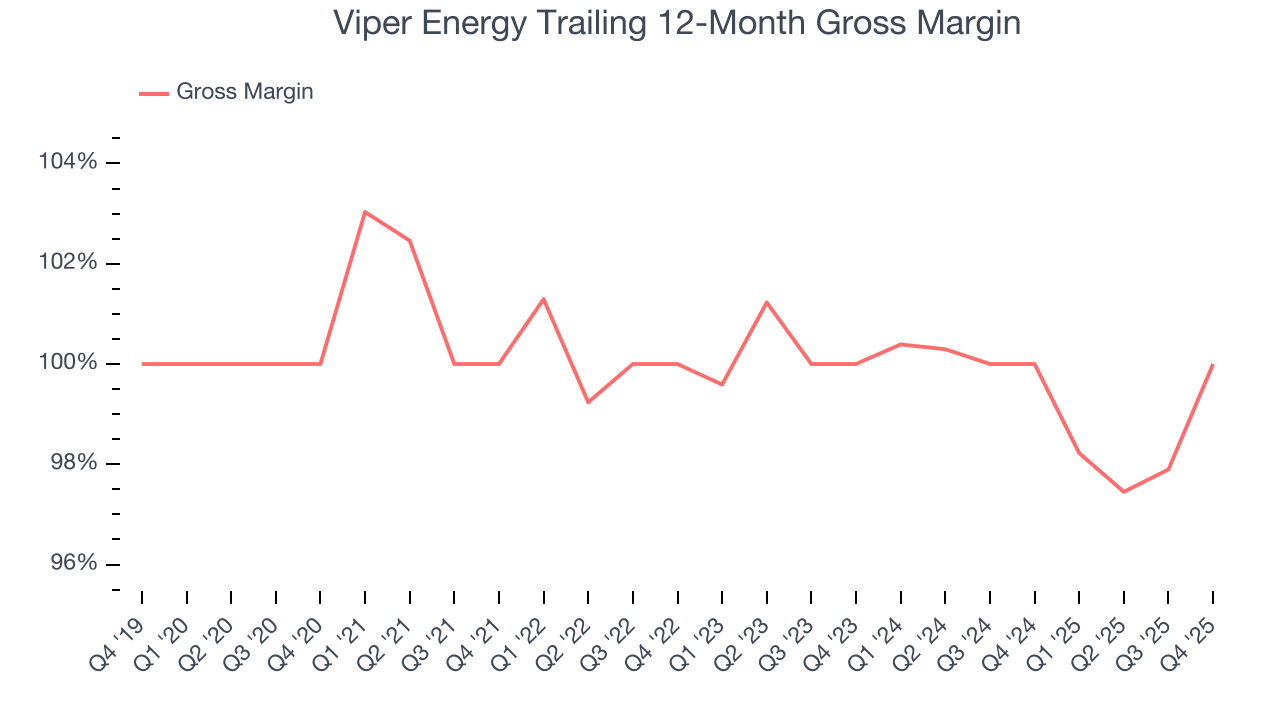
In Q4, Viper Energy produced a 106% gross profit margin, up 5.7 percentage points year on year.
8. Adjusted EBITDA Margin
Viper Energy has been a well-oiled machine over the last five years. It demonstrated elite profitability for an upstream and integrated energy business, boasting an average EBITDA margin of 91.3%.
Analyzing the trend in its profitability, Viper Energy’s EBITDA margin rose by 5.4 percentage points over the last year, as its sales growth gave it operating leverage.
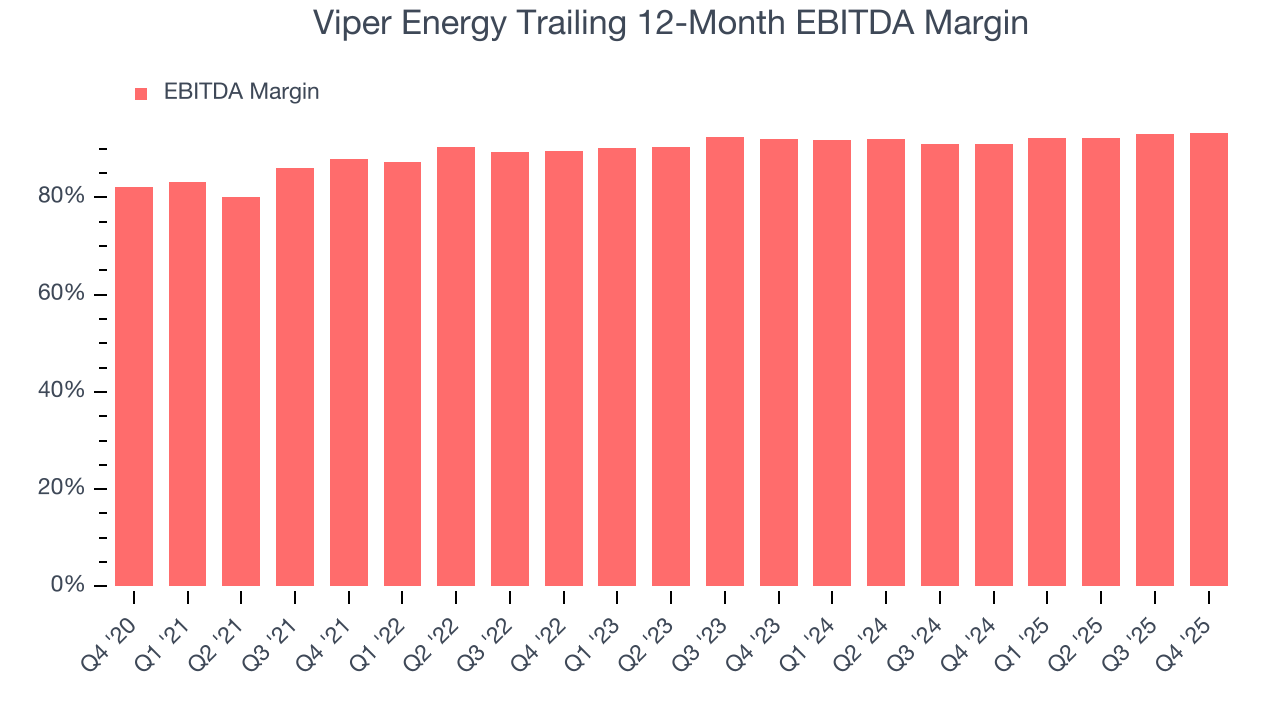
This quarter, Viper Energy generated an EBITDA margin profit margin of 92.6%, up 1.7 percentage points year on year. This increase was a welcome development and shows it was more efficient. This adjusted EBITDA beat Wall Street’s estimates by 5.3%.
9. Cash Is King
Adjusted EBITDA shows how profitable a company’s existing “rock” is before financing and reinvestment, while free cash flow shows how much value remains after paying to replace those wells. Because production declines over time, strong EBITDA can coexist with weak FCF if drilling is expensive or declines are steep. FCF therefore captures both operating efficiency and the cost of sustaining production.
While Viper Energy posted positive free cash flow this quarter, the broader story hasn’t been so clean. Viper Energy’s demanding reinvestments have drained its resources over the last five years, putting it in a pinch and limiting its ability to return capital to investors. Its free cash flow margin averaged negative 20.2%, meaning it lit $20.15 of cash on fire for every $100 in revenue.
The level of free cash flow is important, but its durability across cycles is just as critical. Consistent margins are far more valuable than volatile swings driven by commodity prices.
Viper Energy’s ratio of quarterly free cash flow volatility to WTI crude price volatility over the past five years was 42 (lower is better), indicating that its cash generation is far more sensitive to commodity-price swings than most peers. This elevated volatility limits its access to capital in downturns and makes it unlikely to act as a consolidator when weaker competitors come under pressure.
You may be asking why we wait until the free cash flow line to perform this stability analysis versus commodity prices. Why not compare revenue or EBITDA to WTI in the case of Viper Energy? Because what ultimately matters is not how much revenue or profit you earn when prices are high but how much cash you can generate when prices are low. Free cash flow is the superior metric because it includes everything from hedging prowess to growth and maintenance capex to management behavior during good times and bad.
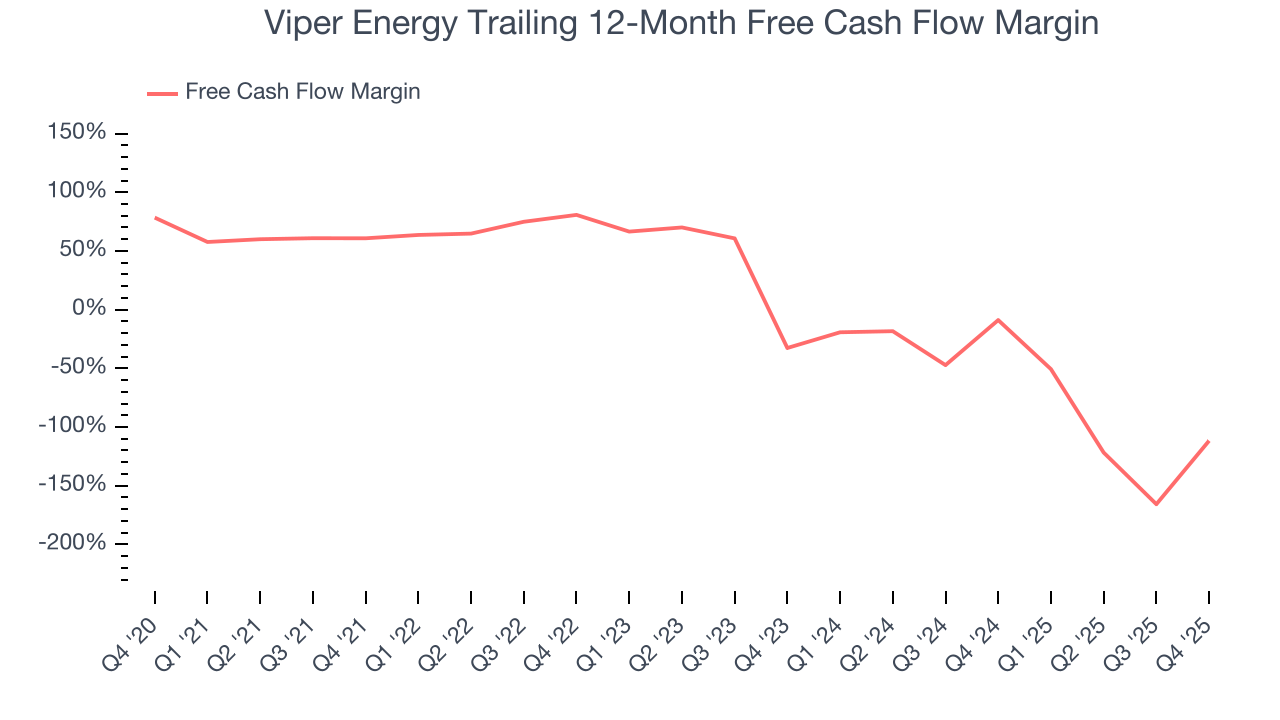
Viper Energy’s free cash flow clocked in at $145 million in Q4, equivalent to a 33.3% margin. Its cash flow turned positive after being negative in the same quarter last year
10. Return on Invested Capital (ROIC)
Free cash flow shows how much money a producer generated, while ROIC shows how efficiently that money was earned. ROIC measures the operating profit produced for each dollar of capital invested, whether from debt or equity. Cash generation measures quantity while ROIC measures the quality of value creation.
We at StockStory like to look at ROIC over a ten-year period because energy investment cycles can involve up to five years of ramping production and another five years of harvesting. A decade view captures buying, extracting, and monetizing rather than just part of that picture. Viper Energy’s ten-year average ROIC was 26.8%, placing it among the best energy upstream and integrated energy companies. This illustrates its management team’s ability to invest in highly profitable ventures and produce tangible results for shareholders.
We like to invest in businesses with high returns, but the trend in a company’s ROIC is what often surprises the market and moves the stock price. Unfortunately, Viper Energy’s ROIC has decreased significantly over the last few years. Only time will tell if its new bets can bear fruit and potentially reverse the trend.
11. Balance Sheet Assessment
Viper Energy reported $13 million of cash and $2.19 billion of debt on its balance sheet in the most recent quarter. As investors in high-quality companies, we primarily focus on two things: 1) that a company’s debt level isn’t too high and 2) that its interest payments are not excessively burdening the business.
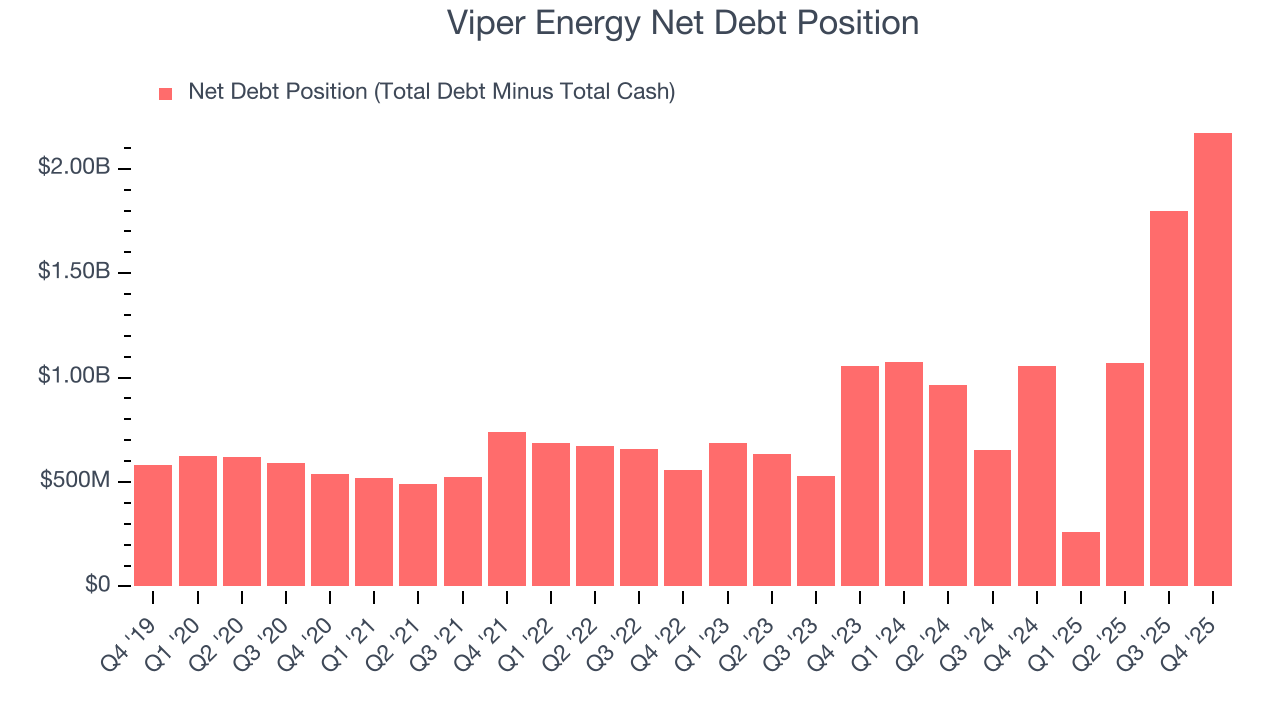
With $1.3 billion of EBITDA over the last 12 months, we view Viper Energy’s 1.7× net-debt-to-EBITDA ratio as safe. We also see its $93 million of annual interest expenses as appropriate. The company’s profits give it plenty of breathing room, allowing it to continue investing in growth initiatives.
12. Key Takeaways from Viper Energy’s Q4 Results
We enjoyed seeing Viper Energy beat analysts’ revenue expectations this quarter. We were also happy its EBITDA outperformed Wall Street’s estimates. Overall, we think this was a solid quarter with some key areas of upside. The stock traded up 1.3% to $47.75 immediately following the results.
13. Is Now The Time To Buy Viper Energy?
Updated: March 24, 2026 at 1:13 AM EDT
Before making an investment decision, investors should account for Viper Energy’s business fundamentals and valuation in addition to what happened in the latest quarter.
There are multiple reasons why we think Viper Energy is an amazing business. First of all, the company’s revenue growth over the last five years was top-tier for the sector. And while its free cash flow volatility compared to commodity price volatility is bottom-tier in the sector, leading to highly volatile free cash flow, its revenue growth over the last ten years was top-tier for the sector. Additionally, Viper Energy’s admirable gross margin indicates excellent unit economics.
Viper Energy’s P/E ratio based on the next 12 months is 27.4x. Looking at the energy upstream and integrated energy landscape today, Viper Energy’s fundamentals really stand out, and we like it at this price.
Wall Street analysts have a consensus one-year price target of $53.41 on the company (compared to the current share price of $46.05), implying they see 16% upside in buying Viper Energy in the short term.