
Comstock Resources (CRK)
Comstock Resources faces an uphill battle. Its poor sales growth and falling returns on capital suggest its growth opportunities are shrinking.― StockStory Analyst Team
1. News
2. Summary
Why We Think Comstock Resources Will Underperform
Operating in the Haynesville shale where a single well can produce millions of cubic feet of gas daily, Comstock Resources (NYSE:CRK) drills for and produces natural gas from underground shale rock formations in Louisiana and Texas.
- Cash-burning history makes us doubt the long-term viability of its business model
- Expenses have increased as a percentage of revenue over the last five years as its EBITDA margin fell by 4.5 percentage points
- Modest revenue base of $1.43 billion gives it less fixed cost leverage and fewer distribution channels than larger companies


Comstock Resources doesn’t meet our quality criteria. We’re redirecting our focus to better businesses.
Why There Are Better Opportunities Than Comstock Resources


Comstock Resources is trading at $20.56 per share, or 22x forward P/E. This multiple is high given its weaker fundamentals.
Paying up for elite businesses with strong earnings potential is better than investing in lower-quality companies with shaky fundamentals. That’s how you avoid big downside over the long term.
3. Comstock Resources (CRK) Research Report: Q4 CY2025 Update
Natural gas producer Comstock Resources (NYSE:CRK) missed Wall Street’s revenue expectations in Q4 CY2025, but sales rose 5.9% year on year to $361.8 million. Its non-GAAP profit of $0.16 per share was 38.1% above analysts’ consensus estimates.
Comstock Resources (CRK) Q4 CY2025 Highlights:
- Revenue: $361.8 million vs analyst estimates of $463 million (5.9% year-on-year growth, 21.9% miss)
- Adjusted EPS: $0.16 vs analyst estimates of $0.12 (38.1% beat)
- Adjusted EBITDA: $270.3 million vs analyst estimates of $285.2 million (74.7% margin, 5.2% miss)
- Operating Margin: 105%, up from -0.6% in the same quarter last year
- Free Cash Flow was -$141.2 million compared to -$12.9 million in the same quarter last year
- Market Capitalization: $5.75 billion
Company Overview
Operating in the Haynesville shale where a single well can produce millions of cubic feet of gas daily, Comstock Resources (NYSE:CRK) drills for and produces natural gas from underground shale rock formations in Louisiana and Texas.
The company focuses almost exclusively on the Haynesville and Bossier shale plays, geological formations thousands of feet underground that contain trapped natural gas. These shales are particularly valuable because of their location—the natural gas can flow relatively short distances through pipelines to reach major Gulf Coast markets, including liquefied natural gas (LNG) export facilities and petrochemical plants that use natural gas as both fuel and feedstock.
Comstock's operations involve drilling horizontal wells that extend thousands of feet underground, then fracturing the rock to release the trapped gas. Once extracted, the natural gas flows through gathering pipelines to treating facilities that remove impurities before the gas enters long-haul transmission pipelines. For its newer Western Haynesville area, the company formed Pinnacle Gas Services in partnership with Quantum Capital Solutions to build and operate the necessary gathering pipelines and gas treating plants, ensuring it can transport production from remote drilling sites to market.
The company controls over 800,000 net acres of land prospective for these shale plays, providing an inventory of potential drilling locations. As of late 2024, roughly 73% of its proved reserves were already developed, meaning wells were drilled and producing, while the remainder represents future drilling opportunities. With proved reserves representing approximately seven years of production at current rates, Comstock continually drills new wells to maintain and potentially grow its output.
The company sells its natural gas under various contract structures—some tied to monthly index prices that reflect regional supply and demand, others based on daily spot market prices, and some at fixed prices negotiated in advance. Major customers include Enterprise Products Operating and Venture Global LNG, the latter operating an LNG export terminal. To ensure reliable market access, Comstock has secured firm transportation capacity averaging approximately 1.7 billion cubic feet per day on long-haul pipelines, guaranteeing space to move its production even when pipelines are congested.
4. Upstream Natural Gas E&P
Natural gas-focused E&P companies explore, develop, and produce natural gas resources serving power generation, industrial, and export markets. Natural gas is often positioned as a transition fuel given lower carbon intensity versus coal and oil. Tailwinds include growing LNG (liquefied natural gas) export demand, power generation switching from coal, and industrial consumption growth. Headwinds include natural gas price volatility driven by weather, storage levels, and competing supply sources. Infrastructure constraints may limit market access, while long-term demand faces uncertainty from renewable energy expansion and electrification trends potentially reducing gas consumption.
Comstock Resources competes with other natural gas producers focused on the Haynesville shale, including Chesapeake Energy (NASDAQ:CHK), Southwestern Energy (NYSE:SWN), and Expand Energy (NYSE:EXE), along with numerous smaller independent producers in the region.
5. Revenue Scale
In Energy, scale separates fragile single-asset producers from platform-style businesses that generate revenue across entire basins and infrastructure networks. Comstock Resources’s $1.43 billion of revenue in the last year is pretty small for the industry, suggesting the type of diversification that reduces operational risk.
6. Revenue Growth
Cyclical sectors like Energy often flatter weaker operators during favorable price environments, but a longer-term lens separates those from businesses that can consistently perform across market cycles. Unfortunately, Comstock Resources’s 7.4% annualized revenue growth over the last five years was tepid. This was below our standard for the energy upstream and integrated energy sector and is a rough starting point for our analysis.
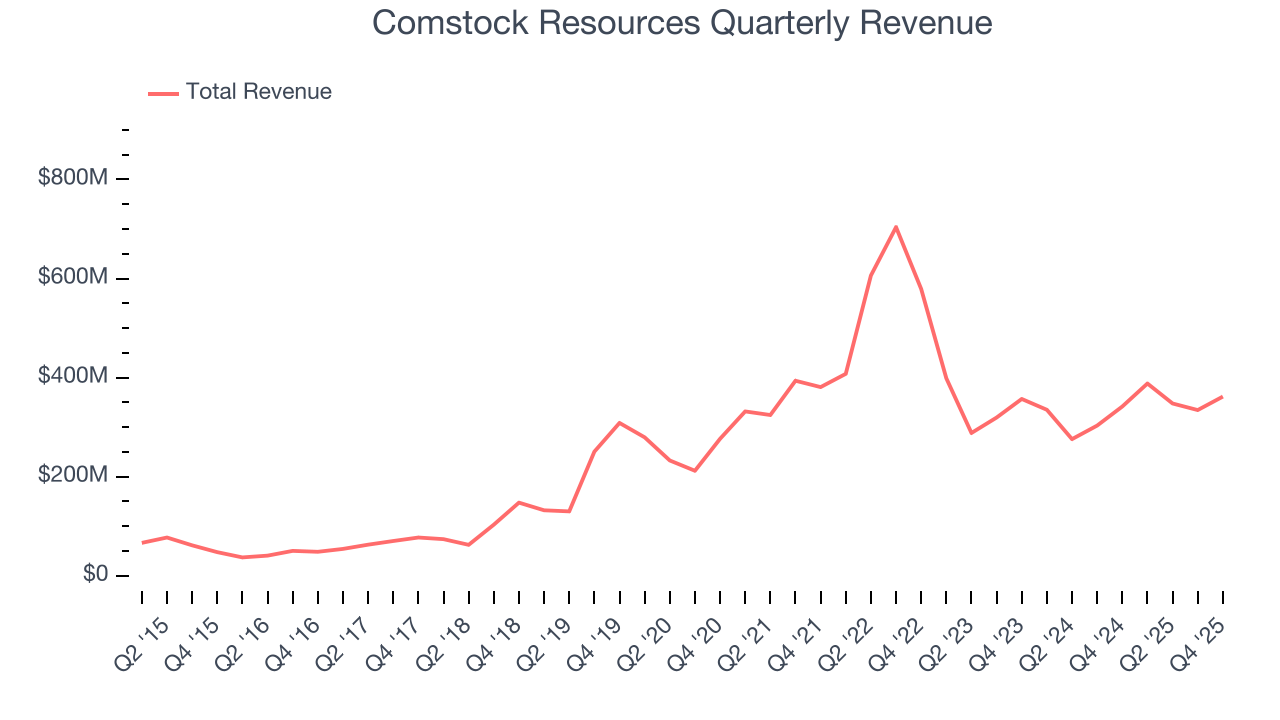
Energy cycles can be long enough that a single five-year period can still reflect one price environment, which is why an additional, decade-long view can help capture through-cycle performance. Comstock Resources’s annualized revenue growth of 18.9% over the last ten years is above its five-year trend.
This quarter, Comstock Resources’s revenue grew by 5.9% year on year to $361.8 million, missing Wall Street’s estimates.
7. Gross Margin
In any given year, energy gross margins are heavily influenced by prices, hedging, and cost inflation, but over a full cycle these gross margins reveal which producers are structurally advantaged through superior “rock” quality, infrastructure access, and cost position.
Comstock Resources, which averaged 58.7% gross margin over the last five years, exhibits good unit economics in the sector. It means the company will remain profitable at lower commodity prices than peers with inferior gross margins and serves as an encouraging starting point for ultimate operating profits and free cash flow generation. 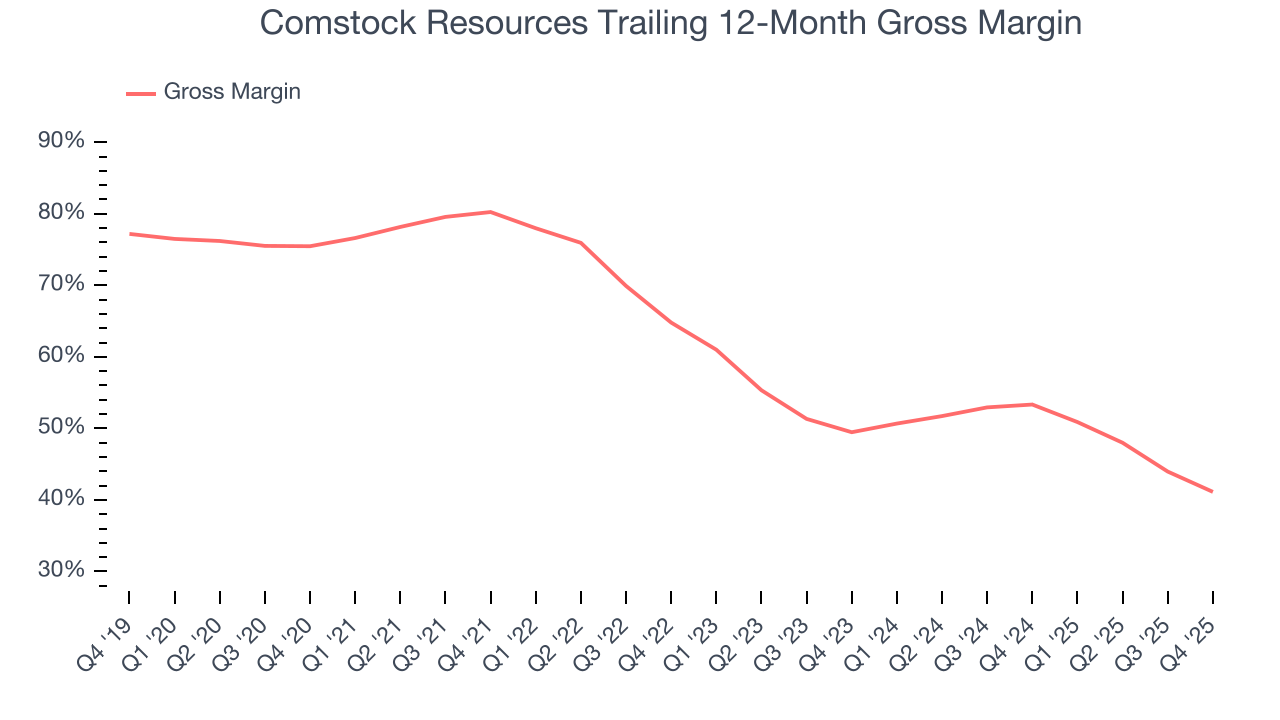
In Q4, Comstock Resources produced a 42.7% gross profit margin, down 11.8 percentage points year on year.
8. Adjusted EBITDA Margin
Comstock Resources has been a well-oiled machine over the last five years. It demonstrated elite profitability for an upstream and integrated energy business, boasting an average EBITDA margin of 74.9%.
Analyzing the trend in its profitability, Comstock Resources’s EBITDA margin decreased by 4.5 percentage points over the last year. This raises questions about the company’s expense base because its revenue growth should have given it leverage on its fixed costs, resulting in better economies of scale and profitability.
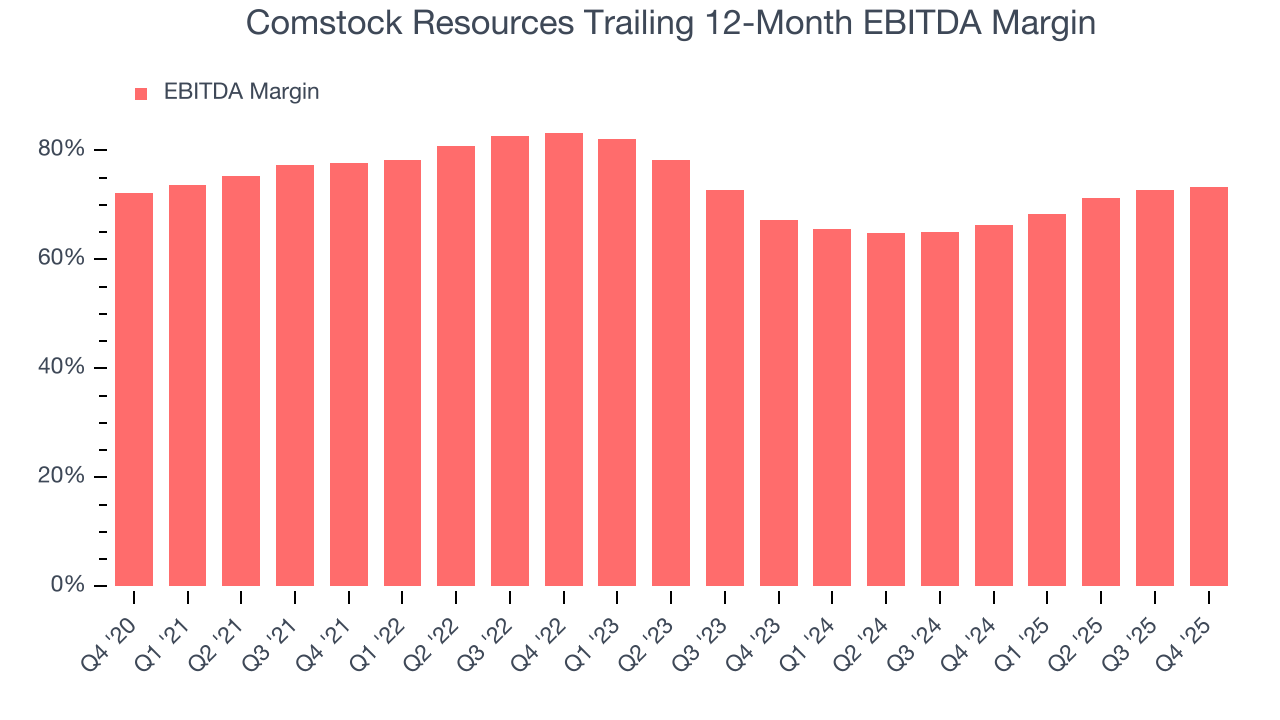
This quarter, Comstock Resources generated an EBITDA margin profit margin of 74.7%, up 2.1 percentage points year on year. This increase was a welcome development and shows it was more efficient. This adjusted EBITDA fell short of Wall Street’s estimates.
9. Cash Is King
Adjusted EBITDA shows how profitable a company’s existing wells are before financing and reinvestment decisions, but free cash flow shows how much value remains after paying the cost of replacing those wells. In upstream energy, production naturally declines over time, so companies must continuously reinvest just to stand still. A producer can report strong EBITDA margins yet generate little or no free cash flow if its wells decline quickly or if new drilling is expensive. Free cash flow therefore captures not only how efficiently a company produces hydrocarbons today, but also how costly it is to sustain that production into the future.
Comstock Resources’s demanding reinvestments have drained its resources over the last five years, putting it in a pinch and limiting its ability to return capital to investors. Its free cash flow margin averaged negative 6.9%, meaning it lit $6.87 of cash on fire for every $100 in revenue.
The level of free cash flow is important, but its durability across cycles is just as critical. Consistent margins are far more valuable than volatile swings driven by commodity prices.
Comstock Resources’s ratio of quarterly free cash flow volatility to Henry Hub gas-price volatility over the past five years was 11.5 (lower is better), indicating that its cash generation is far more sensitive to commodity-price swings than most peers. This elevated volatility limits its access to capital in downturns and makes it unlikely to act as a consolidator when weaker competitors come under pressure.
You may be asking why we wait until the free cash flow line to perform this stability analysis versus commodity prices. Why not compare revenue or EBITDA to Henry Hub Natural Gas prices in the case of Comstock Resources? Because what ultimately matters is not how much revenue or profit you earn when prices are high but how much cash you can generate when prices are low. Free cash flow is the superior metric because it includes everything from hedging prowess to growth and maintenance capex to management behavior during good times and bad.
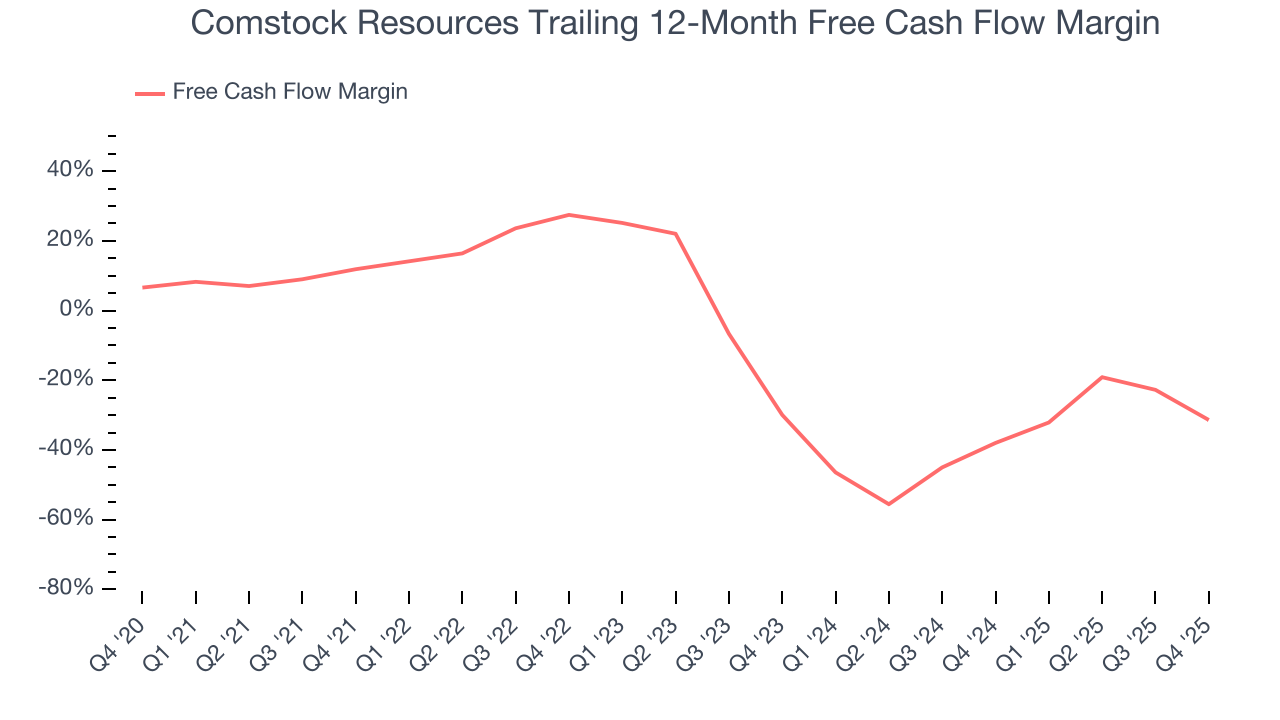
Comstock Resources burned through $141.2 million of cash in Q4, equivalent to a negative 39% margin. The company’s cash burn increased from $12.9 million of lost cash in the same quarter last year.
10. Return on Invested Capital (ROIC)
Free cash flow shows how much money a producer generated, while ROIC shows how efficiently that money was earned. ROIC measures the operating profit produced for each dollar of capital invested, whether from debt or equity. Cash generation measures quantity while ROIC measures the quality of value creation.
We at StockStory like to look at ROIC over a ten-year period because energy investment cycles can involve up to five years of ramping production and another five years of harvesting. A decade view captures buying, extracting, and monetizing rather than just part of that picture. Although Comstock Resources hasn’t been the highest-quality company lately, it historically found a few growth initiatives that worked. Its nine-year average ROIC was 13.4%, higher than most energy upstream and integrated energy businesses.
We like to invest in businesses with high returns, but the trend in a company’s ROIC is what often surprises the market and moves the stock price. Unfortunately, Comstock Resources’s ROIC has decreased significantly over the last few years. We like what management has done in the past, but its declining returns are perhaps a symptom of fewer profitable growth opportunities.
11. Balance Sheet Assessment
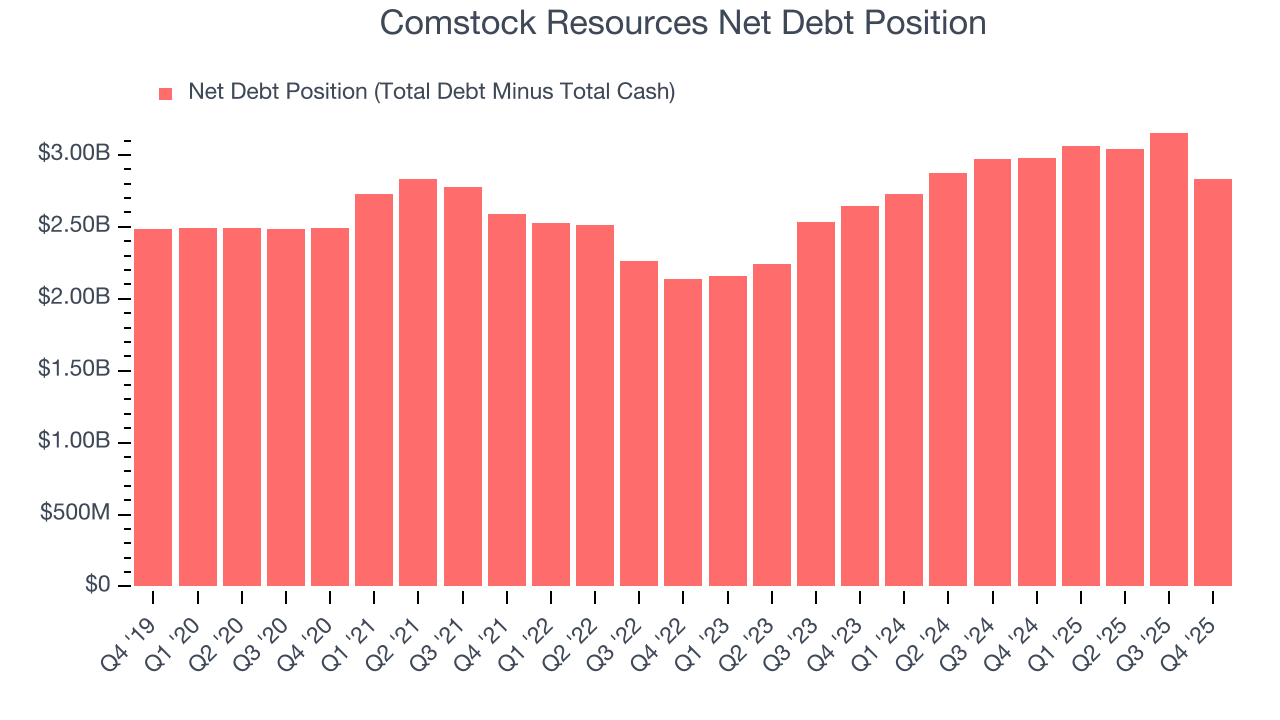
Comstock Resources reported $23.93 million of cash and $2.86 billion of debt on its balance sheet in the most recent quarter. As investors in high-quality companies, we primarily focus on two things: 1) that a company’s debt level isn’t too high and 2) that its interest payments are not excessively burdening the business.
With $1.05 billion of EBITDA over the last 12 months, we view Comstock Resources’s 2.7× net-debt-to-EBITDA ratio as safe. We also see its $222.8 million of annual interest expenses as appropriate. The company’s profits give it plenty of breathing room, allowing it to continue investing in growth initiatives.
12. Key Takeaways from Comstock Resources’s Q4 Results
It was good to see Comstock Resources beat analysts’ EPS expectations this quarter. On the other hand, its revenue missed and its EBITDA fell short of Wall Street’s estimates. Overall, this was a weaker quarter. The stock traded up 1.9% to $19.95 immediately after reporting.
13. Is Now The Time To Buy Comstock Resources?
Updated: March 17, 2026 at 12:57 AM EDT
The latest quarterly earnings matters, sure, but we actually think longer-term fundamentals and valuation matter more. Investors should consider all these pieces before deciding whether or not to invest in Comstock Resources.
Comstock Resources doesn’t pass our quality test. To begin with, its revenue growth was quite poor over the last five years. While its revenue growth over the last ten years was top-tier for the sector, the downside is its cash burn raises the question of whether it can sustainably maintain growth. On top of that, its declining EBITDA margin shows the business has become less efficient.
Comstock Resources’s P/E ratio based on the next 12 months is 22x. This valuation tells us a lot of optimism is priced in - we think there are better stocks to buy right now.
Wall Street analysts have a consensus one-year price target of $19.86 on the company (compared to the current share price of $20.56), implying they don’t see much short-term potential in Comstock Resources.