ConocoPhillips (COP)
We’re firm believers in ConocoPhillips. Its powerful free cash flow generation enables it to reinvest profits or return capital to shareholders.― StockStory Analyst Team
1. News
2. Summary
Why We Like ConocoPhillips
Operating the famous Prudhoe Bay field discovered in 1968 that transformed Alaska's economy, ConocoPhillips (NYSE:COP) explores for and produces crude oil, natural gas, and liquefied natural gas across North America, Europe, Asia, and Africa.
- Annual revenue growth of 26.2% over the last five years was superb and indicates its market share increased during this cycle
- Enormous revenue base of $61.55 billion provides significant leverage in supplier negotiations
- strong earning stability positions it as a consolidator during commodity price downturns


ConocoPhillips is a market leader. The price seems reasonable relative to its quality, so this might be a good time to buy some shares.
Why Is Now The Time To Buy ConocoPhillips?


At $121.10 per share, ConocoPhillips trades at 21.6x forward P/E. Scanning the energy upstream and integrated energy landscape, we think this multiple is reasonable - arguably even attractive - for the quality you get.
Entry price matters far less than business fundamentals if you’re investing for a multi-year period. But if you can get a bargain price it’s certainly icing on the cake.
3. ConocoPhillips (COP) Research Report: Q4 CY2025 Update
Oil and gas producer ConocoPhillips (NYSE:COP) reported Q4 CY2025 results beating Wall Street’s revenue expectations, but sales fell by 3.7% year on year to $14.19 billion. Its non-GAAP profit of $1.02 per share was 6.5% below analysts’ consensus estimates.
ConocoPhillips (COP) Q4 CY2025 Highlights:
- Revenue: $14.19 billion vs analyst estimates of $13.29 billion (3.7% year-on-year decline, 6.7% beat)
- Adjusted EPS: $1.02 vs analyst expectations of $1.09 (6.5% miss)
- Adjusted EBITDA: $5.44 billion vs analyst estimates of $5.47 billion (38.3% margin, 0.6% miss)
- Operating Margin: 15.7%, down from 26.2% in the same quarter last year
- Free Cash Flow Margin: 9.1%, up from 7.7% in the same quarter last year
- Market Capitalization: $143.1 billion
Company Overview
Operating the famous Prudhoe Bay field discovered in 1968 that transformed Alaska's economy, ConocoPhillips (NYSE:COP) explores for and produces crude oil, natural gas, and liquefied natural gas across North America, Europe, Asia, and Africa.
The company's operations span the full lifecycle of hydrocarbon production, from identifying underground reserves through seismic surveys and exploratory drilling, to extracting these resources using various technologies, and finally transporting and selling the commodities to refiners, utilities, and other buyers. For instance, at its Surmont project in Alberta, Canada, the company injects steam underground to heat and liquefy thick bitumen deposits, which are then pumped to the surface, processed, and blended for transport to refineries that convert it into gasoline and diesel fuel.
ConocoPhillips organizes its assets geographically across six regions. In Alaska, it operates large conventional fields like Prudhoe Bay and Kuparuk, where oil is extracted through waterflooding techniques that inject water to maintain reservoir pressure. The Lower 48 portfolio focuses on unconventional shale plays in the Permian Basin's Delaware and Midland areas, the Eagle Ford in South Texas, and the Bakken in North Dakota, where horizontal drilling and hydraulic fracturing unlock oil and gas from tight rock formations. In Norway, the company produces from offshore platforms in the North Sea and Norwegian Sea, with production facilities that separate oil, gas, and water before exporting via pipelines. The company also holds interests in three liquefied natural gas facilities—in Qatar, Australia, and Equatorial Guinea—where natural gas is cooled to negative 260 degrees Fahrenheit for shipment in specialized tankers to Asia and Europe.
Revenue comes from selling these hydrocarbons at market prices that fluctuate based on global supply and demand. The company sells crude oil and natural gas liquids to refineries, natural gas to power generators and industrial users, and LNG under long-term contracts to utilities in countries like Japan and China. Its Commercial division manages the logistics of moving production through pipelines, marine tankers, and storage facilities to reach customers worldwide.
4. Diversified Upstream E&P
Large cap diversified exploration and production (E&P) companies operate global portfolios spanning multiple basins and resource types, providing geographic and commodity diversification. Scale enables operational efficiencies, capital market access, and investment in advanced technologies. Tailwinds include disciplined capital allocation improving shareholder returns, diversified production bases reducing single-asset risk, and strong balance sheets supporting dividend programs. Headwinds include commodity price volatility affecting earnings, regulatory and geopolitical risks across operating regions, and ESG pressures challenging long-term investment theses. The energy transition creates strategic uncertainty around reserve life and future demand trajectories.
ConocoPhillips competes with other independent exploration and production companies like ExxonMobil (NYSE:XOM), Chevron (NYSE:CVX), Occidental Petroleum (NYSE:OXY), and EOG Resources (NYSE:EOG).
5. Economies of Scale
The size of the revenue base is a way to assess topline, and it tells an investor whether an Energy producer has crossed the line between being a more vulnerable commodity taker and a durable operating platform. Scaled businesses tend to produce and generate revenue from many wells, pads, takeaway routes, and geographies, not just a single field or drilling program. ConocoPhillips’s $61.55 billion of revenue in the last year is top-tier for the industry, suggesting the company has hit a level of diversification where investors can sleep easy at night.
6. Revenue Growth
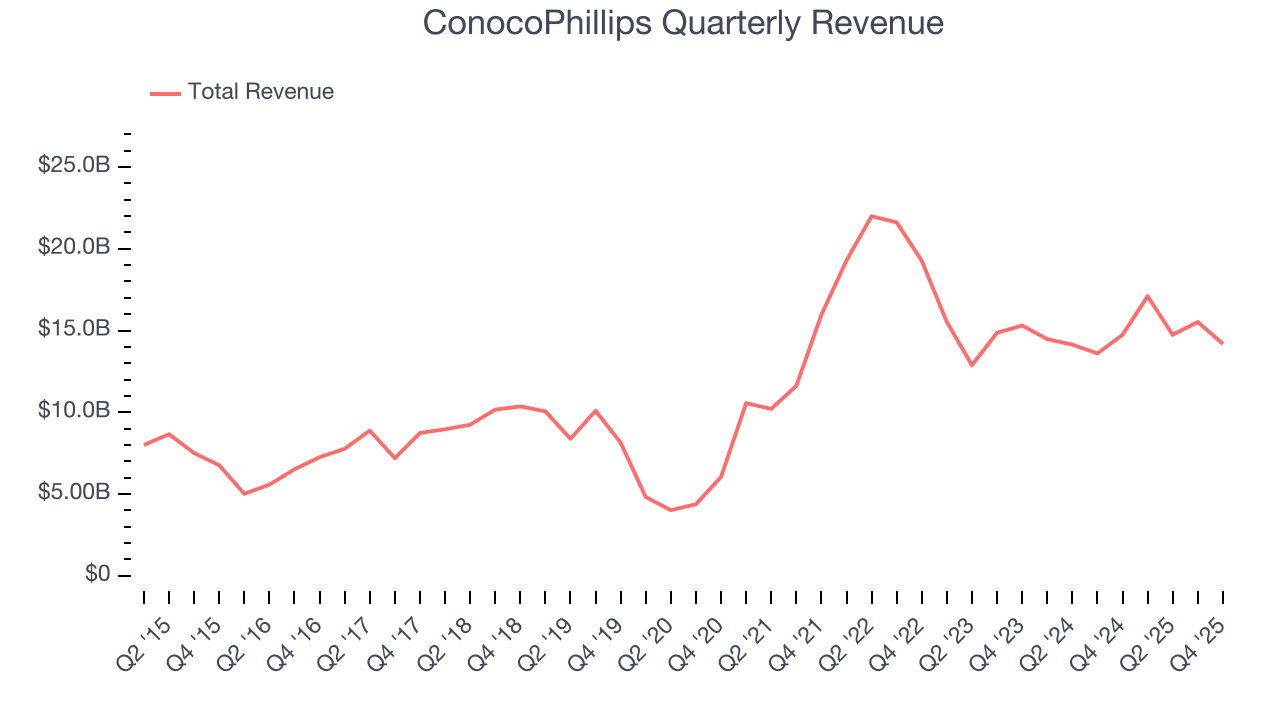
Cyclical sectors like Energy often flatter weaker operators during favorable price environments, but a longer-term lens separates those from businesses that can consistently perform across market cycles. Over the last five years, ConocoPhillips grew its sales at an incredible 26.2% compounded annual growth rate. Its growth surpassed the average energy upstream and integrated energy company and shows its offerings resonate with customers, a great starting point for our analysis.
Energy cycles can be long enough that a single five-year period can still reflect one price environment, which is why an additional, decade-long view can help capture through-cycle performance. ConocoPhillips’s annualized revenue growth of 7.1% over the last ten years is below its five-year trend, but we still think the results suggest decent demand.
While looking at revenue is important, it can also introduce noise around commodity prices and M&A. Analyzing drivers of revenue, on the other hand, highlights what is happening inside the asset base and whether the economic footprint of a company is expanding. Over the last two years, ConocoPhillips’s total oil volume per day - Upstream averaged 21% year-on-year growth while natural gas volume per day - Upstream averaged 16.2% year-on-year growth, which was good. 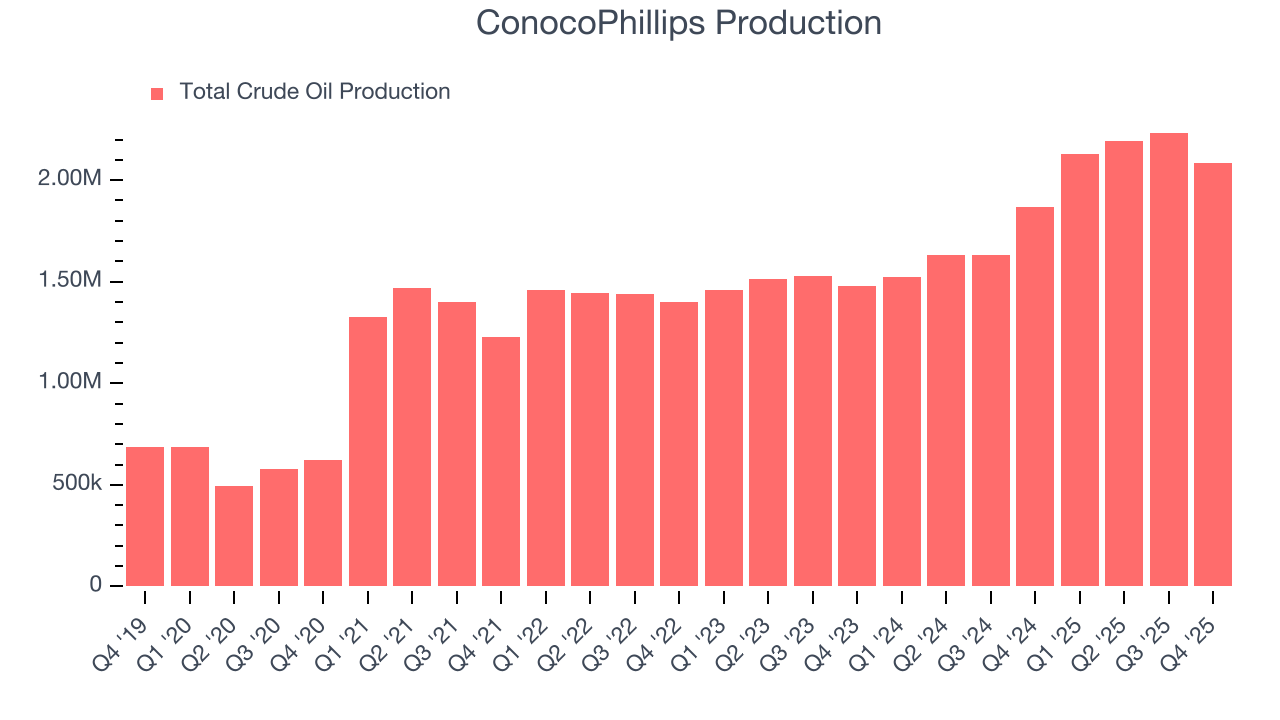
This quarter, ConocoPhillips’s revenue fell by 3.7% year on year to $14.19 billion but beat Wall Street’s estimates by 6.7%. This quarter, ConocoPhillips’s production grew by 11.6% year on year to 2,084 Mboe (thousand barrels of oil equivalent) but fell short of Wall Street’s estimates.
7. Gross Margin
While energy gross margins can be distorted by commodity prices, hedging, and short-term cost swings, sustained margins across a full cycle reflect a producer’s underlying asset quality, infrastructure position, and cost structure.
ConocoPhillips, which averaged 49.4% gross margin over the last five years, exhibits mediocre unit economics in the sector. Energy companies with higher gross margins are more likely to remain profitable when commodity prices decline. 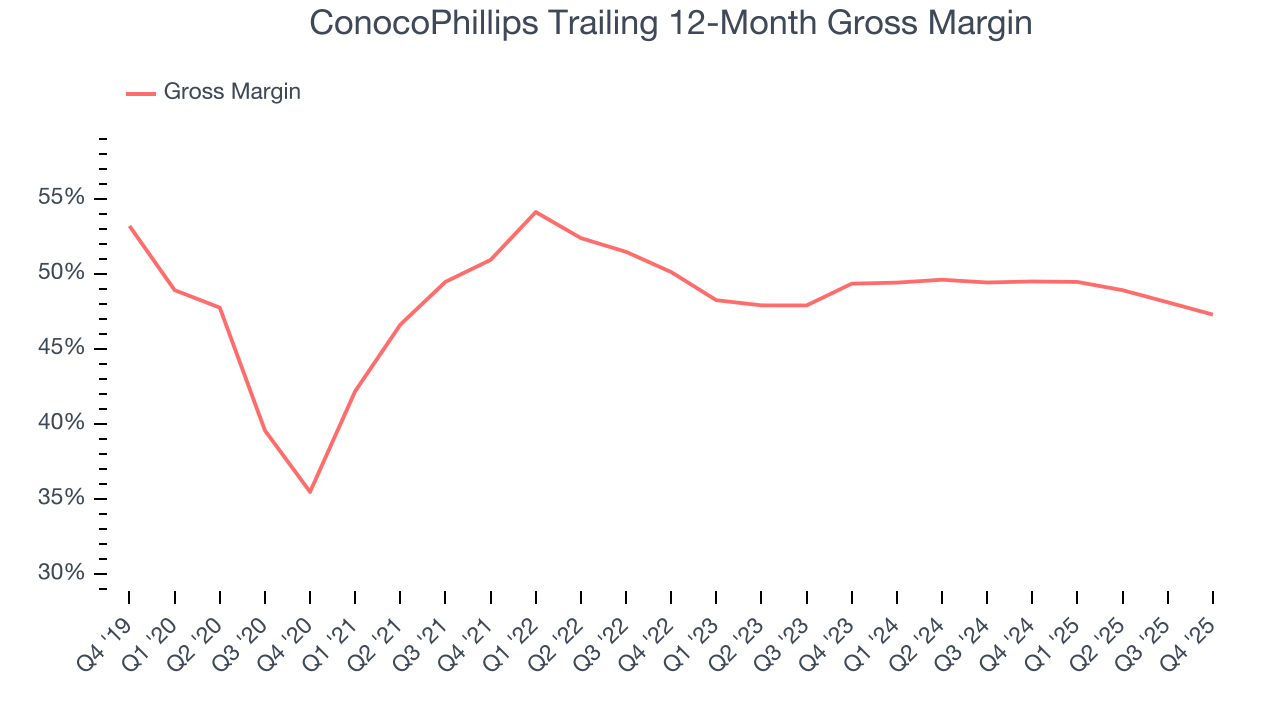
ConocoPhillips’s gross profit margin came in at 46.4% this quarter, down 3.5 percentage points year on year.
8. Adjusted EBITDA Margin
ConocoPhillips has managed its cost base well over the last five years. It demonstrated solid profitability for an upstream and integrated energy business, producing an average EBITDA margin of 42.8%.
Analyzing the trend in its profitability, ConocoPhillips’s EBITDA margin decreased by 2.4 percentage points over the last year. This raises questions about the company’s expense base because its revenue growth should have given it leverage on its fixed costs, resulting in better economies of scale and profitability.
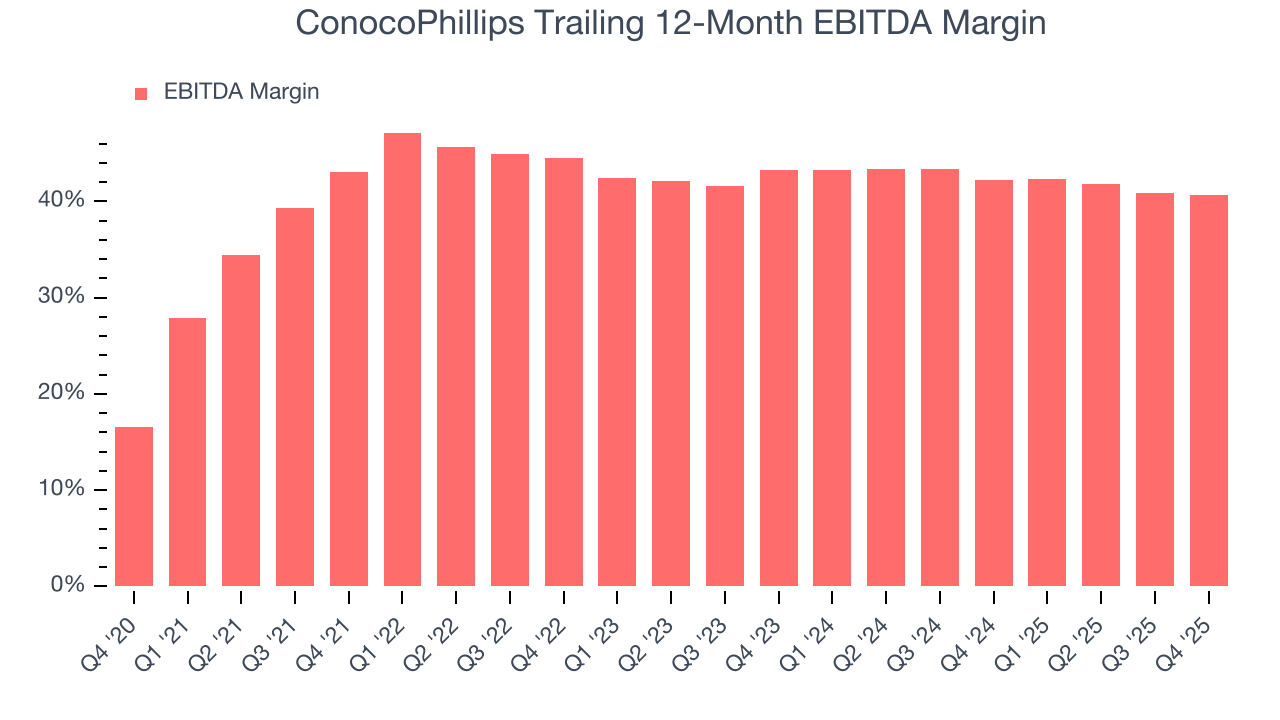
In Q4, ConocoPhillips generated an EBITDA margin profit margin of 38.3%, down 1.2 percentage points year on year. This reduction is quite minuscule and indicates the company’s overall cost structure has been relatively stable. This adjusted EBITDA fell short of Wall Street’s estimates.
9. Cash Is King
Adjusted EBITDA shows how profitable a company’s existing wells are before financing and reinvestment decisions, but free cash flow shows how much value remains after paying the cost of replacing those wells. In upstream energy, production naturally declines over time, so companies must continuously reinvest just to stand still. A producer can report strong EBITDA margins yet generate little or no free cash flow if its wells decline quickly or if new drilling is expensive. Free cash flow therefore captures not only how efficiently a company produces hydrocarbons today, but also how costly it is to sustain that production into the future.
ConocoPhillips has shown robust cash profitability, giving it an edge over its competitors and the ability to reinvest or return capital to investors. The company’s free cash flow margin averaged 17.5% over the last five years, quite impressive for an upstream and integrated energy business.
While the level of free cash flow margins is important, their consistency matters just as much.
ConocoPhillips’s ratio of quarterly free cash flow volatility to WTI Crude price volatility over the past five years was 3.7 (lower is better), indicating unusually strong insulation from commodity swings. This stability supports superior capital access in downturns and positions ConocoPhillips to act as a consolidator when weaker peers are forced to retrench.
You may be asking why we wait until the free cash flow line to perform this stability analysis versus commodity prices. Why not compare revenue or EBITDA to WTI in the case of ConocoPhillips? Because what ultimately matters is not how much revenue or profit you earn when prices are high but how much cash you can generate when prices are low. Free cash flow is the superior metric because it includes everything from hedging prowess to growth and maintenance capex to management behavior during good times and bad.
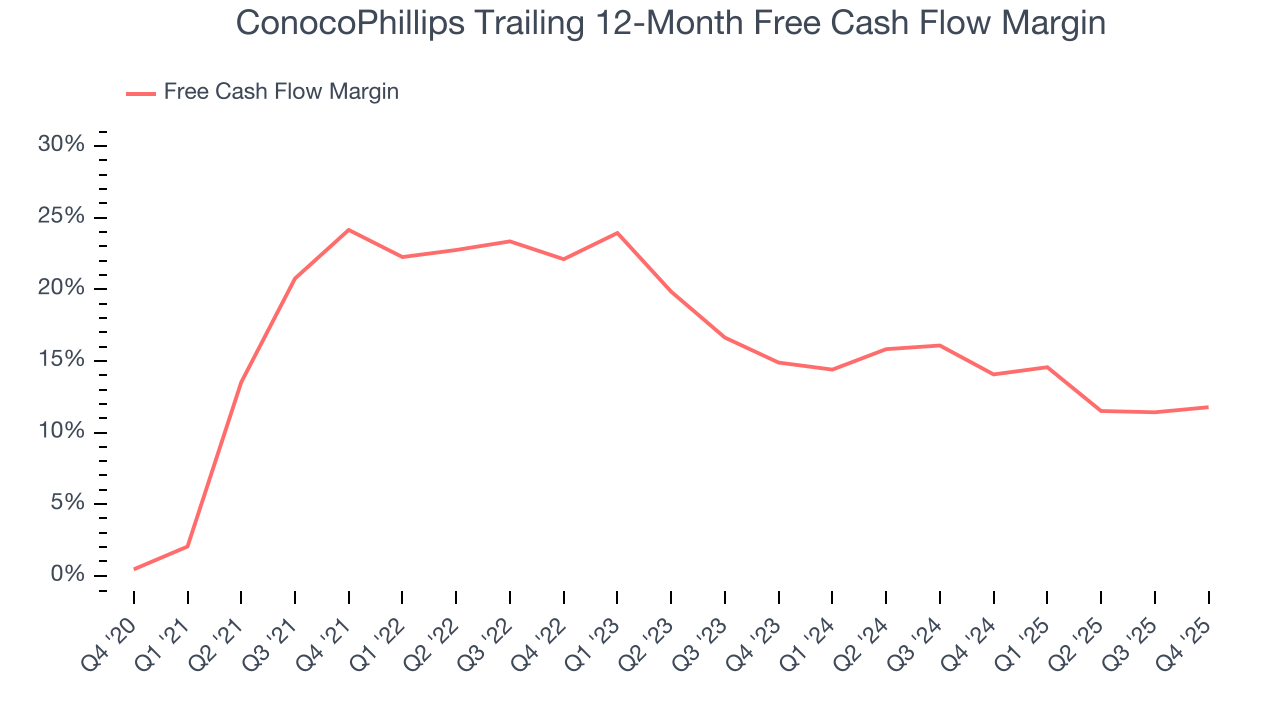
ConocoPhillips’s free cash flow clocked in at $1.3 billion in Q4, equivalent to a 9.1% margin. This result was good as its margin was 1.4 percentage points higher than in the same quarter last year, but we note it was lower than its five-year cash profitability. Nevertheless, we wouldn’t read too much into a single quarter because investment needs can be seasonal, causing short-term swings. Long-term trends trump temporary fluctuations.
10. Return on Invested Capital (ROIC)
Free cash flow tells investors how much money an Energy producer made, and ROIC takes this one step further by telling investors how well and effectively the business made it. ROIC illustrates how much operating profit a producer generated relative to the money it has raised (debt and equity).
We at StockStory like to look at ROIC over a ten-year period because energy investment cycles can involve up to five years of ramping production and another five years of harvesting. A decade view captures buying, extracting, and monetizing rather than just part of that picture. ConocoPhillips’s ten-year average ROIC was 10.8%, higher than most energy upstream and integrated energy businesses. This illustrates its management team’s ability to invest in profitable growth opportunities and generate value for shareholders.
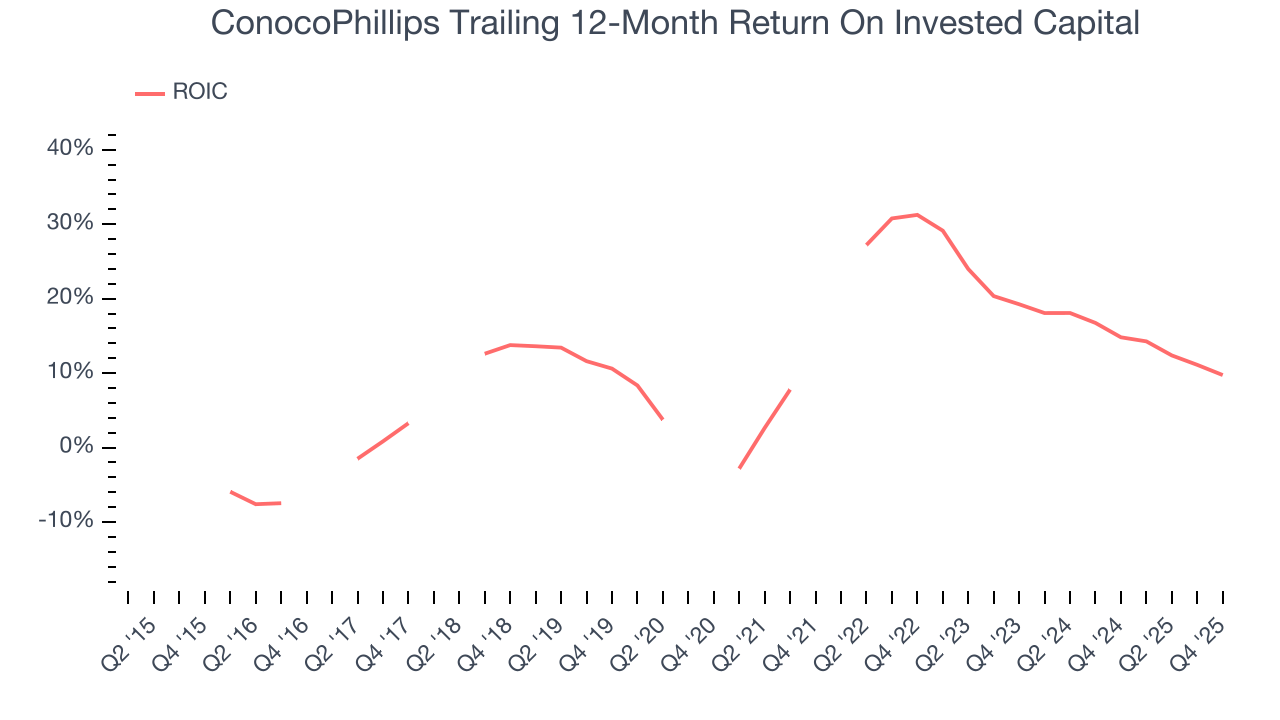 Note: Quarters not shown were determined to be outliers, impacted by outsized investment gains/losses that are not indicative of the recurring fundamentals of the business.
We like to invest in businesses with high returns, but the trend in a company’s ROIC is what often surprises the market and moves the stock price. Unfortunately, ConocoPhillips’s ROIC has decreased significantly over the last few years. Only time will tell if its new bets can bear fruit and potentially reverse the trend.
11. Balance Sheet Assessment
ConocoPhillips reported $6.98 billion of cash and $23.44 billion of debt on its balance sheet in the most recent quarter. As investors in high-quality companies, we primarily focus on two things: 1) that a company’s debt level isn’t too high and 2) that its interest payments are not excessively burdening the business.
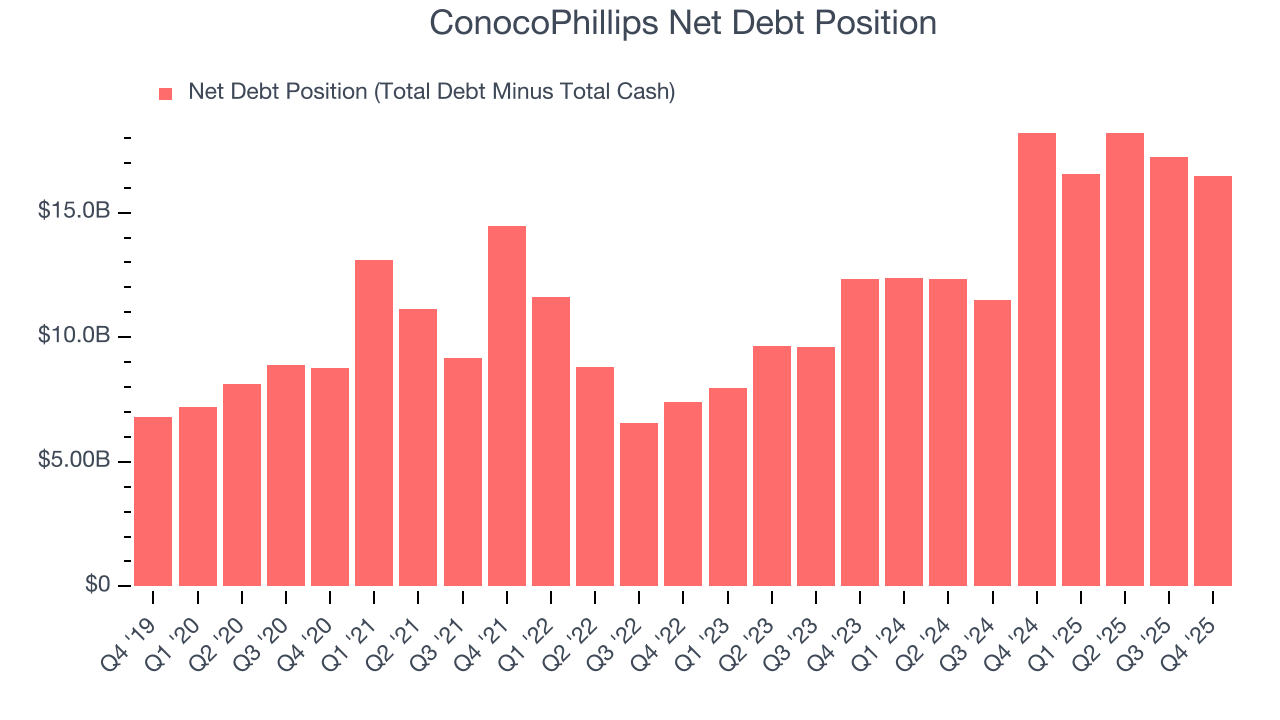
With $25.01 billion of EBITDA over the last 12 months, we view ConocoPhillips’s 0.7× net-debt-to-EBITDA ratio as safe. We also see its $544 million of annual interest expenses as appropriate. The company’s profits give it plenty of breathing room, allowing it to continue investing in growth initiatives.
12. Key Takeaways from ConocoPhillips’s Q4 Results
We were impressed by how significantly ConocoPhillips blew past analysts’ revenue expectations this quarter. On the other hand, its production missed and its EPS fell short of Wall Street’s estimates. Overall, this quarter could have been better. The stock remained flat at $117.38 immediately after reporting.
13. Is Now The Time To Buy ConocoPhillips?
Updated: March 17, 2026 at 1:09 AM EDT
Are you wondering whether to buy ConocoPhillips or pass? We urge investors to not only consider the latest earnings results but also longer-term business quality and valuation as well.
There are several reasons why we think ConocoPhillips is a great business. First of all, the company’s revenue growth over the last five years was top-tier for the sector. On top of that, its top-tier scale enables operational efficiencies, capital market access, and investment in advanced technologies, and its free cash flowvolatility compared to commodity price volatility is very low, demonstrating top-tier free cash flow stability.
ConocoPhillips’s P/E ratio based on the next 12 months is 21.6x. Scanning the energy upstream and integrated energy space today, ConocoPhillips’s fundamentals really stand out, and we like it at this price.
Wall Street analysts have a consensus one-year price target of $121.15 on the company (compared to the current share price of $121.10).