
Coterra Energy (CTRA)
Coterra Energy is an amazing business. Its rare ability to win market share while pumping out profits is a feature many competitors envy.― StockStory Analyst Team
1. News
2. Summary
Why We Like Coterra Energy
Operating some of the country's largest natural gas wells in Pennsylvania's Marcellus Shale, Coterra Energy (NYSE:CTRA) drills for and produces oil, natural gas, and natural gas liquids from underground shale formations.
- Annual revenue growth of 18.5% over the past ten years was outstanding, reflecting market share gains this cycle
- Enormous revenue base of $7.4 billion provides significant leverage in supplier negotiations
- Attractive asset base leads to wonderful unit economics and a best-in-class gross margin of 79.1%


We’re optimistic about Coterra Energy. The price seems fair in light of its quality, and we think now is a good time to buy the stock.
Why Is Now The Time To Buy Coterra Energy?


Coterra Energy’s stock price of $34.80 implies a valuation ratio of 13.4x forward P/E. Valuation is lower than most companies in the energy upstream and integrated energy space, and we believe Coterra Energy is attractively-priced for its quality.
Our work shows, time and again, that buying high-quality companies and holding them routinely leads to market outperformance. If you can get an attractive entry price, that’s icing on the cake.
3. Coterra Energy (CTRA) Research Report: Q4 CY2025 Update
Oil and gas producer Coterra Energy (NYSE:CTRA) fell short of the market’s revenue expectations in Q4 CY2025, but sales rose 27% year on year to $1.85 billion. Its non-GAAP profit of $0.39 per share was 16.9% below analysts’ consensus estimates.
Coterra Energy (CTRA) Q4 CY2025 Highlights:
- Revenue: $1.85 billion vs analyst estimates of $1.86 billion (27% year-on-year growth, 0.8% miss)
- Adjusted EPS: $0.39 vs analyst expectations of $0.47 (16.9% miss)
- Adjusted EBITDA: $1.13 billion vs analyst estimates of $1.17 billion (60.9% margin, 3.5% miss)
- Operating Margin: 30.9%, up from 22.4% in the same quarter last year
- Free Cash Flow Margin: 21.1%, up from 13.8% in the same quarter last year
- Oil production per day: up 55.6% year on year
- Market Capitalization: $25.66 billion
Company Overview
Operating some of the country's largest natural gas wells in Pennsylvania's Marcellus Shale, Coterra Energy (NYSE:CTRA) drills for and produces oil, natural gas, and natural gas liquids from underground shale formations.
The company focuses its drilling operations in three major U.S. regions. In the Delaware Basin portion of the Permian Basin spanning west Texas and southeast New Mexico, Coterra extracts oil and gas from the Wolfcamp Shale and Bone Spring formations. In northeast Pennsylvania's Susquehanna County, it produces natural gas from the dry gas window of the Marcellus Shale—a geological sweet spot where wells yield mostly natural gas rather than oil. In Oklahoma's Anadarko Basin, the company targets both the Woodford Shale and Meramec formations. These areas represent what energy companies call "multi-well, repeatable development programs," meaning once a company proves oil and gas exist in one location, it can systematically drill additional wells nearby with predictable results.
Coterra sells its production to a diverse customer base including industrial manufacturers, local distribution companies that supply homes and businesses, energy marketers who trade commodities, major integrated energy companies, pipeline operators, and power plants that burn natural gas to generate electricity. The company operates under both long-term contracts and short-term agreements, with prices typically tied to market benchmarks like Henry Hub for natural gas or West Texas Intermediate for crude oil.
Beyond extraction, Coterra operates gathering systems and saltwater disposal infrastructure, primarily in Texas. These gathering pipelines connect newly drilled wells to larger interstate pipelines and processing facilities. The saltwater disposal systems handle produced water—a byproduct of oil and gas extraction—either recycling it for use in hydraulic fracturing operations at new wells or disposing of it in underground injection wells.
4. Diversified Upstream E&P
Large cap diversified exploration and production (E&P) companies operate global portfolios spanning multiple basins and resource types, providing geographic and commodity diversification. Scale enables operational efficiencies, capital market access, and investment in advanced technologies. Tailwinds include disciplined capital allocation improving shareholder returns, diversified production bases reducing single-asset risk, and strong balance sheets supporting dividend programs. Headwinds include commodity price volatility affecting earnings, regulatory and geopolitical risks across operating regions, and ESG pressures challenging long-term investment theses. The energy transition creates strategic uncertainty around reserve life and future demand trajectories.
Coterra Energy competes with other U.S.-focused oil and gas producers including EQT Corporation (NYSE:EQT), Devon Energy (NYSE:DVN), Diamondback Energy (NASDAQ:FANG), and Occidental Petroleum (NYSE:OXY).
5. Economies of Scale
The size of the revenue base is a way to assess topline, and it tells an investor whether an Energy producer has crossed the line between being a more vulnerable commodity taker and a durable operating platform. Scaled businesses tend to produce and generate revenue from many wells, pads, takeaway routes, and geographies, not just a single field or drilling program. Coterra Energy’s $7.4 billion of revenue in the last year is top-tier for the industry, suggesting the type of diversification that reduces operational risk.
6. Revenue Growth
A company’s long-term performance can give signals about its business quality. Even a bad business, especially in a cyclical industry, can shine for a year or so, but a top-tier one should exhibit resilience through cycles. Luckily, Coterra Energy’s sales grew at an incredible 38.7% compounded annual growth rate over the last five years. Its growth surpassed the average energy upstream and integrated energy company and shows its offerings resonate with customers, a great starting point for our analysis.
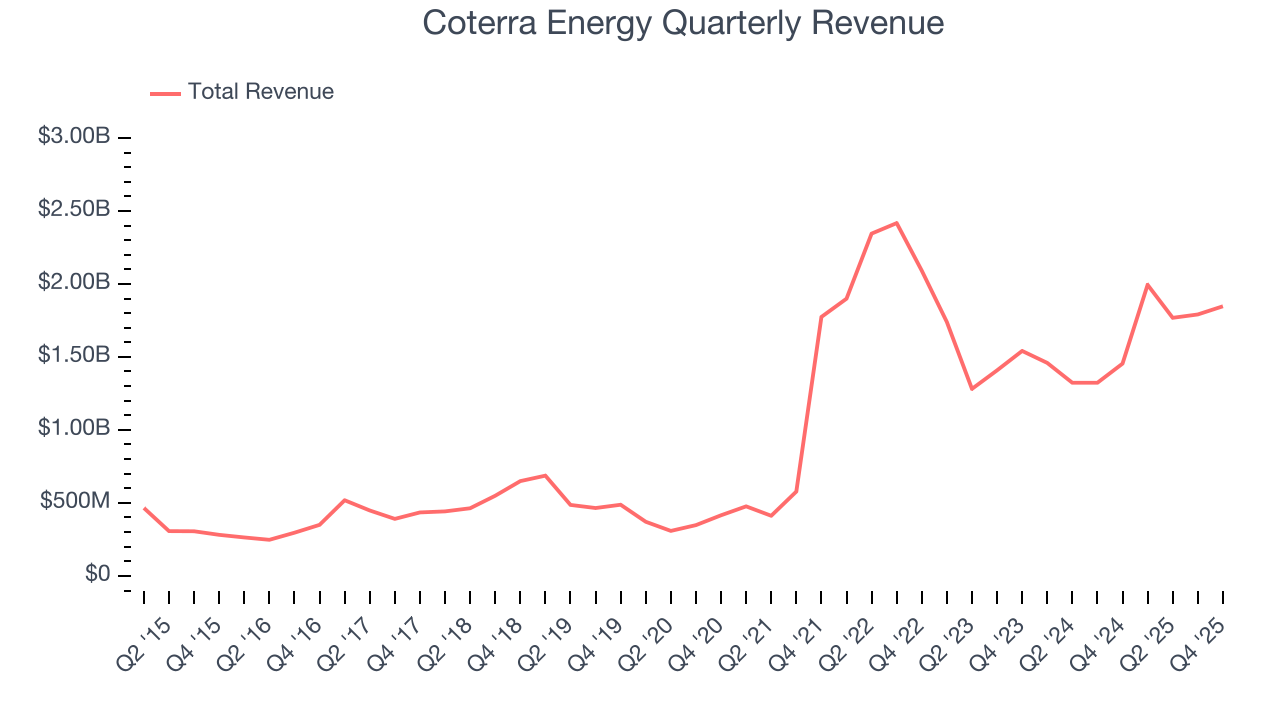
Energy cycles can be long enough that a single five-year period can still reflect one price environment, which is why an additional, decade-long view can help capture through-cycle performance. Coterra Energy’s annualized revenue growth of 18.5% over the last ten years is below its five-year trend, but we still think the results suggest decent demand.
This quarter, Coterra Energy generated an excellent 27% year-on-year revenue growth rate, but its $1.85 billion of revenue fell short of Wall Street’s high expectations. This quarter, Coterra Energy reported magnificent year-on-year Oil production per day growth of 55.6%.
7. Gross Margin
While energy gross margins can be distorted by commodity prices, hedging, and short-term cost swings, sustained margins across a full cycle reflect a producer’s underlying asset quality, infrastructure position, and cost structure.
Coterra Energy, which averaged 79.1% gross margin over the last five years, exhibits enviable unit economics in the sector. It means the company will remain profitable at lower commodity prices than peers with inferior gross margins and serves as an advantaged starting point for ultimate operating profits and free cash flow generation. 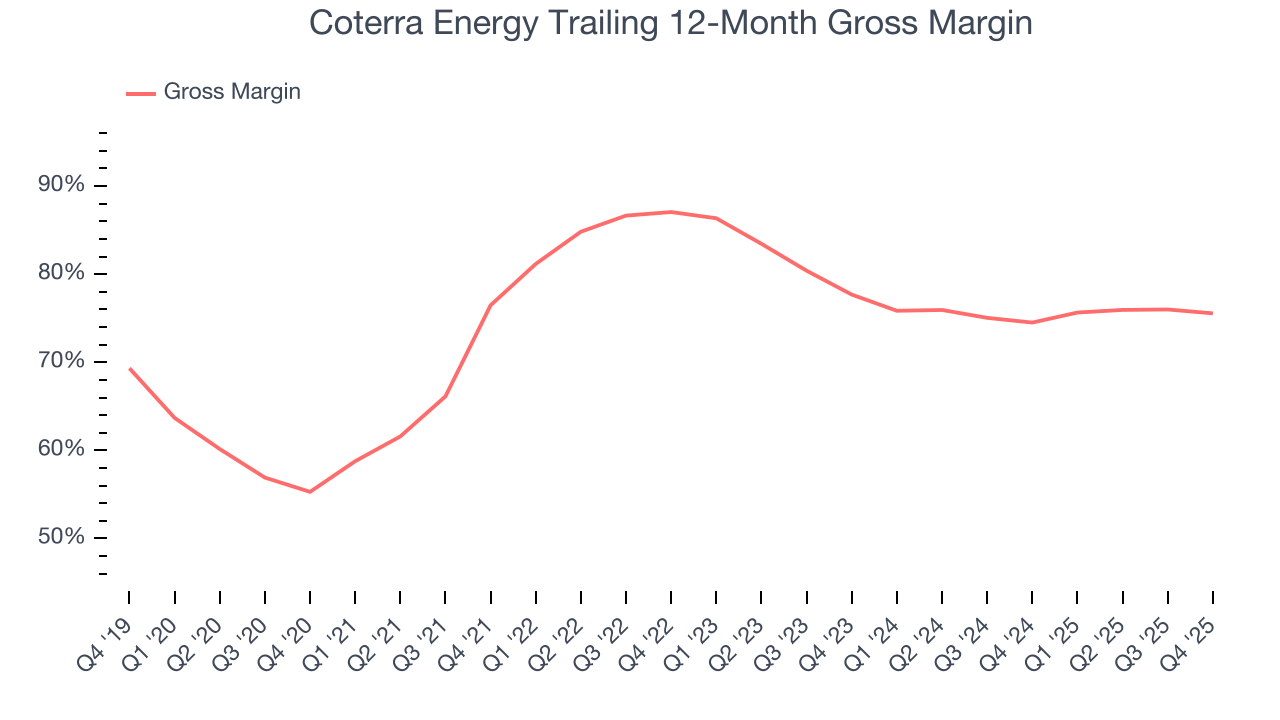
Coterra Energy’s gross profit margin came in at 73.7% this quarter, down 1.6 percentage points year on year.
8. Adjusted EBITDA Margin
Adjusted EBITDA margin captures the true operating profitability of an energy producer by removing accounting noise around depletion and capitalized drilling costs. It reveals how much cash the asset base generates before capital structure and reinvestment requirements shape reported earnings.
Coterra Energy has been a well-oiled machine over the last five years. It demonstrated elite profitability for an upstream and integrated energy business, boasting an average EBITDA margin of 67.1%.
Analyzing the trend in its profitability, Coterra Energy’s EBITDA margin decreased by 6.5 percentage points over the last year. This raises questions about the company’s expense base because its revenue growth should have given it leverage on its fixed costs, resulting in better economies of scale and profitability.
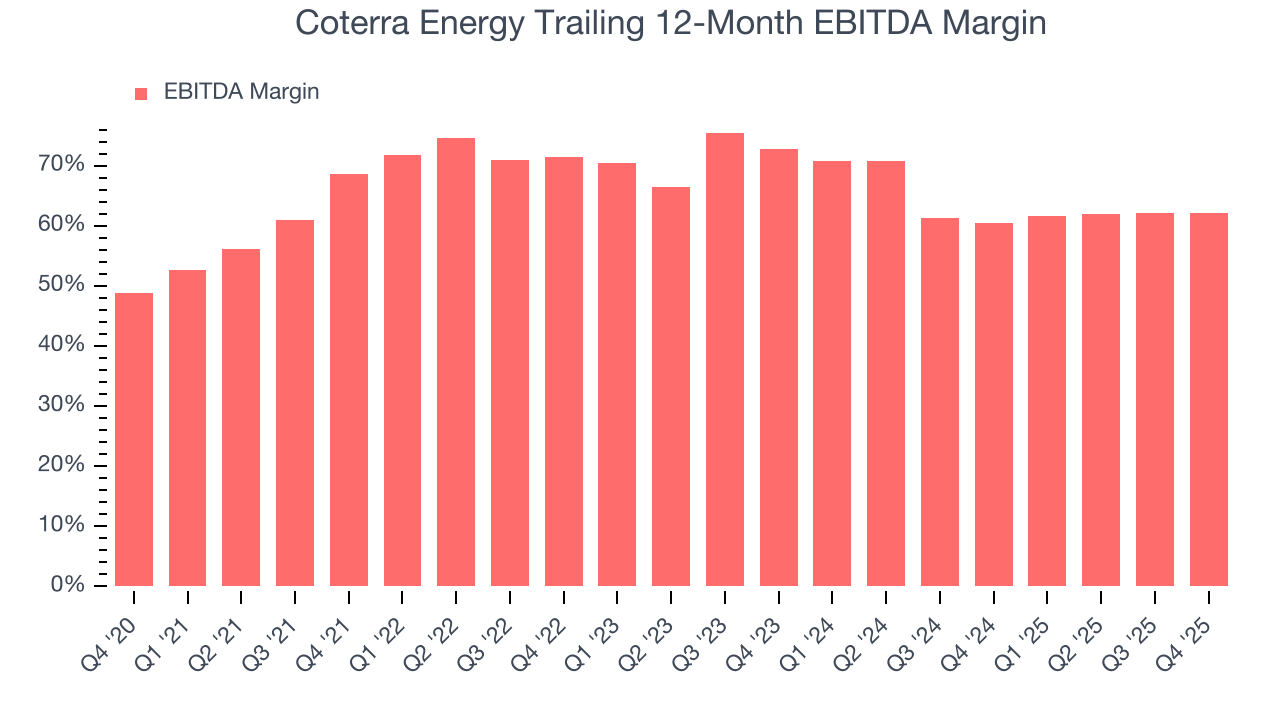
In Q4, Coterra Energy generated an EBITDA margin profit margin of 60.9%, in line with the same quarter last year. This indicates the company’s overall cost structure has been relatively stable. This adjusted EBITDA fell short of Wall Street’s estimates.
9. Cash Is King
As mentioned above, adjusted EBITDA ignores capital structure and drilling expenditure decisions. These are two huge aspects of an Energy producer, so in order to understand a comprehensive picture of business quality, an investor needs to account for these. Said differently, adjusted EBITDA margins could be solid but free cash flow is abysmal because decline rates of the asset are extreme and the drilling is expensive. Free cash flow tells you about not only the economics of the production that has happened but how much it costs to stay in business as well (further drilling or extraction).
Coterra Energy has shown terrific cash profitability, driven by its lucrative business model that enables it to reinvest, return capital to investors, and stay ahead of the competition. The company’s free cash flow margin was among the best in the energy upstream and integrated energy sector, averaging 29.2% over the last five years.
Absolute FCF margin levels matter but so does stability of free cash flow. All else equal, we’d prefer a 25.0% average free cash flow margin that is quite steady no matter how commodity prices behave rather than extremely high margins when times are good and negative ones when they’re tough.
Coterra Energy’s ratio of quarterly free cash flow volatility to WTI crude price volatility over the past five years was 5.2 (lower is better), indicating excellent insulation from commodity swings. This stability supports capital access in downturns and positions Coterra Energy to act as a consolidator when weaker peers are forced to retrench.
You may be asking why we wait until the free cash flow line to perform this stability analysis versus commodity prices. Why not compare revenue or EBITDA to WTI Crude prices in the case of Coterra Energy? Because what ultimately matters is not how much revenue or profit you earn when prices are high but how much cash you can generate when prices are low. Free cash flow is the superior metric because it includes everything from hedging prowess to growth and maintenance capex to management behavior during good times and bad.
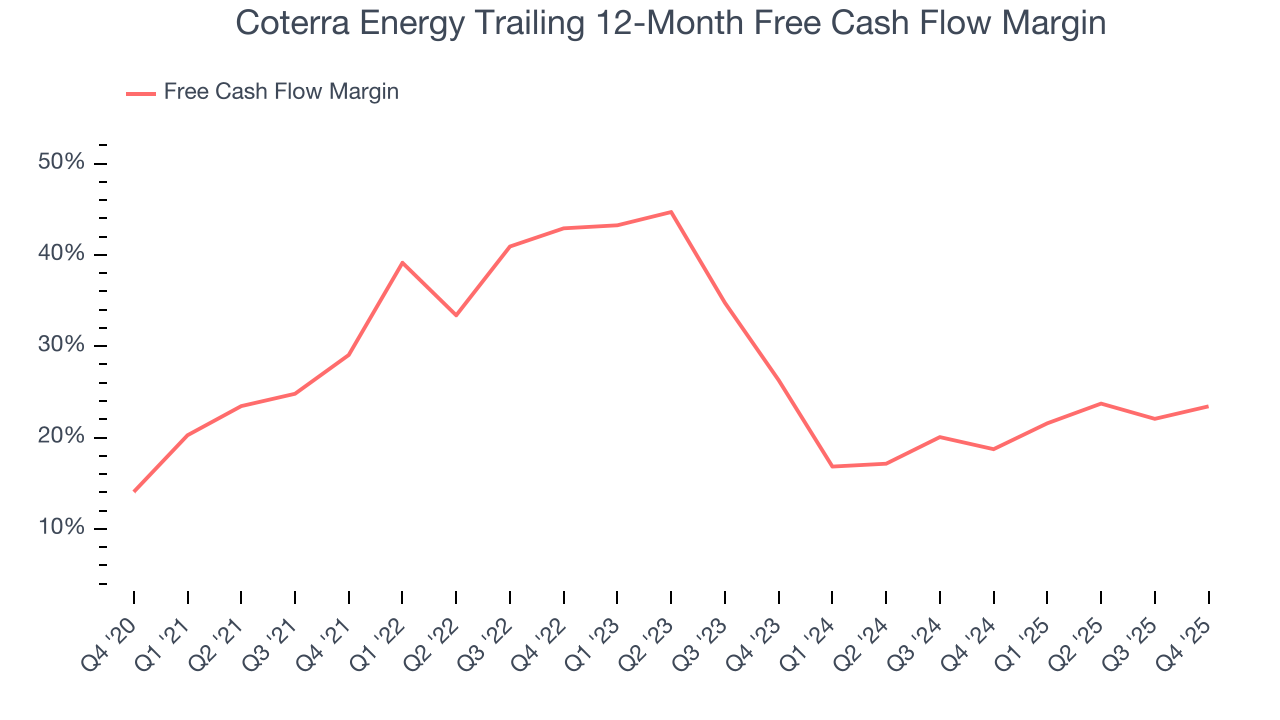
Coterra Energy’s free cash flow clocked in at $389 million in Q4, equivalent to a 21.1% margin. This result was good as its margin was 7.2 percentage points higher than in the same quarter last year, but we note it was lower than its five-year cash profitability. Nevertheless, we wouldn’t put too much weight on a single quarter because investment needs can be seasonal, causing short-term swings. Long-term trends carry greater meaning.
10. Return on Invested Capital (ROIC)
Free cash flow tells investors how much money an Energy producer made, and ROIC takes this one step further by telling investors how well and effectively the business made it. ROIC illustrates how much operating profit a producer generated relative to the money it has raised (debt and equity).
We at StockStory like to look at ROIC over a ten-year period because energy investment cycles can involve up to five years of ramping production and another five years of harvesting. A decade view captures buying, extracting, and monetizing rather than just part of that picture. Coterra Energy’s ten-year average ROIC was 11.3%, higher than most energy upstream and integrated energy businesses. This illustrates its management team’s ability to invest in profitable growth opportunities and generate value for shareholders.
We like to invest in businesses with high returns, but the trend in a company’s ROIC is what often surprises the market and moves the stock price. Over the last few years, Coterra Energy’s ROIC has unfortunately decreased significantly. Only time will tell if its new bets can bear fruit and potentially reverse the trend.
11. Balance Sheet Assessment
Coterra Energy reported $119 million of cash and $3.82 billion of debt on its balance sheet in the most recent quarter. As investors in high-quality companies, we primarily focus on two things: 1) that a company’s debt level isn’t too high and 2) that its interest payments are not excessively burdening the business.
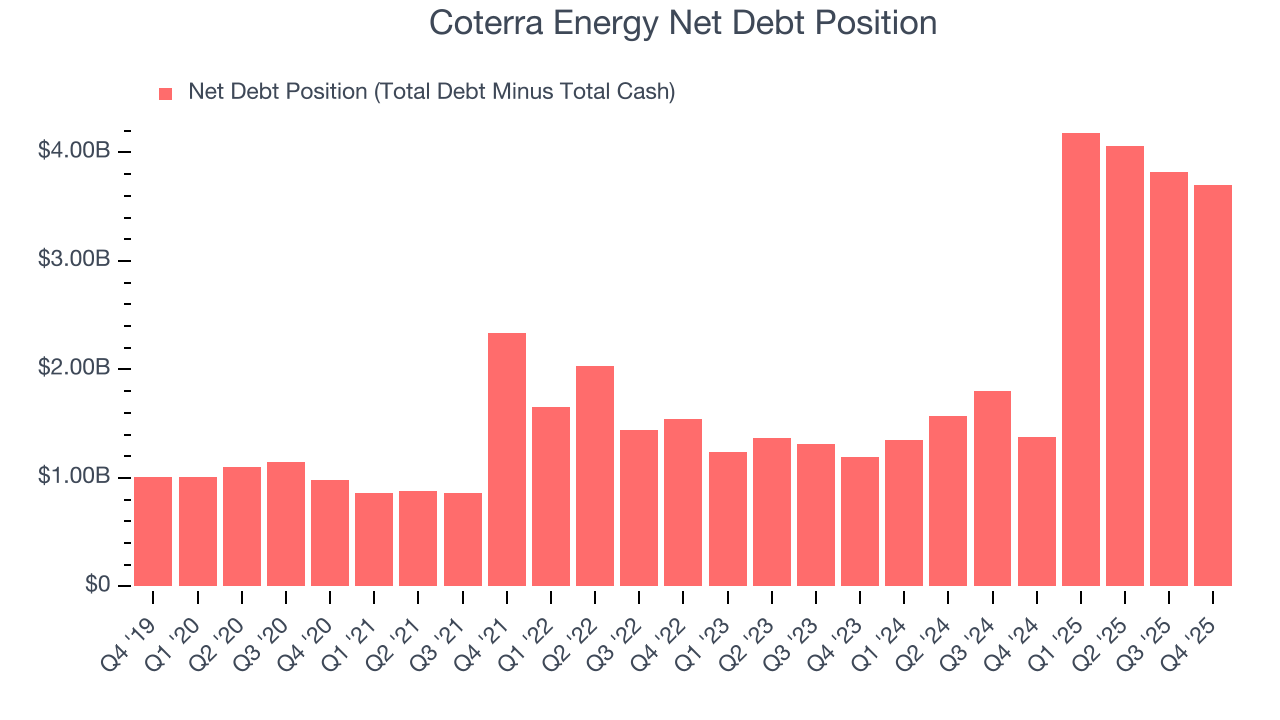
With $4.59 billion of EBITDA over the last 12 months, we view Coterra Energy’s 0.8× net-debt-to-EBITDA ratio as safe. We also see its $212 million of annual interest expenses as appropriate. The company’s profits give it plenty of breathing room, allowing it to continue investing in growth initiatives.
12. Key Takeaways from Coterra Energy’s Q4 Results
We struggled to find many positives in these results. Its EPS missed and its EBITDA fell short of Wall Street’s estimates. Overall, this was a softer quarter. The stock traded up 3.7% to $35.07 immediately following the results.
13. Is Now The Time To Buy Coterra Energy?
Updated: March 25, 2026 at 12:50 AM EDT
A common mistake we notice when investors are deciding whether to buy a stock or not is that they simply look at the latest earnings results. Business quality and valuation matter more, so we urge you to understand these dynamics as well.
Coterra Energy is an amazing business ranking highly on our list. First of all, the company’s revenue growth over the last five years was top-tier for the sector. And while its declining EBITDA margin shows the business has become less efficient, its revenue growth over the last ten years was top-tier for the sector. On top of that, Coterra Energy’s top-tier scale enables operational efficiencies, capital market access, and investment in advanced technologies.
Coterra Energy’s P/E ratio based on the next 12 months is 13.4x. Looking at the energy upstream and integrated energy space today, Coterra Energy’s qualities as one of the best businesses really stand out, and we like it at this price.
Wall Street analysts have a consensus one-year price target of $35.17 on the company (compared to the current share price of $34.80).