ExxonMobil (XOM)
ExxonMobil doesn’t excite us. It not only barely generates profits but also has been less efficient lately, as seen by its falling margins.― StockStory Analyst Team
1. News
2. Summary
Why ExxonMobil Is Not Exciting
One of the successor companies to John D. Rockefeller's Standard Oil monopoly that was broken up in 1911, ExxonMobil (NYSE:XOM) explores for and produces crude oil and natural gas, refines and sells petroleum products, and manufactures petrochemicals.
- EBITDA margin falls short of the industry average, and the smaller profit dollars make it harder to react to unexpected market developments
- Gross margin of 44.3% is below its competitors, leaving less money to invest in exploration and production
- A silver lining is that its massive revenue base of $332.2 billion makes it a household name that influences purchasing decisions


ExxonMobil doesn’t satisfy our quality benchmarks. There are more rewarding stocks elsewhere.
Why There Are Better Opportunities Than ExxonMobil


ExxonMobil’s stock price of $158.95 implies a valuation ratio of 21.1x forward P/E. The current valuation may be fair, but we’re still passing on this stock due to better alternatives out there.
We’d rather invest in similarly-priced but higher-quality companies with more reliable earnings growth.
3. ExxonMobil (XOM) Research Report: Q4 CY2025 Update
Integrated energy company ExxonMobil (NYSE:XOM) fell short of the market’s revenue expectations in Q4 CY2025, with sales falling 1.3% year on year to $82.31 billion. Its non-GAAP profit of $1.71 per share was 1.1% above analysts’ consensus estimates.
ExxonMobil (XOM) Q4 CY2025 Highlights:
- Revenue: $82.31 billion vs analyst estimates of $83.29 billion (1.3% year-on-year decline, 1.2% miss)
- Adjusted EPS: $1.71 vs analyst estimates of $1.69 (1.1% beat)
- Adjusted EBITDA: $15.91 billion vs analyst estimates of $17.22 billion (19.3% margin, 7.6% miss)
- Operating Margin: 10%, down from 12.1% in the same quarter last year
- Free Cash Flow Margin: 6.4%, similar to the same quarter last year
- Market Capitalization: $630.1 billion
Company Overview
One of the successor companies to John D. Rockefeller's Standard Oil monopoly that was broken up in 1911, ExxonMobil (NYSE:XOM) explores for and produces crude oil and natural gas, refines and sells petroleum products, and manufactures petrochemicals.
The company operates across the entire oil and gas value chain, from extracting resources deep underground to delivering finished products to end users. Its upstream operations span major oil and gas producing regions including the Permian Basin in Texas and New Mexico, offshore Guyana, the Canadian oil sands, Qatar's North Field, and Kazakhstan's Tengiz field. These operations involve drilling wells, operating production platforms, and in some cases extracting bitumen from oil sands through mining and upgrading it into synthetic crude oil.
Downstream, ExxonMobil refines crude oil into products like gasoline, diesel, jet fuel, and lubricants. A driver filling up at an Exxon, Esso, or Mobil branded gas station is purchasing refined products that may have originated from the company's own wells or from crude oil purchased on global markets. The company also manufactures petrochemicals—the building blocks for plastics, packaging materials, synthetic rubber, and other industrial products used by manufacturers.
The company generates revenue by selling crude oil and natural gas to refiners and utilities, petroleum products to consumers and businesses through its retail network and wholesale channels, and petrochemicals to industrial customers. It also participates in liquefied natural gas projects, where natural gas is cooled to liquid form for efficient overseas transport, supplying energy to markets in Asia and Europe.
ExxonMobil operates globally with significant activities across North America, South America, Europe, Africa, the Middle East, and Asia-Pacific. Beyond traditional operations, the company invests in lower-emission technologies including carbon capture and storage, hydrogen production, and advanced materials.
4. Diversified Upstream E&P
Large cap diversified exploration and production (E&P) companies operate global portfolios spanning multiple basins and resource types, providing geographic and commodity diversification. Scale enables operational efficiencies, capital market access, and investment in advanced technologies. Tailwinds include disciplined capital allocation improving shareholder returns, diversified production bases reducing single-asset risk, and strong balance sheets supporting dividend programs. Headwinds include commodity price volatility affecting earnings, regulatory and geopolitical risks across operating regions, and ESG pressures challenging long-term investment theses. The energy transition creates strategic uncertainty around reserve life and future demand trajectories.
ExxonMobil's major competitors in the integrated energy sector include Chevron (NYSE:CVX), Shell (NYSE:SHEL), BP (NYSE:BP), TotalEnergies (NYSE:TTE), and ConocoPhillips (NYSE:COP).
5. Economies of Scale
In Energy, scale separates fragile single-asset producers from platform-style businesses that generate revenue across entire basins and infrastructure networks. ExxonMobil’s $332.2 billion of revenue in the last year is top-tier for the industry, suggesting the company has hit a level of diversification where investors can sleep easy at night.
6. Revenue Growth
A company’s long-term performance can give signals about its business quality. Even a bad business, especially in a cyclical industry, can shine for a year or so, but a top-tier one should exhibit resilience through cycles. Luckily, ExxonMobil’s sales grew at a decent 12.9% compounded annual growth rate over the last five years. Its growth was slightly above the average energy upstream and integrated energy company and shows its offerings resonate with customers.
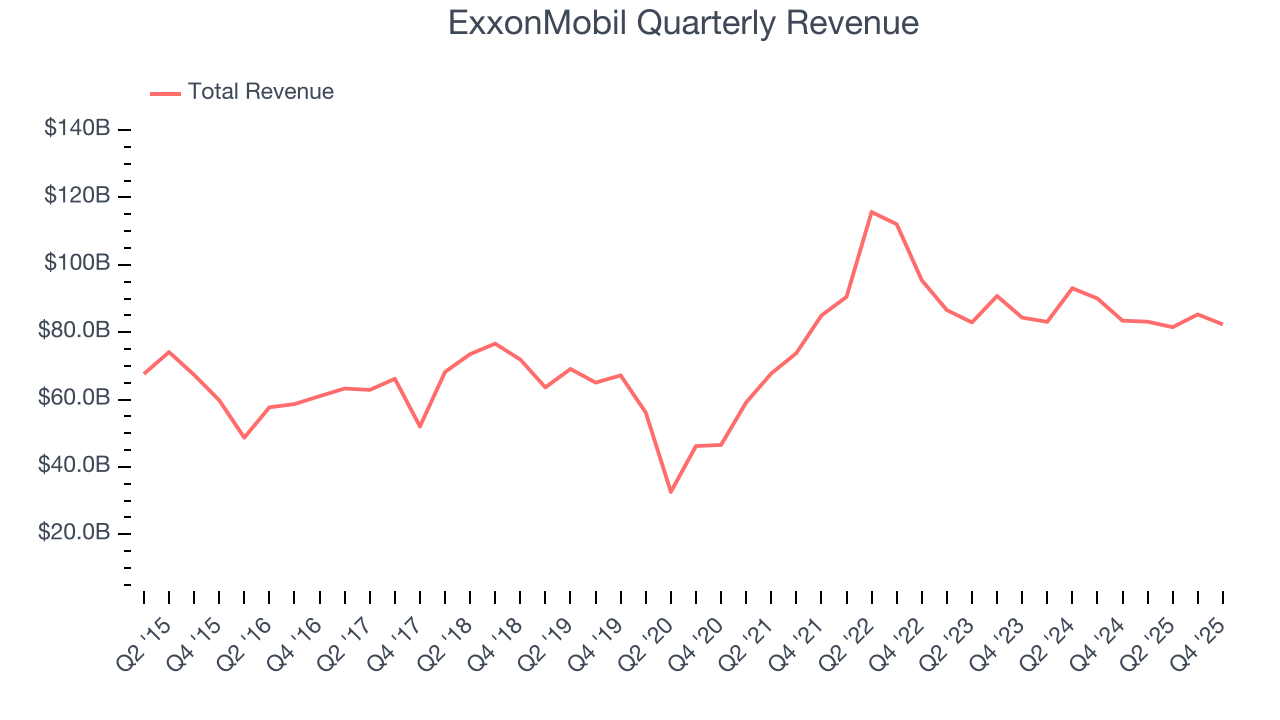
Within Energy, a singular timeframe, even if it’s quite long-term, only sheds light on how well a company rode the last commodity cycle. To better assess whether a company compounds through cycles, we validate our view with an even longer, ten-year view. ExxonMobil’s annualized revenue growth of 2.1% over the last ten years is below its five-year trend, but we still think the results were respectable.
Revenue provides useful context, but it is heavily influenced by commodity prices and acquisitions. Production volumes, by contrast, reveal whether the underlying asset base is actually growing. Over the last two years, ExxonMobil’s total oil volume per day - Upstream averaged 35.3% year-on-year growth while natural gas volume per day - Upstream averaged 2% year-on-year growth, which was good. 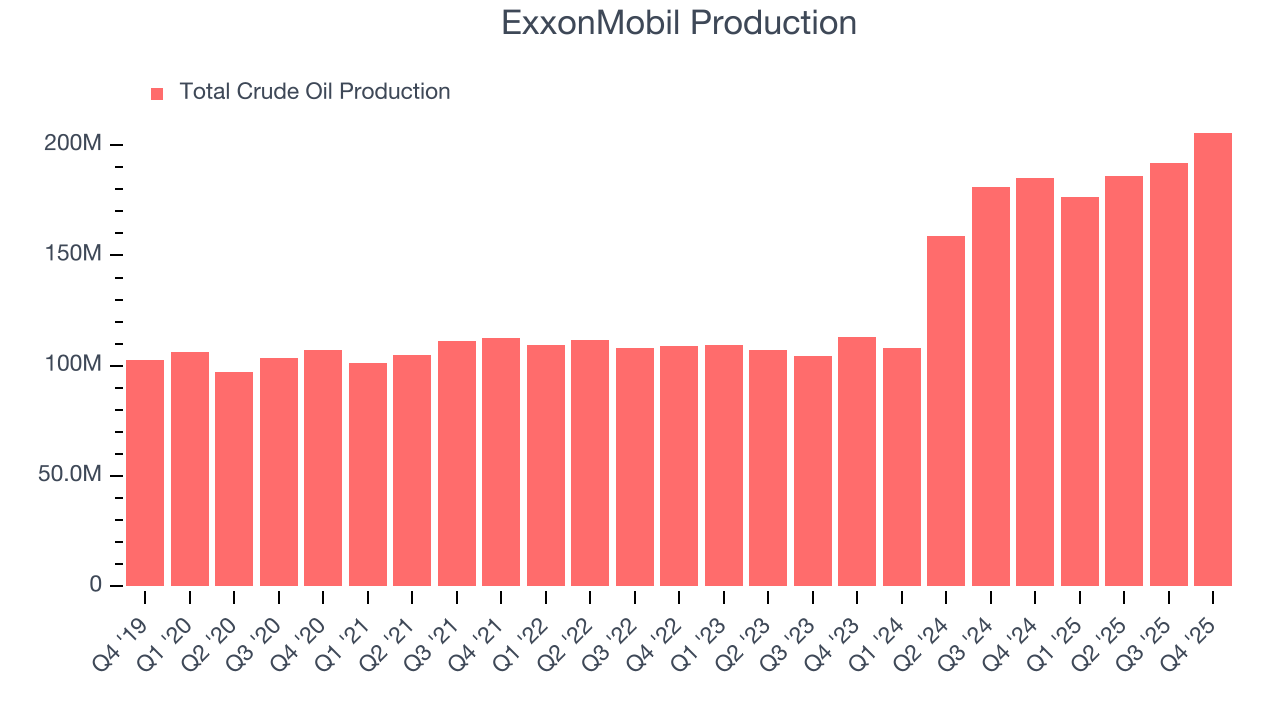
This quarter, ExxonMobil missed Wall Street’s estimates and reported a rather uninspiring 1.3% year-on-year revenue decline, generating $82.31 billion of revenue. This quarter, ExxonMobil reported year-on-year production growth of 11.2%, and its 205,666 Mboe (thousand barrels of oil equivalent) of production exceeded Wall Street’s estimates by 4.5%.
7. Gross Margin
While energy gross margins can be distorted by commodity prices, hedging, and short-term cost swings, sustained margins across a full cycle reflect a producer’s underlying asset quality, infrastructure position, and cost structure.
ExxonMobil, which averaged 44.3% gross margin over the last five years, exhibits subpar unit economics in the sector. It means the company will struggle more at lower commodity prices than peers with better gross margins. 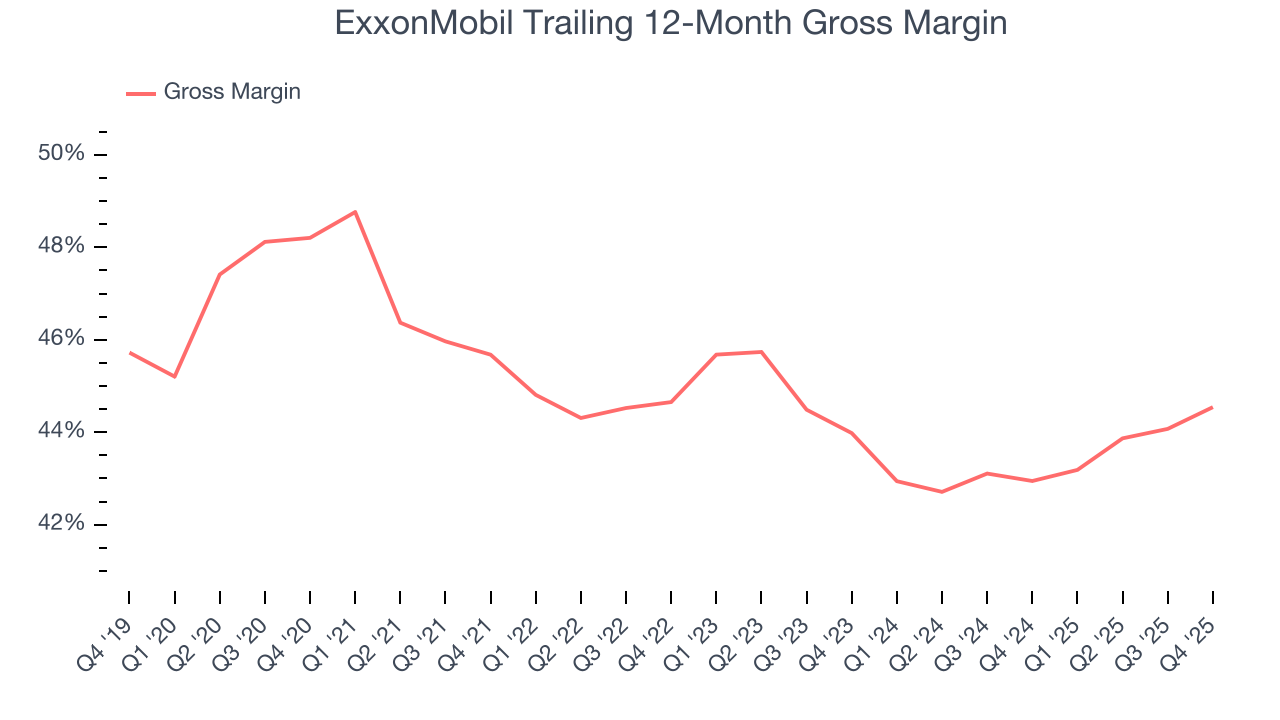
ExxonMobil produced a 46.3% gross profit margin in Q4, up 1.9 percentage points year on year.
8. Adjusted EBITDA Margin
ExxonMobil was profitable over the last five years but held back by its large cost base. Its average EBITDA margin of 21.5% was weak for an upstream and integrated energy business.
On the plus side, ExxonMobil’s EBITDA margin rose by 1.9 percentage points over the last year, as its sales growth gave it operating leverage.
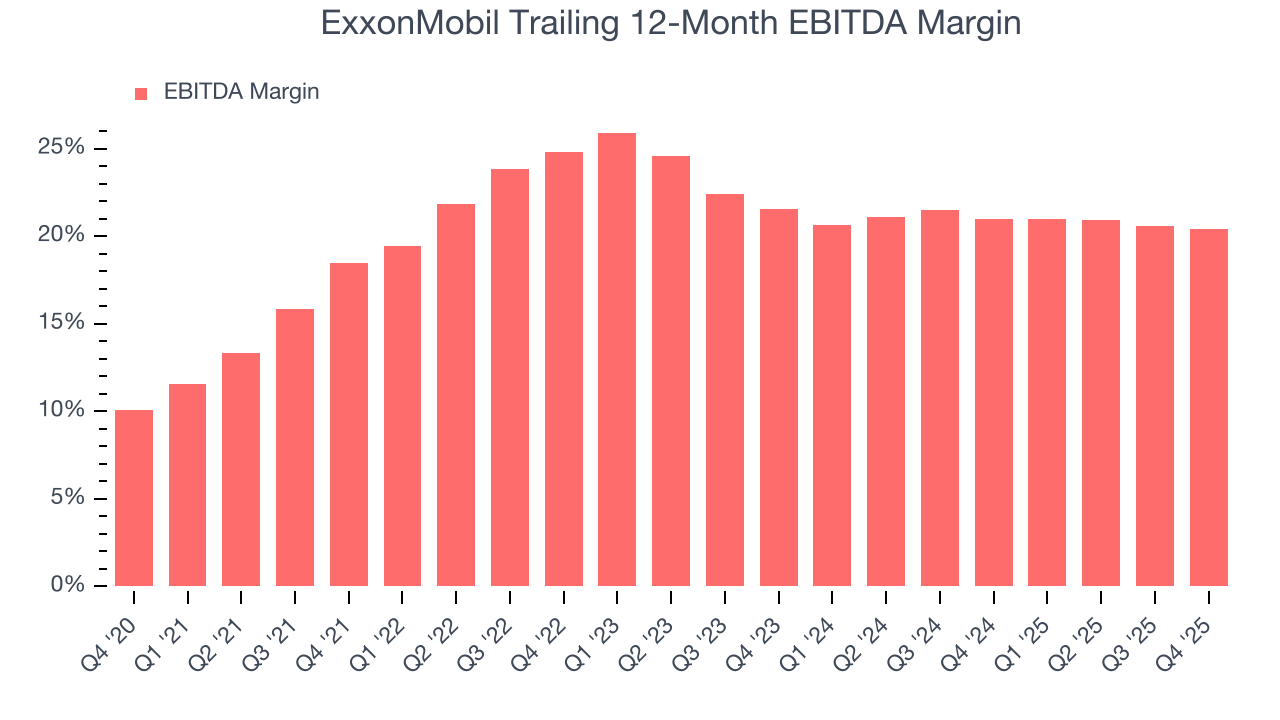
This quarter, ExxonMobil generated an EBITDA margin profit margin of 19.3%, in line with the same quarter last year. This indicates the company’s overall cost structure has been relatively stable. This adjusted EBITDA fell short of Wall Street’s estimates.
9. Cash Is King
Adjusted EBITDA shows how profitable a company’s existing wells are before financing and reinvestment decisions, but free cash flow shows how much value remains after paying the cost of replacing those wells. In upstream energy, production naturally declines over time, so companies must continuously reinvest just to stand still. A producer can report strong EBITDA margins yet generate little or no free cash flow if its wells decline quickly or if new drilling is expensive. Free cash flow therefore captures not only how efficiently a company produces hydrocarbons today, but also how costly it is to sustain that production into the future.
ExxonMobil has shown impressive cash profitability, giving it the option to reinvest or return capital to investors. The company’s free cash flow margin averaged 10.6% over the last five years, better than the broader energy upstream and integrated energy sector.
Absolute FCF margin levels matter but so does stability of free cash flow. All else equal, we’d prefer a 25.0% average free cash flow margin that is quite steady no matter how commodity prices behave rather than extremely high margins when times are good and negative ones when they’re tough.
ExxonMobil’s ratio of quarterly free cash flow volatility to WTI crude price volatility over the past five years was 2.8 (lower is better), indicating excellent insulation from commodity swings. This stability supports superior capital access in downturns and positions ExxonMobil to act as a consolidator when weaker peers are forced to retrench.
You may be asking why we wait until the free cash flow line to perform this stability analysis versus commodity prices. Why not compare revenue or EBITDA to WTI in the case of ExxonMobil? Because what ultimately matters is not how much revenue or profit you earn when prices are high but how much cash you can generate when prices are low. Free cash flow is the superior metric because it includes everything from hedging prowess to growth and maintenance capex to management behavior during good times and bad.
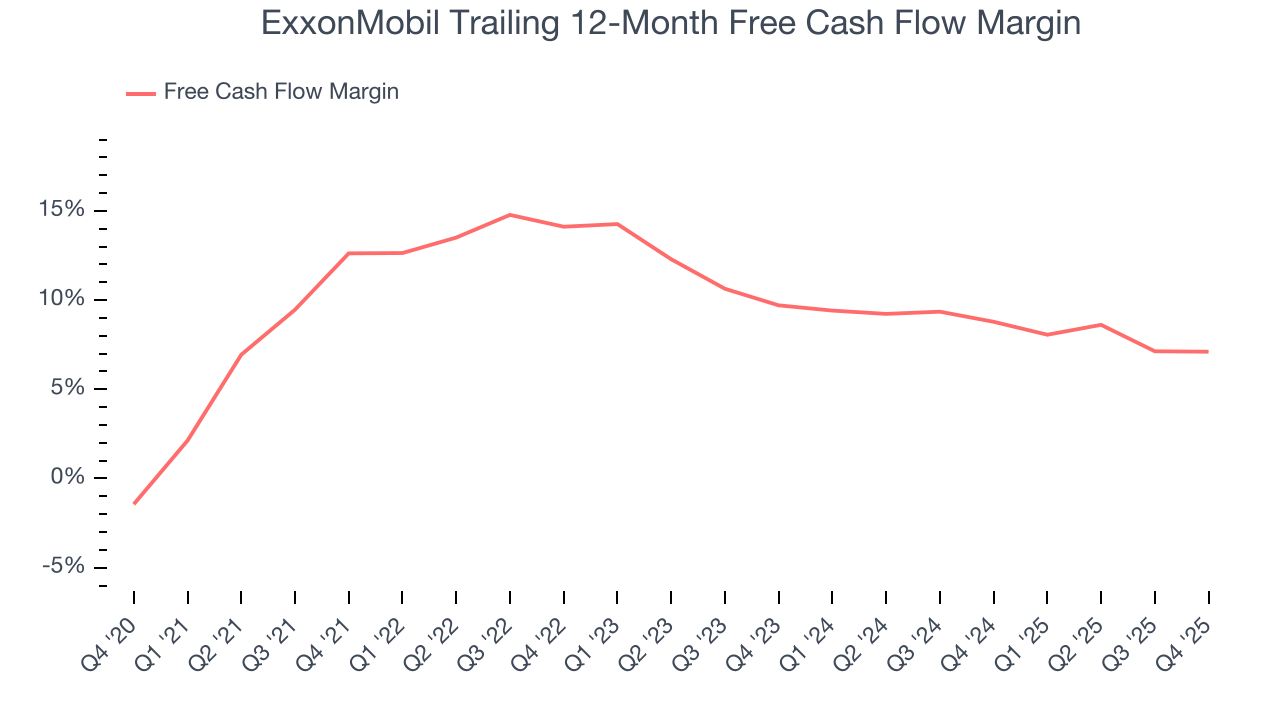
ExxonMobil’s free cash flow clocked in at $5.23 billion in Q4, equivalent to a 6.4% margin. This cash profitability was in line with the comparable period last year but below its five-year average. We wouldn’t put too much weight on it because investment needs can be seasonal, causing short-term swings. Long-term trends are more important.
10. Return on Invested Capital (ROIC)
Free cash flow tells investors how much money an Energy producer made, and ROIC takes this one step further by telling investors how well and effectively the business made it. ROIC illustrates how much operating profit a producer generated relative to the money it has raised (debt and equity).
We at StockStory like to look at ROIC over a ten-year period because energy investment cycles can involve up to five years of ramping production and another five years of harvesting. A decade view captures buying, extracting, and monetizing rather than just part of that picture. ExxonMobil’s management team makes decent investment decisions and generates value for shareholders. Its ten-year average ROIC was 10.4%, slightly better than typical energy upstream and integrated energy business.
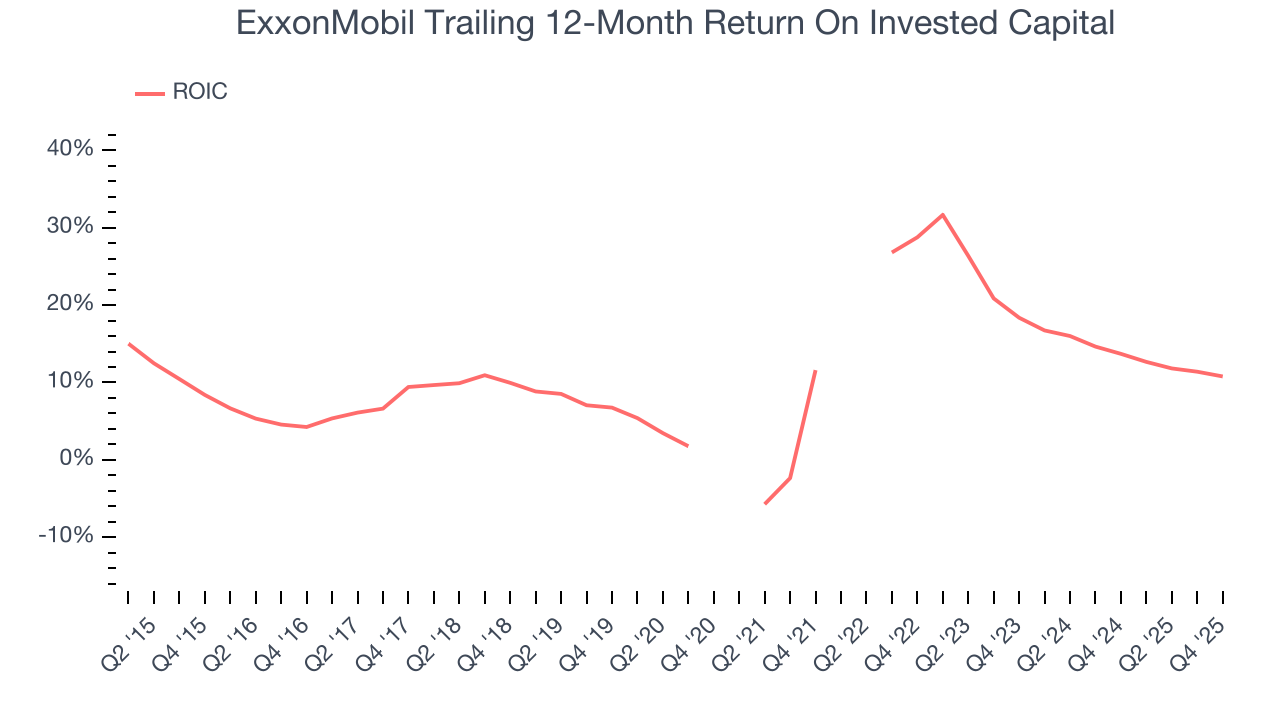 Note: Quarters not shown were determined to be outliers, impacted by outsized investment gains/losses that are not indicative of the recurring fundamentals of the business.
We like to invest in businesses with high returns, but the trend in a company’s ROIC is what often surprises the market and moves the stock price. Over the last few years, ExxonMobil’s ROIC has unfortunately decreased. Only time will tell if its new bets can bear fruit and potentially reverse the trend.
11. Balance Sheet Assessment
ExxonMobil reported $10.68 billion of cash and $43.54 billion of debt on its balance sheet in the most recent quarter. As investors in high-quality companies, we primarily focus on two things: 1) that a company’s debt level isn’t too high and 2) that its interest payments are not excessively burdening the business.
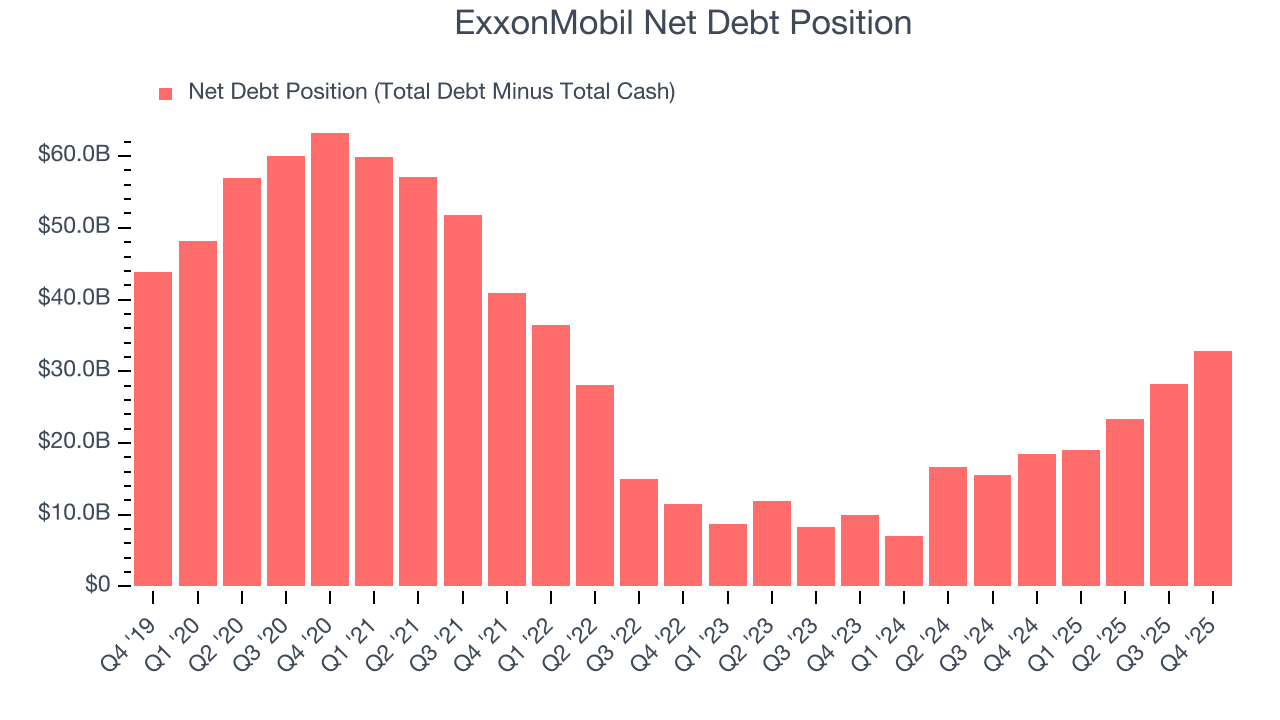
With $67.86 billion of EBITDA over the last 12 months, we view ExxonMobil’s 0.5× net-debt-to-EBITDA ratio as safe. We also see its $609 million of annual interest expenses as appropriate. The company’s profits give it plenty of breathing room, allowing it to continue investing in growth initiatives.
12. Key Takeaways from ExxonMobil’s Q4 Results
We enjoyed seeing ExxonMobil beat analysts’ production expectations this quarter. On the other hand, its EBITDA missed and its revenue fell slightly short of Wall Street’s estimates. Overall, this was a weaker quarter. The stock remained flat at $151.34 immediately after reporting.
13. Is Now The Time To Buy ExxonMobil?
Updated: March 18, 2026 at 1:09 AM EDT
We think that the latest earnings result is only one piece of the bigger puzzle. If you’re deciding whether to own ExxonMobil, you should also grasp the company’s longer-term business quality and valuation.
ExxonMobil isn’t a bad business, but we’re not clamoring to buy it here and now. First off, its revenue growth over the last five years was average for the sector. And while ExxonMobil’s EBITDA margins reveal bottom-tier profitability compared to other energy upstream and integrated energy companies, its top-tier scale enables operational efficiencies, capital market access, and investment in advanced technologies.
ExxonMobil’s P/E ratio based on the next 12 months is 21.1x. While this valuation is fair, the upside isn’t great compared to the potential downside. We're pretty confident there are superior stocks to buy right now.
Wall Street analysts have a consensus one-year price target of $148.96 on the company (compared to the current share price of $158.95).