
Kinder Morgan (KMI)
We see potential in Kinder Morgan. Although its sales growth has been weak, its profitability gives it the flexibility to ride out cycles.― StockStory Analyst Team
1. News

2. Summary
Why Kinder Morgan Is Interesting
Operating what amounts to the toll roads of the energy industry, Kinder Morgan (NYSE:KMI) transports natural gas, refined petroleum products, and crude oil through its pipeline network across North America.
- Unparalleled revenue scale of $16.94 billion gives it advantageous pricing and terms with suppliers
- Impressive free cash flow profitability enables the company to fund new investments or reward investors with share buybacks/dividends
- A downside is its ROIC of 4.7% reflects management’s challenges in identifying attractive investment opportunities


Kinder Morgan has some respectable qualities. This company is certainly worth watching.
Why Should You Watch Kinder Morgan


Kinder Morgan’s stock price of $33.90 implies a valuation ratio of 24.5x forward P/E. This valuation represents a premium to energy upstream and integrated energy peers.
Kinder Morgan could improve its business quality by stringing together a few solid quarters. We’d be more open to buying the stock when that time comes.
3. Kinder Morgan (KMI) Research Report: Q4 CY2025 Update
Energy infrastructure company Kinder Morgan (NYSE:KMI) reported Q4 CY2025 results topping the market’s revenue expectations, with sales up 13.1% year on year to $4.51 billion. Its non-GAAP profit of $0.39 per share was 6.5% above analysts’ consensus estimates.
Kinder Morgan (KMI) Q4 CY2025 Highlights:
- Revenue: $4.51 billion vs analyst estimates of $4.38 billion (13.1% year-on-year growth, 3% beat)
- Adjusted EPS: $0.39 vs analyst estimates of $0.37 (6.5% beat)
- Adjusted EBITDA: $2.27 billion vs analyst estimates of $2.21 billion (50.4% margin, 2.8% beat)
- Operating Margin: 30.3%, up from 27.8% in the same quarter last year
- Free Cash Flow Margin: 19.3%, similar to the same quarter last year
- Market Capitalization: $75 billion
Company Overview
Operating what amounts to the toll roads of the energy industry, Kinder Morgan (NYSE:KMI) transports natural gas, refined petroleum products, and crude oil through its pipeline network across North America.
The company's business is built around approximately 79,000 miles of pipelines that move energy products from where they're produced to where they're consumed. For natural gas, this means gathering it from production wells, processing it to remove natural gas liquids (NGL), transporting it through interstate and intrastate pipelines, and storing it in underground facilities. On the liquids side, pipelines carry refined products like gasoline, diesel, and jet fuel from refineries to distribution terminals, while separate systems transport crude oil and condensate from production areas to refineries.
Kinder Morgan also operates 139 terminals that store and handle various products. Liquids terminals near major cities store fuels and chemicals, often under long-term contracts where customers pay for reserved capacity whether they use it or not. Bulk terminals handle solid materials like petroleum coke and metals. For example, a gasoline terminal might receive fuel via pipeline from multiple refineries, store it in large tanks, and then load it onto trucks for delivery to gas stations throughout a metropolitan area.
The company's carbon dioxide (CO2) segment serves a specialized niche. It captures CO2 from natural sources, transports it through dedicated pipelines, and sells it to oil producers who inject it into mature oil fields to push out additional crude oil that would otherwise remain underground. This enhanced oil recovery technique extends the productive life of aging fields.
Revenue comes primarily from fees charged for transportation and storage services. Most natural gas transportation operates under long-term contracts with an average remaining life of approximately seven years, providing predictable cash flows. The company is subject to Federal Energy Regulatory Commission (FERC) oversight for interstate pipelines, which regulates rates and ensures fair access to pipeline capacity.
4. Infrastructure
Energy infrastructure companies build, own, and operate assets including pipelines, storage facilities, and processing plants that transport and handle oil, natural gas, and related products. These businesses often generate fee-based revenues providing cash flow stability. Tailwinds include growing production volumes requiring expanded takeaway capacity and export infrastructure demand. Long-term contracts with creditworthy counterparties reduce commodity price exposure. Headwinds include permitting and regulatory challenges delaying new projects, environmental opposition to pipeline construction, and potential long-term demand decline from energy transition. High capital intensity and interest rate sensitivity affecting financing costs present additional considerations.
Kinder Morgan's competitors include Williams Companies (NYSE:WMB), ONEOK (NYSE:OKE), Energy Transfer (NYSE:ET), Enterprise Products Partners (NYSE:EPD), and TC Energy (NYSE:TRP).
5. Economies of Scale
In Energy, scale separates fragile single-asset producers from platform-style businesses that generate revenue across entire basins and infrastructure networks. Kinder Morgan’s $16.94 billion of revenue in the last year is top-tier for the industry, suggesting the type of diversification that reduces operational risk.
6. Revenue Growth
Cyclical industries such as Energy can make mediocre companies look great for a time, but a long-term view reveals which businesses can actually withstand and adapt to changing conditions. Over the last five years, Kinder Morgan grew its sales at a tepid 7.7% compounded annual growth rate. This wasn’t a great result compared to the rest of the energy upstream and integrated energy sector, but there are still things to like about Kinder Morgan.
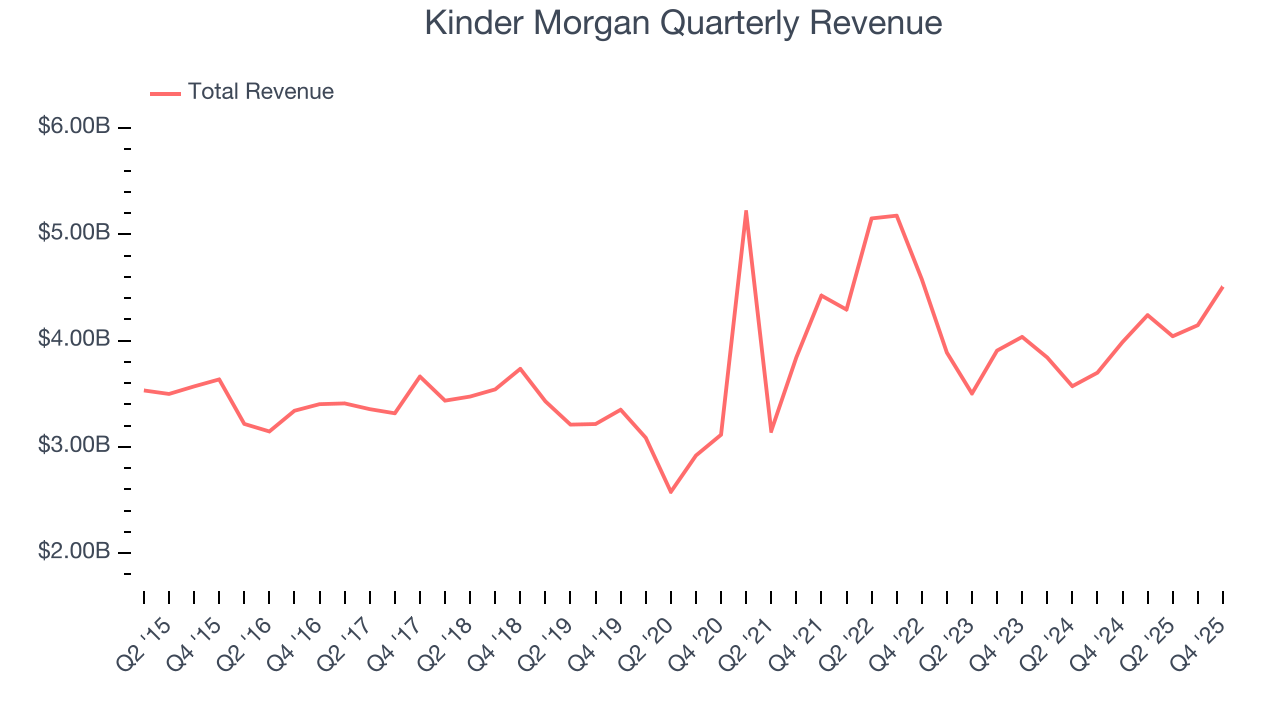
Within Energy, a singular timeframe, even if it’s quite long-term, only sheds light on how well a company rode the last commodity cycle. To better assess whether a company compounds through cycles, we validate our view with an even longer, ten-year view. Kinder Morgan’s annualized revenue growth of 1.8% over the last ten years is below its five-year trend, but we still think the results were respectable.
This quarter, Kinder Morgan reported year-on-year revenue growth of 13.1%, and its $4.51 billion of revenue exceeded Wall Street’s estimates by 3%.
7. Gross Margin
In a single quarter or year, gross margins in the sector can swing wildly due to commodity prices, hedging, or changes in labor costs. Over a multi-year period across different points in the cycle, gross margin differences can signal whether a company is a structurally-advantaged producer (“rock” quality, takeaway, operating costs) or not.
Kinder Morgan, which averaged 46.6% gross margin over the last five years, exhibits mediocre unit economics in the sector. Energy companies with higher gross margins are more likely to remain profitable when commodity prices decline. 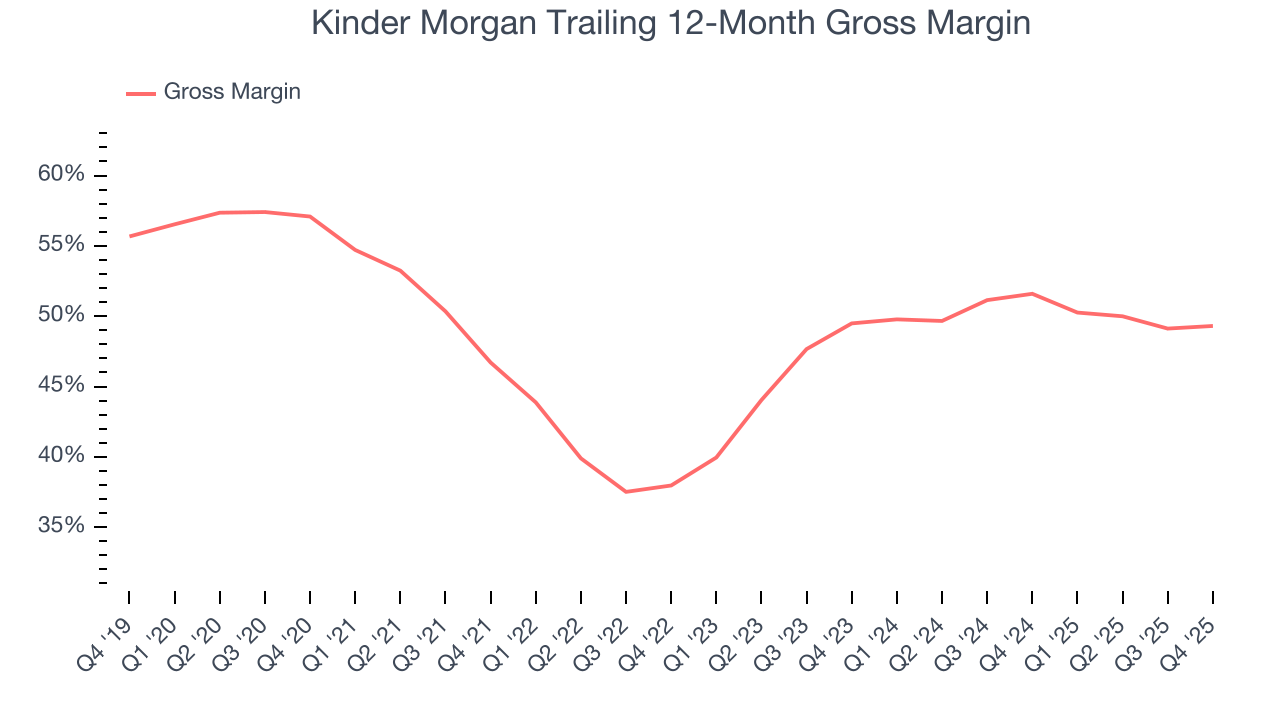
This quarter, Kinder Morgan’s gross profit margin was 50.5%, in line with the same quarter last year.
8. Adjusted EBITDA Margin
Adjusted EBITDA margin captures the true operating profitability of an energy producer by removing accounting noise around depletion and capitalized drilling costs. It reveals how much cash the asset base generates before capital structure and reinvestment requirements shape reported earnings.
Kinder Morgan has been an efficient company over the last five years. It was one of the more profitable businesses in the energy upstream and integrated energy sector, boasting an average EBITDA margin of 47.3%.
Analyzing the trend in its profitability, Kinder Morgan’s EBITDA margin rose by 1.8 percentage points over the last year, as its sales growth gave it operating leverage.
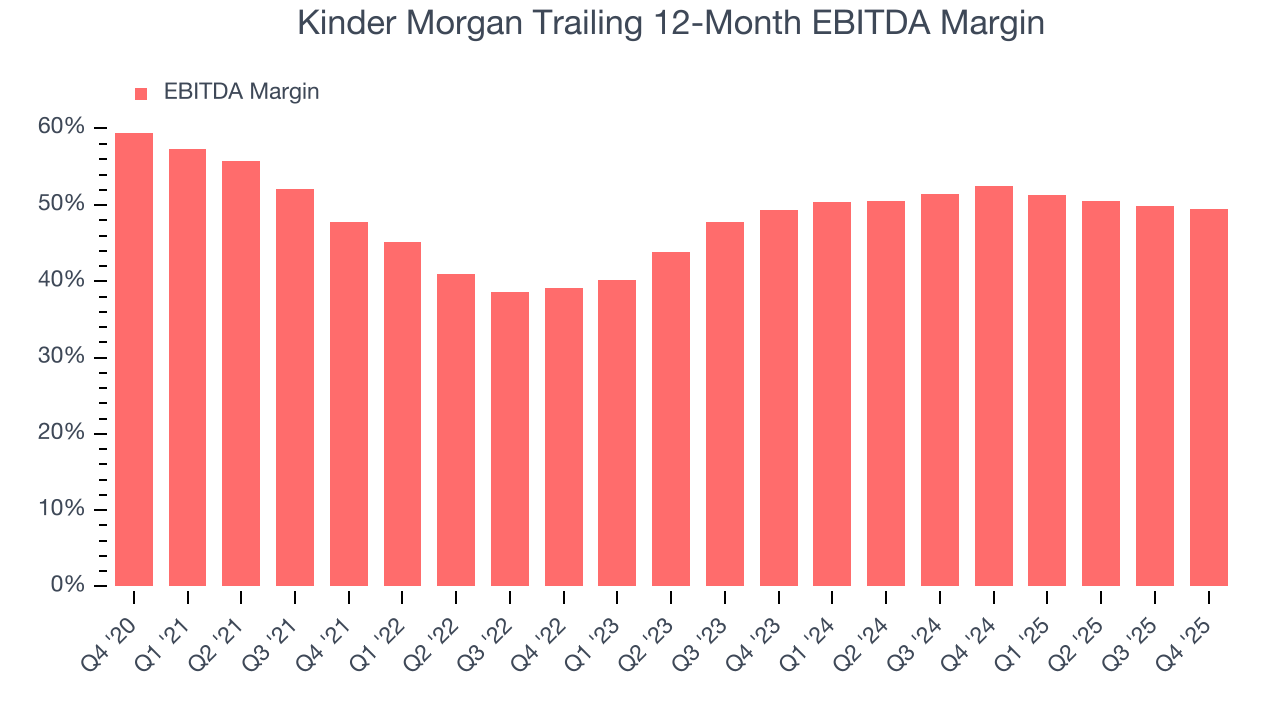
In Q4, Kinder Morgan generated an EBITDA margin profit margin of 50.4%, down 1.4 percentage points year on year. This reduction is quite minuscule and indicates the company’s overall cost structure has been relatively stable. This adjusted EBITDA beat Wall Street’s estimates by 2.8%.
9. Cash Is King
As mentioned above, adjusted EBITDA ignores capital structure and drilling expenditure decisions. These are two huge aspects of an Energy producer, so in order to understand a comprehensive picture of business quality, an investor needs to account for these. Said differently, adjusted EBITDA margins could be solid but free cash flow is abysmal because decline rates of the asset are extreme and the drilling is expensive. Free cash flow tells you about not only the economics of the production that has happened but how much it costs to stay in business as well (further drilling or extraction).
Kinder Morgan has shown terrific cash profitability, enabling it to reinvest, return capital to investors, and stay ahead of the competition while maintaining an ample cushion. The company’s free cash flow margin was among the best in the energy upstream and integrated energy sector, averaging 21.4% over the last five years.
The level of free cash flow is important, but its durability across cycles is just as critical. Consistent margins are far more valuable than volatile swings driven by commodity prices.
Kinder Morgan’s ratio of quarterly free cash flow volatility to WTI crude price volatility over the past five years was 2.4 (lower is better), indicating excellent insulation from commodity swings. This stability supports superior capital access in downturns and positions Kinder Morgan to act as a consolidator when weaker peers are forced to retrench.
You may be asking why we wait until the free cash flow line to perform this stability analysis versus commodity prices. Why not compare revenue or EBITDA to WTI Crude prices in the case of Kinder Morgan? Because what ultimately matters is not how much revenue or profit you earn when prices are high but how much cash you can generate when prices are low. Free cash flow is the superior metric because it includes everything from hedging prowess to growth and maintenance capex to management behavior during good times and bad.
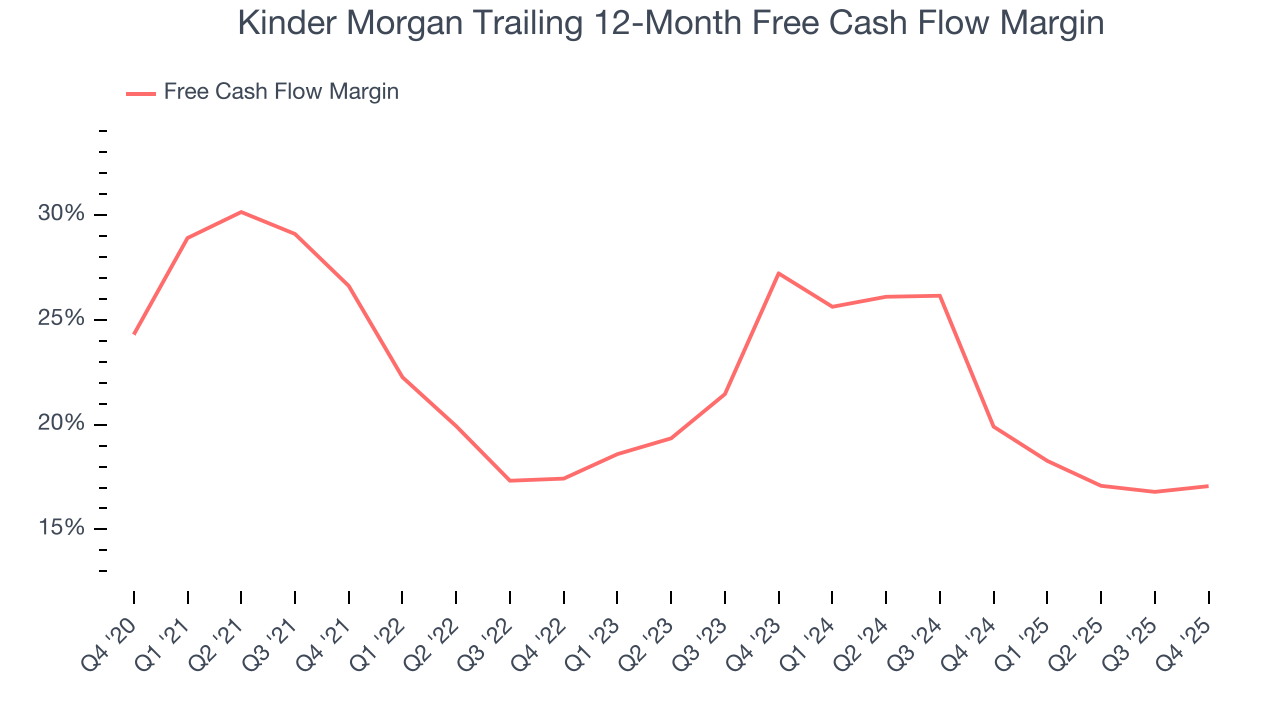
Kinder Morgan’s free cash flow clocked in at $872 million in Q4, equivalent to a 19.3% margin. This cash profitability was in line with the comparable period last year but below its five-year average. We wouldn’t read too much into it because investment needs can be seasonal, leading to short-term swings. Long-term trends carry greater meaning.
10. Return on Invested Capital (ROIC)
Free cash flow tells investors how much money an Energy producer made, and ROIC takes this one step further by telling investors how well and effectively the business made it. ROIC illustrates how much operating profit a producer generated relative to the money it has raised (debt and equity).
We at StockStory like to look at ROIC over a ten-year period because energy investment cycles can involve up to five years of ramping production and another five years of harvesting. A decade view captures buying, extracting, and monetizing rather than just part of that picture. Although Kinder Morgan has shown solid fundamentals lately, it historically did a mediocre job investing in profitable growth initiatives. Its ten-year average ROIC was 4.7%, lower than the typical cost of capital (how much it costs to raise money) for energy upstream and integrated energy companies.
We like to invest in businesses with high returns, but the trend in a company’s ROIC is what often surprises the market and moves the stock price. Fortunately, Kinder Morgan’s ROIC averaged 1.8 percentage point increases each year over the last few years. its rising ROIC is a good sign and could suggest its competitive advantage or profitable growth opportunities are expanding.
11. Balance Sheet Assessment
Kinder Morgan reported $63 million of cash and $32 billion of debt on its balance sheet in the most recent quarter. As investors in high-quality companies, we primarily focus on two things: 1) that a company’s debt level isn’t too high and 2) that its interest payments are not excessively burdening the business.
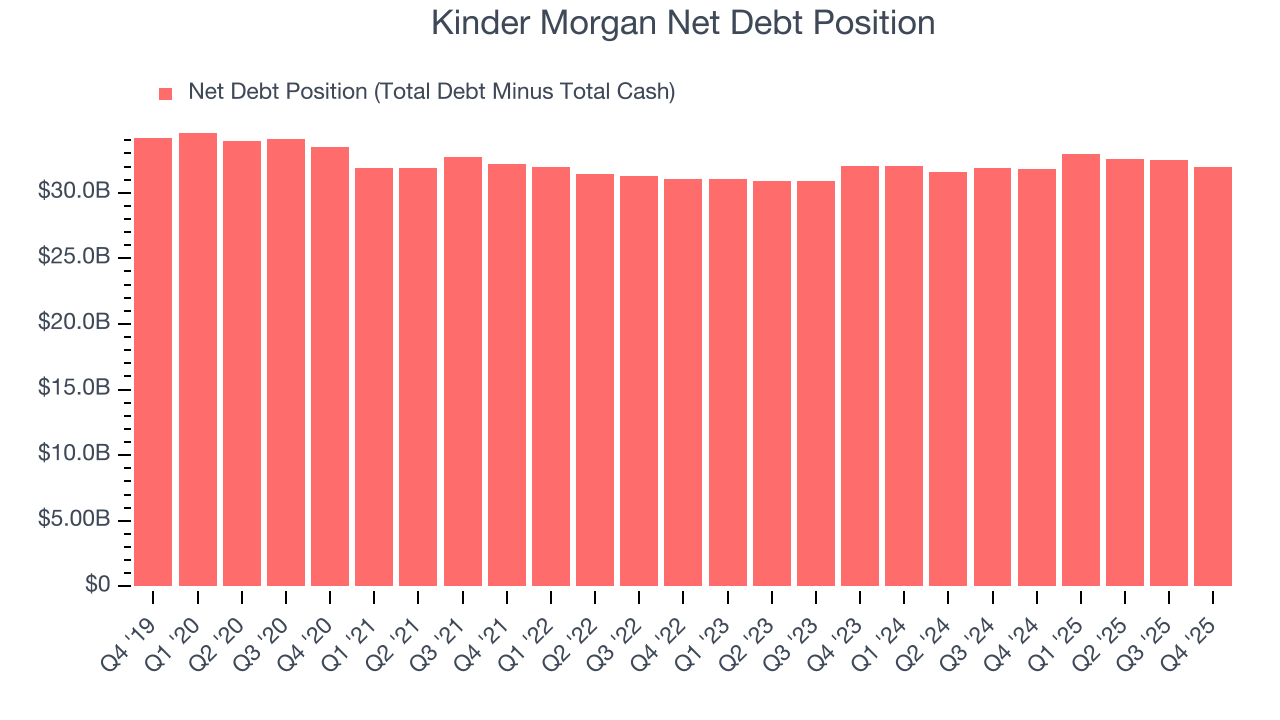
With $8.39 billion of EBITDA over the last 12 months, we view Kinder Morgan’s 3.8× net-debt-to-EBITDA ratio as safe. We also see its $1.8 billion of annual interest expenses as appropriate. The company’s profits give it plenty of breathing room, allowing it to continue investing in growth initiatives.
12. Key Takeaways from Kinder Morgan’s Q4 Results
We enjoyed seeing Kinder Morgan beat analysts’ revenue expectations this quarter. We were also glad its EPS outperformed Wall Street’s estimates. Overall, we think this was a decent quarter with some key metrics above expectations. The stock traded up 1.4% to $34.17 immediately after reporting.
13. Is Now The Time To Buy Kinder Morgan?
Updated: March 25, 2026 at 12:25 AM EDT
Are you wondering whether to buy Kinder Morgan or pass? We urge investors to not only consider the latest earnings results but also longer-term business quality and valuation as well.
Kinder Morgan possesses a number of positive attributes. Although its revenue growth was quite poor over the last five years and analysts expect growth to slow over the next 12 months, its top-tier scale enables operational efficiencies, capital market access, and investment in advanced technologies. And while its relatively low ROIC suggests management has struggled to find compelling investment opportunities, its powerful free cash flow generation enables it to stay ahead of the competition through consistent reinvestment of profits.
Kinder Morgan’s P/E ratio based on the next 12 months is 24.5x. This valuation tells us that a lot of optimism is priced in. Add this one to your watchlist and come back to it later.
Wall Street analysts have a consensus one-year price target of $34.14 on the company (compared to the current share price of $33.90).