
Calumet (CLMT)
Calumet keeps us up at night. Its weak returns on capital indicate management was inefficient with its resources and missed opportunities.― StockStory Analyst Team
1. News
2. Summary
Why We Think Calumet Will Underperform
With roots dating back to 1919 and facilities strategically positioned from Louisiana to Montana, Calumet (NASDAQ:CLMT) refines crude oil into specialty products like lubricating oils, solvents, and waxes used in cosmetics, batteries, and industrial applications.
- Gross margin of 7.8% is below its competitors, leaving less money to invest in exploration and production
- EBITDA margin falls short of the industry average, and the smaller profit dollars make it harder to react to unexpected market developments
- 7× net-debt-to-EBITDA ratio shows it’s overleveraged and increases the probability of shareholder dilution if things turn unexpectedly


Calumet’s quality doesn’t meet our hurdle. We’re looking for better stocks elsewhere.
Why There Are Better Opportunities Than Calumet


Calumet’s stock price of $28.61 implies a valuation ratio of 11.8x forward EV-to-EBITDA. This multiple is higher than most energy upstream and integrated energy companies, and we think it’s quite expensive for the weaker revenue growth you get.
There are stocks out there similarly priced with better business quality. We prefer owning these.
3. Calumet (CLMT) Research Report: Q4 CY2025 Update
Specialty products refiner Calumet (NASDAQ:CLMT) missed Wall Street’s revenue expectations in Q4 CY2025, but sales rose 9.4% year on year to $1.04 billion. Its non-GAAP loss of $0.18 per share was 59.9% above analysts’ consensus estimates.
Calumet (CLMT) Q4 CY2025 Highlights:
- Revenue: $1.04 billion vs analyst estimates of $1.06 billion (9.4% year-on-year growth, 1.8% miss)
- Adjusted EPS: -$0.18 vs analyst estimates of -$0.46 (59.9% beat)
- Adjusted EBITDA: $69.3 million vs analyst estimates of $73.37 million (6.7% margin, 5.5% miss)
- Operating Margin: -6.2%, down from 2.4% in the same quarter last year
- Free Cash Flow was $103.8 million, up from -$28.4 million in the same quarter last year
- Market Capitalization: $2.64 billion
Company Overview
With roots dating back to 1919 and facilities strategically positioned from Louisiana to Montana, Calumet (NASDAQ:CLMT) refines crude oil into specialty products like lubricating oils, solvents, and waxes used in cosmetics, batteries, and industrial applications.
The company operates through three business segments. Its Specialty Products and Solutions segment manufactures specialty petroleum products at refineries in Louisiana and Pennsylvania. These facilities process paraffinic and naphthenic crude oils through specialized hydroprocessing, dewaxing, and distillation to create products like white mineral oils (used in cosmetics and pharmaceuticals), petrolatums (the base for petroleum jelly), lubricating oils (for industrial machinery and transformers), paraffin waxes (for candles and coatings), and solvents (for paints and adhesives). For example, a cosmetics manufacturer might purchase food-grade white oil from Calumet as a base ingredient for lotions and creams.
The Performance Brands segment markets high-performance lubricants and fuels through its Royal Purple, Bel-Ray, and TruFuel brands. These products serve automotive enthusiasts, motorcyclists, and small engine users who seek premium synthetic lubricants and specialty fuels. The Montana/Renewables segment operates two distinct facilities in Great Falls, Montana: one processes renewable feedstocks like waste oils and seed oils into renewable diesel and sustainable aviation fuel (SAF), while the other refines Canadian crude oil into conventional fuels and specialty asphalt for regional markets.
Calumet's specialty products business model centers on long-term customer relationships, with an approval process that can take six months to two years before customers integrate its products into their formulations. The company sold to approximately 2,200 specialty products customers in 2024, distributing products via railcar, truck, and barge across North America and internationally. It generates revenue by selling refined products to manufacturers who use them as raw material components, to fuel distributors and retail chains, and to counterparties who purchase renewable fuels under multiyear offtake agreements. The company operates a fleet of approximately 2,100 leased railcars to transport crude oil and distribute products across its facility network.
4. Infrastructure
Energy infrastructure companies build, own, and operate assets including pipelines, storage facilities, and processing plants that transport and handle oil, natural gas, and related products. These businesses often generate fee-based revenues providing cash flow stability. Tailwinds include growing production volumes requiring expanded takeaway capacity and export infrastructure demand. Long-term contracts with creditworthy counterparties reduce commodity price exposure. Headwinds include permitting and regulatory challenges delaying new projects, environmental opposition to pipeline construction, and potential long-term demand decline from energy transition. High capital intensity and interest rate sensitivity affecting financing costs present additional considerations.
Calumet's competitors vary by product line and include Ergon Refining, Cross Oil Refining, Exxon Mobil (NYSE:XOM), Phillips 66 (NYSE:PSX), HF Sinclair (NYSE:DINO), Valvoline (NYSE:VVV), Marathon Petroleum (NYSE:MPC), and Chevron (NYSE:CVX).
5. Economies of Scale
The scale of a company’s revenue base is an important lens through which to view the topline, as it signals whether a producer has gone from a vulnerable commodity taker into a durable operating platform. Larger producers generate revenue across many wells, pads, takeaway routes, and geographies rather than relying on a single field or drilling program. Calumet’s $4.14 billion of revenue in the last year is mid-sized for the industry.
6. Revenue Growth
Cyclical sectors like Energy often flatter weaker operators during favorable price environments, but a longer-term lens separates those from businesses that can consistently perform across market cycles. Luckily, Calumet’s sales grew at a decent 12.8% compounded annual growth rate over the last five years. Its growth was slightly above the average energy upstream and integrated energy company and shows its offerings resonate with customers.
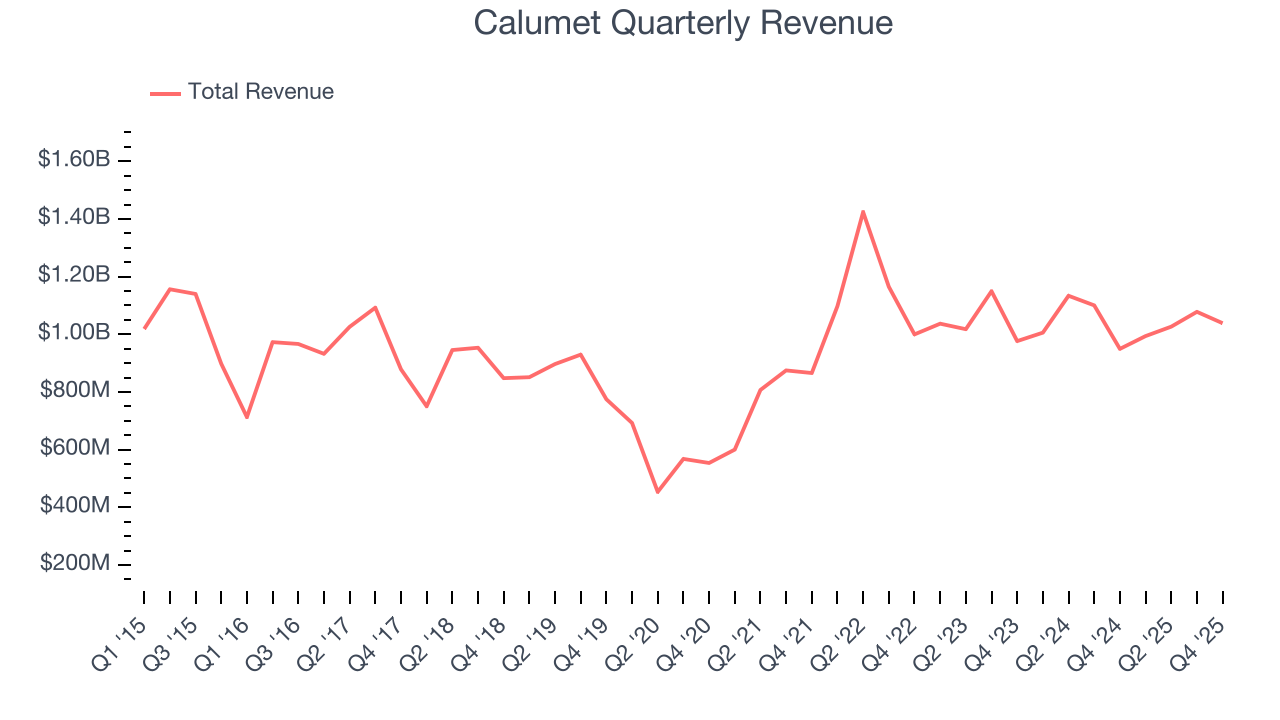
Energy cycles can be long enough that a single five-year period can still reflect one price environment, which is why an additional, decade-long view can help capture through-cycle performance. Calumet’s recent performance shows its demand has accelerated as its revenue was flat over the last ten years.
Revenue provides useful context, but it is heavily influenced by commodity prices and acquisitions. Production volumes, by contrast, reveal whether the underlying asset base is actually growing. Over the last two years, Calumet’s total oil volume per day - Upstream averaged 6.6% year-on-year growth while natural gas volume per day - Upstream averaged 4.7% year-on-year growth, which was good. 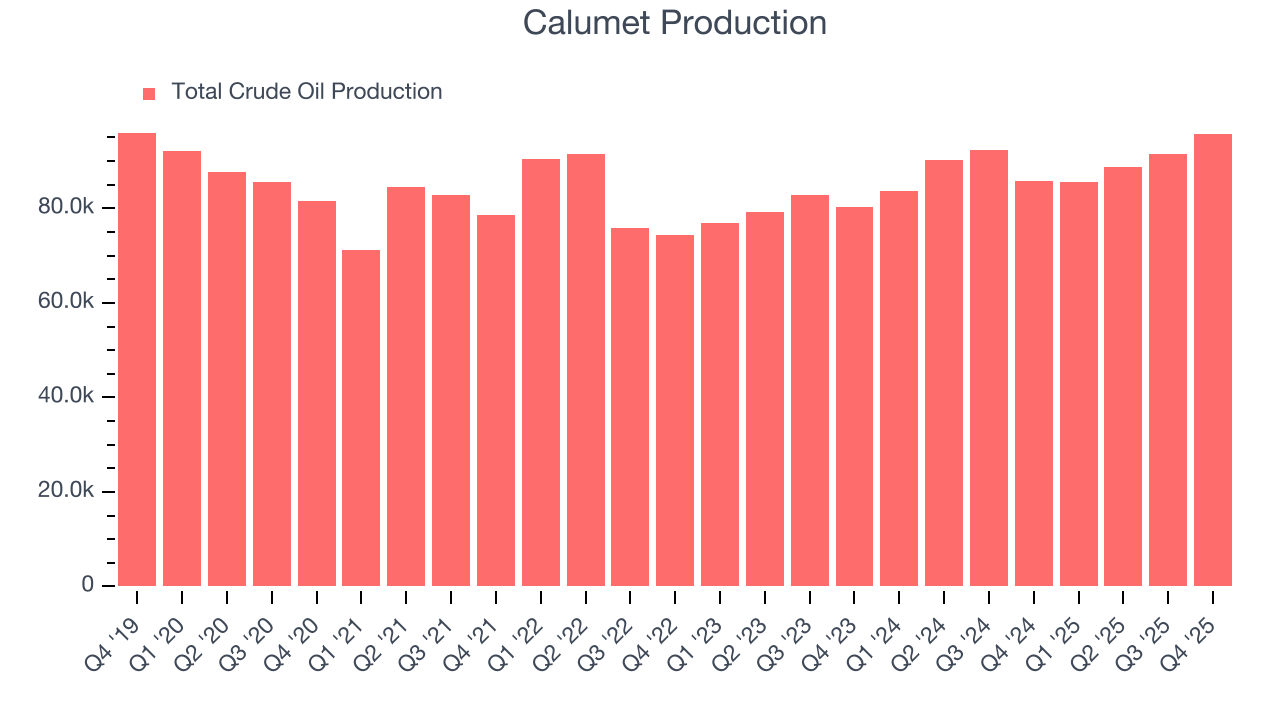
This quarter, Calumet’s revenue grew by 9.4% year on year to $1.04 billion, missing Wall Street’s estimates. This quarter, Calumet reported year-on-year production growth of 11.6%, and its 95.8 Mboe (thousand barrels of oil equivalent) of production exceeded Wall Street’s estimates by 44.3%.
7. Gross Margin
While energy gross margins can be distorted by commodity prices, hedging, and short-term cost swings, sustained margins across a full cycle reflect a producer’s underlying asset quality, infrastructure position, and cost structure.
Calumet, which averaged 7.8% gross margin over the last five years, exhibiting bottom-tier unit economics in the sector. It means the company will struggle at higher commodity prices than peers with better gross margins. 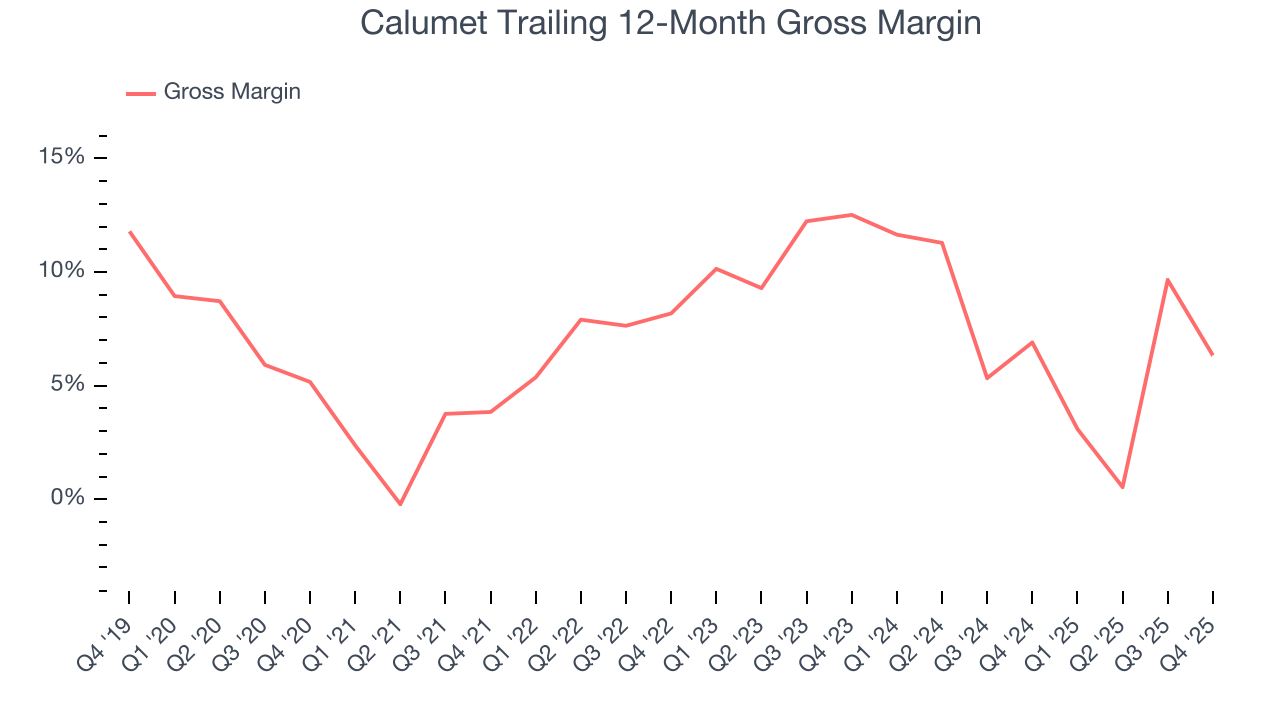
Calumet produced a 1.3% gross profit margin in Q4 , marking a 13.7 percentage point decrease from 14.9% in the same quarter last year. Note that energy margins can be volatile due to commodity price changes.
8. Adjusted EBITDA Margin
Calumet was profitable over the last five years but held back by its large cost base. Its average EBITDA margin of 6.3% was among the worst in the energy upstream and integrated energy sector.
On the plus side, Calumet’s EBITDA margin rose by 3.6 percentage points over the last year.
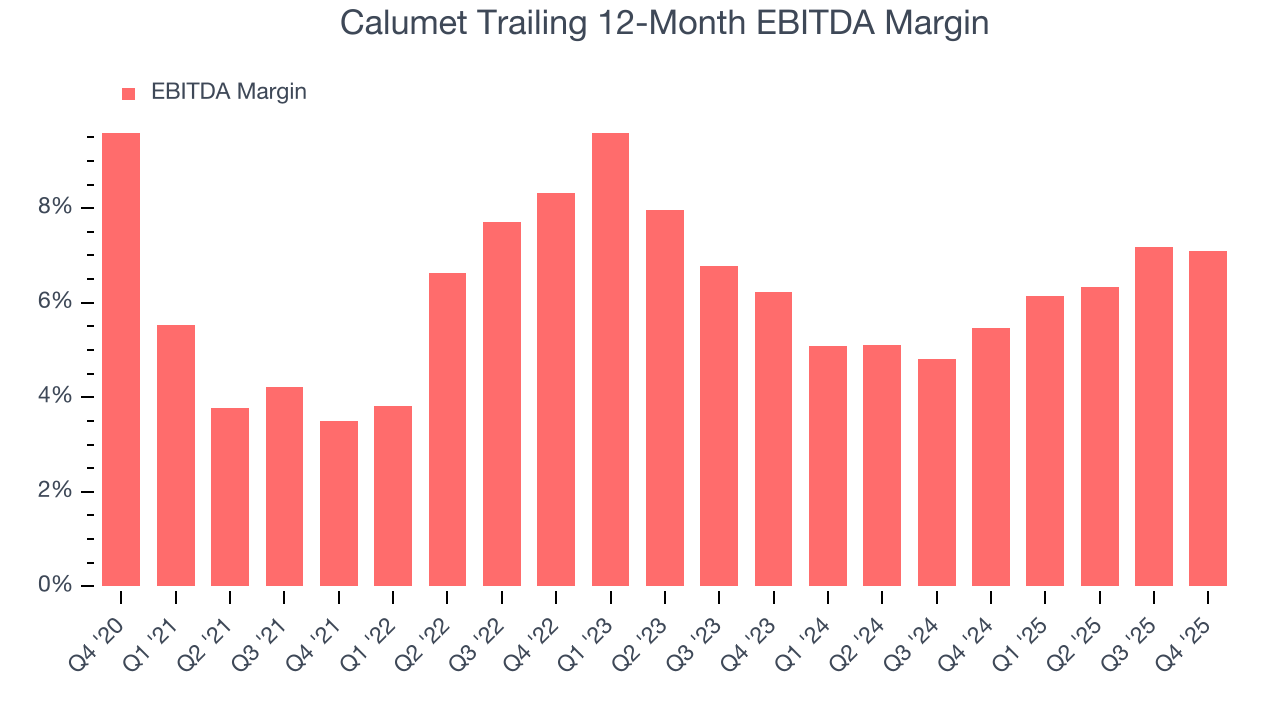
In Q4, Calumet generated an EBITDA margin profit margin of 6.7%, in line with the same quarter last year. This indicates the company’s overall cost structure has been relatively stable. This adjusted EBITDA fell short of Wall Street’s estimates.
9. Cash Is King
As mentioned above, adjusted EBITDA ignores capital structure and drilling expenditure decisions. These are two huge aspects of an Energy producer, so in order to understand a comprehensive picture of business quality, an investor needs to account for these. Said differently, adjusted EBITDA margins could be solid but free cash flow is abysmal because decline rates of the asset are extreme and the drilling is expensive. Free cash flow tells you about not only the economics of the production that has happened but how much it costs to stay in business as well (further drilling or extraction).
While Calumet posted positive free cash flow this quarter, the broader story hasn’t been so clean. Calumet’s demanding reinvestments have consumed many resources over the last five years, contributing to an average free cash flow margin of negative 4.5%. This means it lit $4.50 of cash on fire for every $100 in revenue.
Absolute FCF margin levels matter but so does stability of free cash flow. All else equal, we’d prefer a 25.0% average free cash flow margin that is quite steady no matter how commodity prices behave rather than extremely high margins when times are good and negative ones when they’re tough.
Calumet’s ratio of quarterly free cash flow volatility to WTI crude price volatility over the past five years was 11.1 (lower is better), indicating that its cash generation is far more sensitive to commodity-price swings than most peers. This elevated volatility limits its access to capital in downturns and makes it unlikely to act as a consolidator when weaker competitors come under pressure.
You may be asking why we wait until the free cash flow line to perform this stability analysis versus commodity prices. Why not compare revenue or EBITDA to WTI Crude prices in the case of Calumet? Because what ultimately matters is not how much revenue or profit you earn when prices are high but how much cash you can generate when prices are low. Free cash flow is the superior metric because it includes everything from hedging prowess to growth and maintenance capex to management behavior during good times and bad.
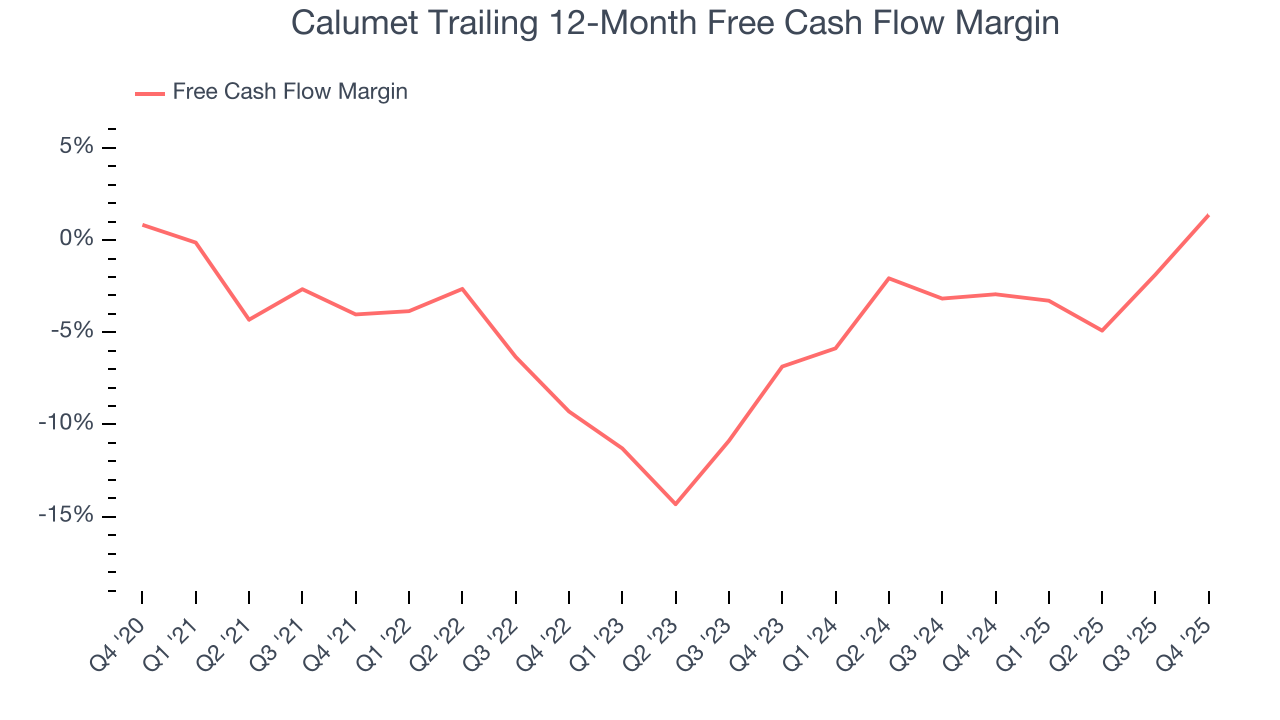
Calumet’s free cash flow clocked in at $103.8 million in Q4, equivalent to a 10% margin. Its cash flow turned positive after being negative in the same quarter last year, marking a potential inflection point.
10. Return on Invested Capital (ROIC)
Free cash flow tells investors how much money an Energy producer made, and ROIC takes this one step further by telling investors how well and effectively the business made it. ROIC illustrates how much operating profit a producer generated relative to the money it has raised (debt and equity).
We at StockStory like to look at ROIC over a ten-year period because energy investment cycles can involve up to five years of ramping production and another five years of harvesting. A decade view captures buying, extracting, and monetizing rather than just part of that picture. Calumet historically did a mediocre job investing in profitable growth initiatives. Its nine-year average ROIC was 4.3%, lower than the typical cost of capital (how much it costs to raise money) for energy upstream and integrated energy companies.
We like to invest in businesses with high returns, but the trend in a company’s ROIC is what often surprises the market and moves the stock price. Calumet’s ROIC has increased over the last few years. This is a good sign, and we hope the company can continue improving.
11. Balance Sheet Risk
As long-term investors, the risk we care about most is the permanent loss of capital, which can happen when a company goes bankrupt or raises money from a disadvantaged position. This is separate from short-term stock price volatility, something we are much less bothered by.
Calumet’s $2.23 billion of debt exceeds the $205.1 million of cash on its balance sheet. Furthermore, its 7× net-debt-to-EBITDA ratio (based on its EBITDA of $293.3 million over the last 12 months) shows the company is overleveraged.
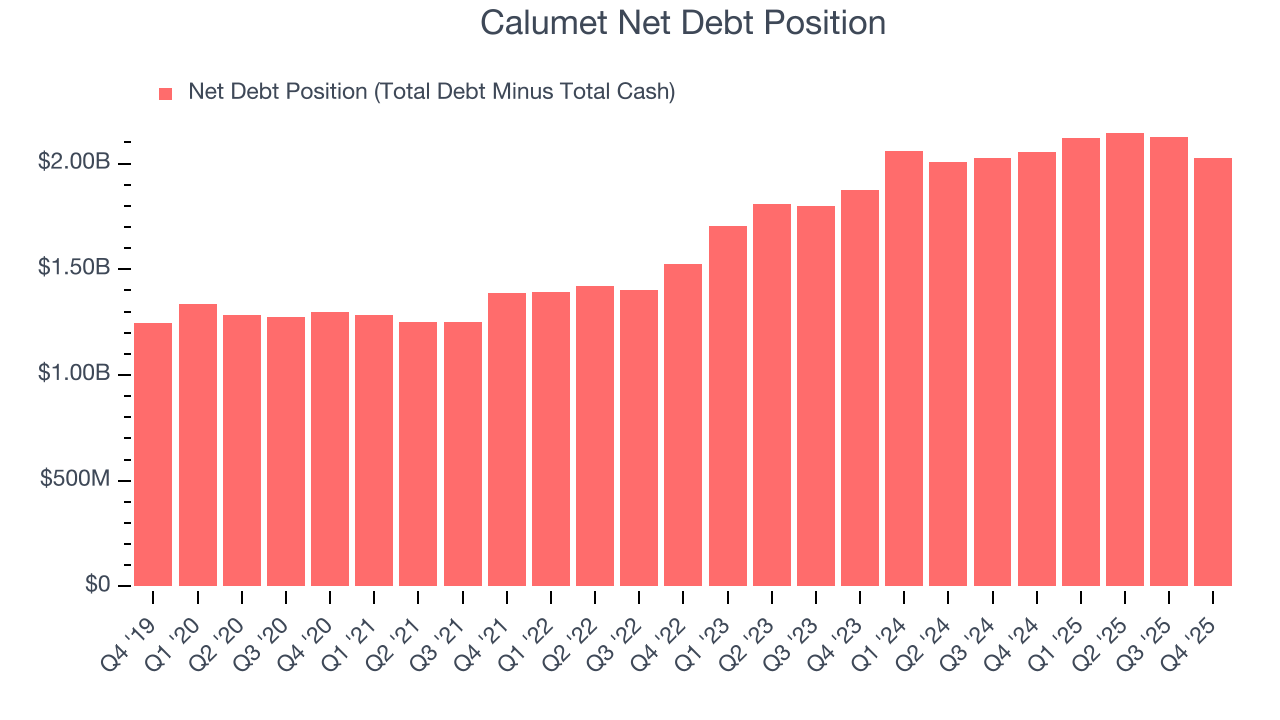
At this level of debt, incremental borrowing becomes increasingly expensive and credit agencies could downgrade the company’s rating if profitability falls. Calumet could also be backed into a corner if the market turns unexpectedly – a situation we seek to avoid as investors in high-quality companies.
We hope Calumet can improve its balance sheet and remain cautious until it increases its profitability or pays down its debt.
12. Key Takeaways from Calumet’s Q4 Results
We were impressed by how significantly Calumet blew past analysts’ production expectations this quarter. We were also glad its EPS outperformed Wall Street’s estimates. On the other hand, its revenue missed and its EBITDA fell short of Wall Street’s estimates. Zooming out, we think this was a mixed quarter. The market seemed to be hoping for more, and the stock traded down 3.9% to $29.22 immediately after reporting.
13. Is Now The Time To Buy Calumet?
Updated: March 18, 2026 at 1:15 AM EDT
We think that the latest earnings result is only one piece of the bigger puzzle. If you’re deciding whether to own Calumet, you should also grasp the company’s longer-term business quality and valuation.
Calumet falls short of our quality standards. Although its revenue growth over the last five years was average for the sector, it’s expected to deteriorate over the next 12 months and its EBITDA margins reveal bottom-tier profitability compared to other energy upstream and integrated energy companies. And while the company’s scale enables operational efficiencies, capital market access, and investment in advanced technologies, the downside is its gross margins show its business model is much less lucrative than other companies.
Calumet’s EV-to-EBITDA ratio based on the next 12 months is 11.8x. While this valuation is reasonable, we don’t see a big opportunity at the moment. There are superior stocks to buy right now.
Wall Street analysts have a consensus one-year price target of $30.20 on the company (compared to the current share price of $28.61).