
DHT Holdings (DHT)
We’re cautious of DHT Holdings. Its low gross margin indicates weak unit economics and its declining sales suggest its offerings are unpopular.― StockStory Analyst Team
1. News
2. Summary
Why We Think DHT Holdings Will Underperform
With each vessel capable of carrying roughly 2 million barrels of oil—enough to fill about 125 Olympic swimming pools—DHT Holdings (NYSE:DHT) operates very large crude carriers that transport crude oil across international routes for energy companies and traders.
- Annual sales declines of 7.6% for the past five years show its products and services struggled to connect with the market during this cycle
- Modest revenue base of $370.3 million gives it less fixed cost leverage and fewer distribution channels than larger companies
- The good news is that its healthy EBITDA margin shows it’s a well-run company with efficient processes, and its profitability grew over the last five years thanks to its successful cost optimization efforts


DHT Holdings doesn’t live up to our standards. There are better opportunities in the market.
Why There Are Better Opportunities Than DHT Holdings


At $17.99 per share, DHT Holdings trades at 9.1x forward P/E. DHT Holdings’s valuation may seem like a bargain, but we think there are valid reasons why it’s so cheap.
We’d rather pay up for companies with elite fundamentals than get a bargain on weak ones. Cheap stocks can be value traps, and as their performance deteriorates, they will stay cheap or get even cheaper.
3. DHT Holdings (DHT) Research Report: Q4 CY2025 Update
Crude oil tanker operator DHT Holdings (NYSE:DHT) reported Q4 CY2025 results beating Wall Street’s revenue expectations, with sales up 37.1% year on year to $118.1 million. Its non-GAAP profit of $0.41 per share was in line with analysts’ consensus estimates.
DHT Holdings (DHT) Q4 CY2025 Highlights:
- Revenue: $118.1 million vs analyst estimates of $116.1 million (37.1% year-on-year growth, 1.7% beat)
- Adjusted EPS: $0.41 vs analyst estimates of $0.40 (in line)
- Adjusted EBITDA: $95.3 million vs analyst estimates of $93.81 million (80.7% margin, 1.6% beat)
- Operating Margin: 57.9%, down from 70.7% in the same quarter last year
- Free Cash Flow was -$132.7 million, down from $52.79 million in the same quarter last year
- Market Capitalization: $2.86 billion
Company Overview
With each vessel capable of carrying roughly 2 million barrels of oil—enough to fill about 125 Olympic swimming pools—DHT Holdings (NYSE:DHT) operates very large crude carriers that transport crude oil across international routes for energy companies and traders.
The company's business centers on a fleet of very large crude carriers (VLCCs), specialized tankers ranging from 270,000 to 320,000 deadweight tons—making them among the largest ships afloat. These massive vessels are designed to transport crude oil in bulk from production regions to refineries around the world. For context, a single VLCC voyage might involve loading crude from a Middle Eastern export terminal and delivering it to a refinery in Asia or Europe, a journey that can take several weeks.
DHT Holdings generates revenue through two primary models. Some vessels operate in the spot market, where shipping rates fluctuate based on supply and demand dynamics—the company negotiates rates for individual voyages as opportunities arise. Other vessels are placed on time charters, where customers pay a fixed daily rate for a predetermined period, providing more predictable cash flow. The customers are typically major oil companies, trading houses, and refiners who need to move crude oil between continents.
The company oversees the technical management of its fleet through its subsidiary Goodwood, which handles the day-to-day operations including crewing, maintenance, repairs, and regulatory compliance. This in-house management approach gives DHT Holdings direct control over vessel safety standards, operational efficiency, and adherence to international maritime regulations set by bodies like the International Maritime Organization. The fleet operates globally with a presence in Monaco, Singapore, Norway, and India, positioning the company to serve major oil trading routes.
4. Infrastructure
Energy infrastructure companies build, own, and operate assets including pipelines, storage facilities, and processing plants that transport and handle oil, natural gas, and related products. These businesses often generate fee-based revenues providing cash flow stability. Tailwinds include growing production volumes requiring expanded takeaway capacity and export infrastructure demand. Long-term contracts with creditworthy counterparties reduce commodity price exposure. Headwinds include permitting and regulatory challenges delaying new projects, environmental opposition to pipeline construction, and potential long-term demand decline from energy transition. High capital intensity and interest rate sensitivity affecting financing costs present additional considerations.
DHT Holdings competes with other crude oil tanker operators including Frontline (NYSE:FRO), Euronav (merged with Frontline), International Seaways (NYSE:INSW), Nordic American Tankers (NYSE:NAT), and Teekay Tankers (NYSE:TNK).
5. Revenue Scale
In Energy, scale separates fragile single-asset producers from platform-style businesses that generate revenue across entire basins and infrastructure networks. DHT Holdings’s $370.3 million of revenue in the last year is pretty small for the industry, suggesting the company hasn’t hit a level of diversification where investors can sleep easy at night.
6. Revenue Growth
A company’s long-term performance can give signals about its business quality. Even a bad business, especially in a cyclical industry, can shine for a year or so, but a top-tier one should exhibit resilience through cycles. Over the last five years, DHT Holdings’s demand was weak and its revenue declined by 7.6% per year. This wasn’t a great result and is a sign of lacking business quality.
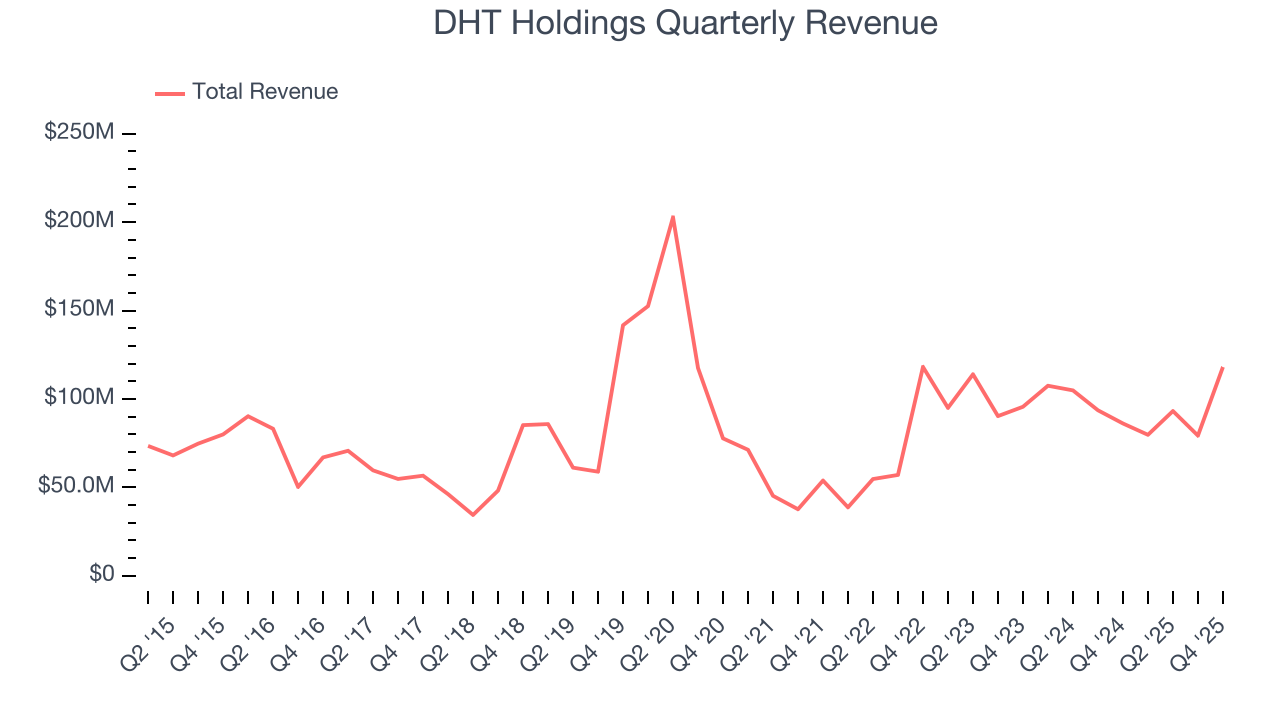
Within Energy, a singular timeframe, even if it’s quite long-term, only sheds light on how well a company rode the last commodity cycle. To better assess whether a company compounds through cycles, we validate our view with an even longer, ten-year view. DHT Holdings’s annualized revenue growth of 2.3% over the last ten years is above its five-year trend, suggesting some bright spots.
This quarter, DHT Holdings reported wonderful year-on-year revenue growth of 37.1%, and its $118.1 million of revenue exceeded Wall Street’s estimates by 1.7%.
7. Gross Margin
In a single quarter or year, gross margins in the sector can swing wildly due to commodity prices, hedging, or changes in labor costs. Over a multi-year period across different points in the cycle, gross margin differences can signal whether a company is a structurally-advantaged producer (“rock” quality, takeaway, operating costs) or not.
DHT Holdings, which averaged 30.9% gross margin over the last five years, exhibiting bottom-tier unit economics in the sector. It means the company will struggle at higher commodity prices than peers with better gross margins. 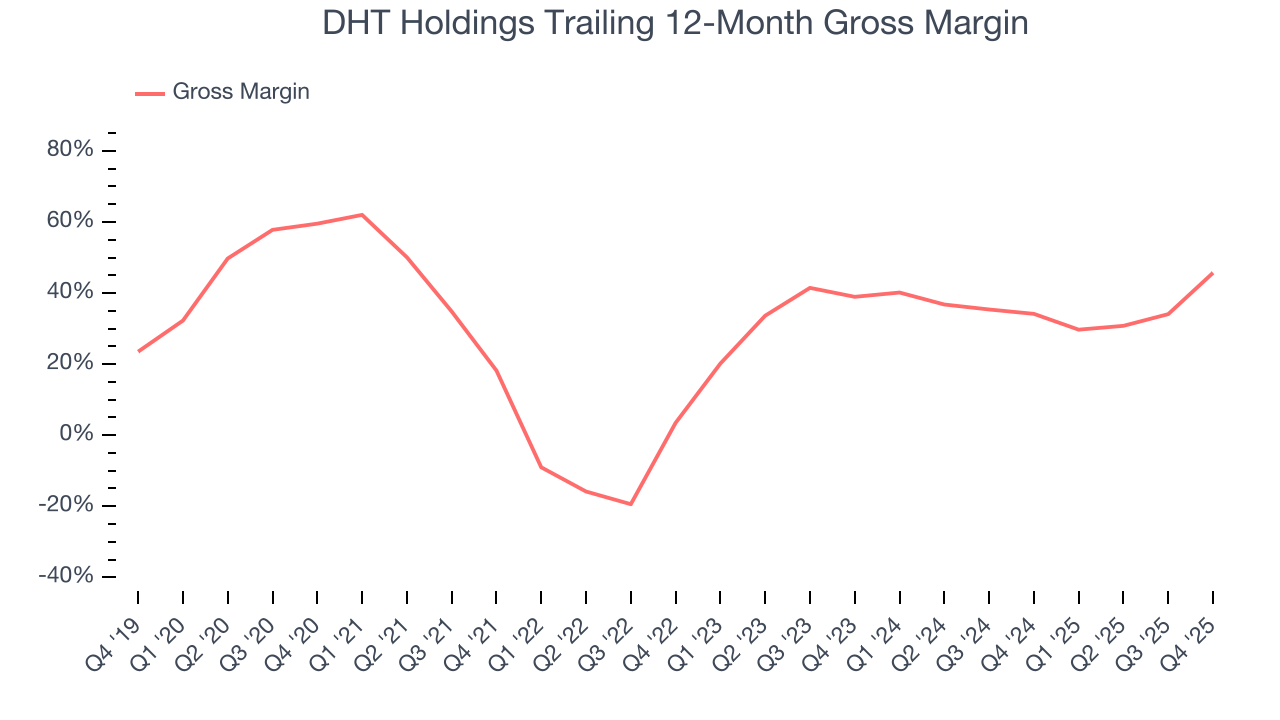
DHT Holdings produced a 63.4% gross profit margin in Q4 , marking a 39.1 percentage point increase from 24.3% in the same quarter last year. Note that energy margins can be volatile due to commodity price changes.
8. Adjusted EBITDA Margin
DHT Holdings has been a well-oiled machine over the last five years. It demonstrated elite profitability for an upstream and integrated energy business, boasting an average EBITDA margin of 71.4%.
Analyzing the trend in its profitability, DHT Holdings’s EBITDA margin rose by 20.6 percentage points over the last year, as its sales growth gave it immense operating leverage.
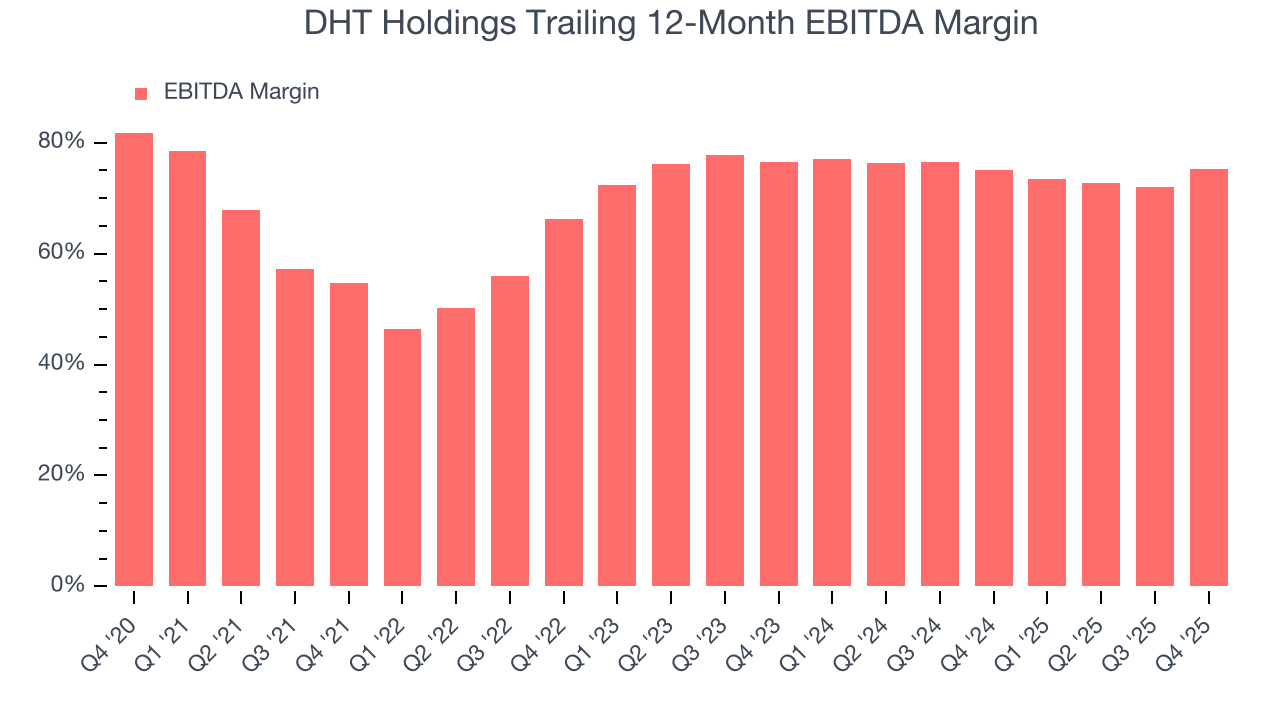
This quarter, DHT Holdings generated an EBITDA margin profit margin of 80.7%, up 10.4 percentage points year on year. This increase was a welcome development and shows it was more efficient. This adjusted EBITDA beat Wall Street’s estimates by 1.6%.
9. Cash Is King
Adjusted EBITDA shows how profitable a company’s existing “rock” is before financing and reinvestment, while free cash flow shows how much value remains after paying to replace those wells. Because production declines over time, strong EBITDA can coexist with weak FCF if drilling is expensive or declines are steep. FCF therefore captures both operating efficiency and the cost of sustaining production.
DHT Holdings has shown terrific cash profitability, enabling it to reinvest, return capital to investors, and stay ahead of the competition while maintaining an ample cushion. The company’s free cash flow margin was among the best in the energy upstream and integrated energy sector, averaging 18.1% over the last five years.
The level of free cash flow is important, but its durability across cycles is just as critical. Consistent margins are far more valuable than volatile swings driven by commodity prices.
DHT Holdings’s ratio of quarterly free cash flow volatility to WTI crude price volatility over the past five years was 24.5 (lower is better), indicating that its cash generation is far more sensitive to commodity-price swings than most peers. This elevated volatility limits its access to capital in downturns and makes it unlikely to act as a consolidator when weaker competitors come under pressure.
You may be asking why we wait until the free cash flow line to perform this stability analysis versus commodity prices. Why not compare revenue or EBITDA to WTI Crude prices in the case of DHT Holdings? Because what ultimately matters is not how much revenue or profit you earn when prices are high but how much cash you can generate when prices are low. Free cash flow is the superior metric because it includes everything from hedging prowess to growth and maintenance capex to management behavior during good times and bad.
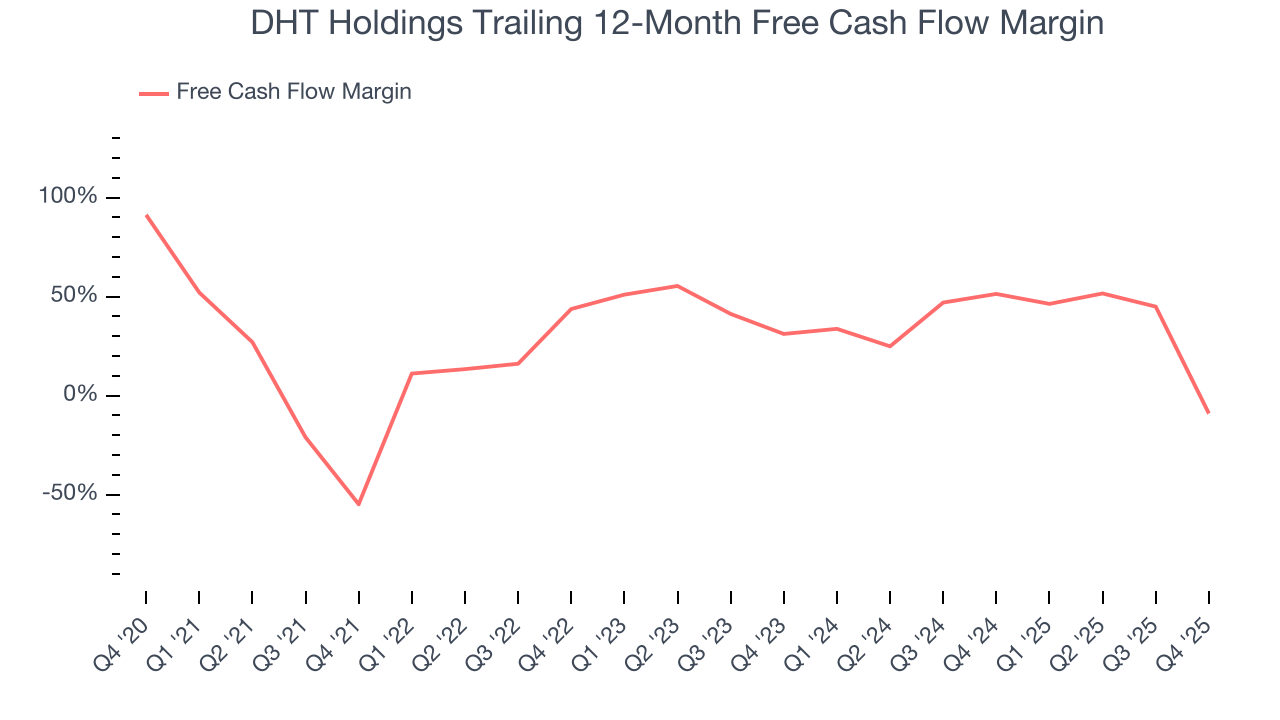
DHT Holdings burned through $132.7 million of cash in Q4, equivalent to a negative 112% margin. The company’s cash flow turned negative after being positive in the same quarter last year, prompting us to pay closer attention. Short-term fluctuations typically aren’t a big deal because investment needs can be seasonal, but we’ll be watching to see if the trend extrapolates into future quarters.
10. Return on Invested Capital (ROIC)
Free cash flow shows how much money a producer generated, while ROIC shows how efficiently that money was earned. ROIC measures the operating profit produced for each dollar of capital invested, whether from debt or equity. Cash generation measures quantity while ROIC measures the quality of value creation.
We at StockStory like to look at ROIC over a ten-year period because energy investment cycles can involve up to five years of ramping production and another five years of harvesting. A decade view captures buying, extracting, and monetizing rather than just part of that picture. DHT Holdings’s management team makes decent investment decisions and generates value for shareholders. Its nine-year average ROIC was 9.6%, slightly better than typical energy upstream and integrated energy business.
We like to invest in businesses with high returns, but the trend in a company’s ROIC is what often surprises the market and moves the stock price. DHT Holdings’s ROIC has increased significantly over the last few years. This is a good sign, and we hope the company can keep improving.
11. Balance Sheet Assessment
DHT Holdings reported $79.03 million of cash and $428.7 million of debt on its balance sheet in the most recent quarter. As investors in high-quality companies, we primarily focus on two things: 1) that a company’s debt level isn’t too high and 2) that its interest payments are not excessively burdening the business.
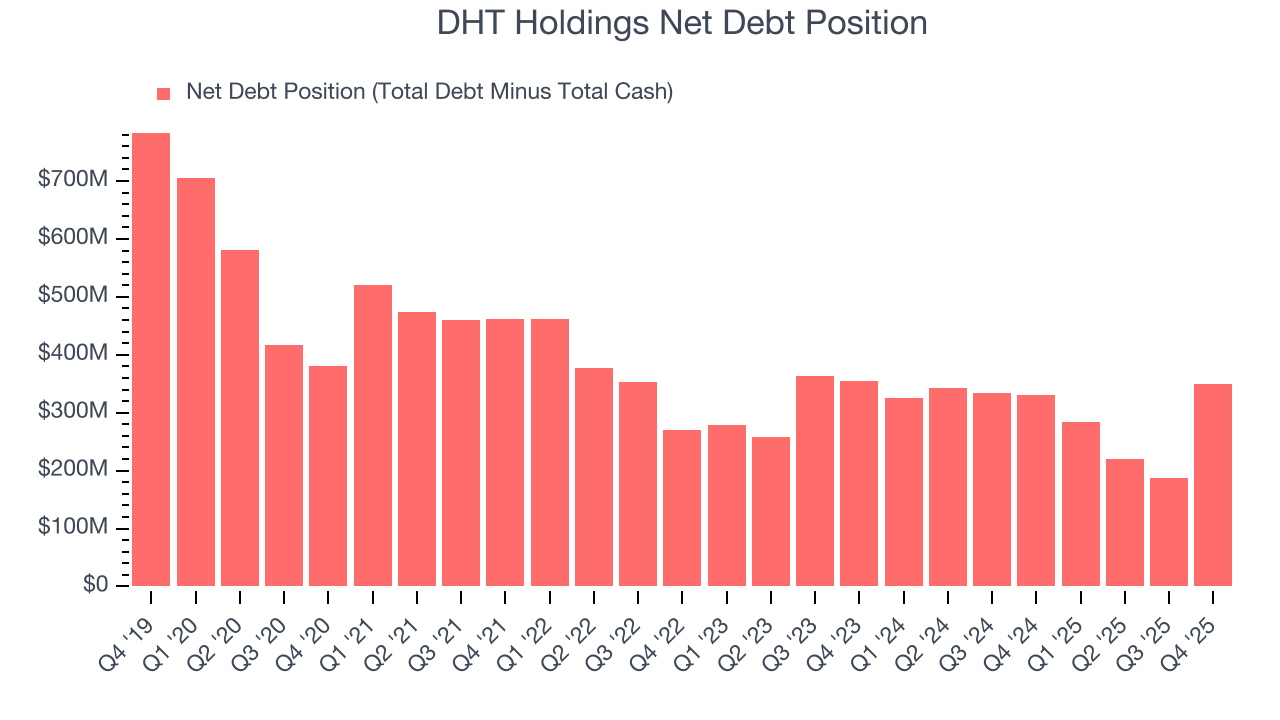
With $278.4 million of EBITDA over the last 12 months, we view DHT Holdings’s 1.3× net-debt-to-EBITDA ratio as safe. We also see its $10.23 million of annual interest expenses as appropriate. The company’s profits give it plenty of breathing room, allowing it to continue investing in growth initiatives.
12. Key Takeaways from DHT Holdings’s Q4 Results
It was encouraging to see DHT Holdings beat analysts’ revenue expectations this quarter. We were also happy its EBITDA outperformed Wall Street’s estimates. Overall, this print had some key positives. The stock traded up 4% to $18.48 immediately after reporting.
13. Is Now The Time To Buy DHT Holdings?
Updated: March 27, 2026 at 1:12 AM EDT
Before investing in or passing on DHT Holdings, we urge you to understand the company’s business quality (or lack thereof), valuation, and the latest quarterly results - in that order.
DHT Holdings isn’t a terrible business, but it doesn’t pass our quality test. To begin with, its revenue has declined over the last five years. While its impressive EBITDA margins show it has a highly efficient business model, the downside is its free cash flow volatility compared to commodity price volatility is bottom-tier in the sector, leading to highly volatile free cash flow. On top of that, its subscale operations hasn't hit a level of diversification where investors can sleep easy at night.
DHT Holdings’s P/E ratio based on the next 12 months is 9.1x. While this valuation is optically cheap, the potential downside is big given its shaky fundamentals. We're fairly confident there are better investments elsewhere.
Wall Street analysts have a consensus one-year price target of $19.44 on the company (compared to the current share price of $17.99).