Pediatrix Medical Group (MD)
Pediatrix Medical Group is in for a bumpy ride. Its sales have underperformed and its low returns on capital show it has few growth opportunities.― StockStory Analyst Team
1. News


2. Summary
Why We Think Pediatrix Medical Group Will Underperform
With a network of approximately 2,620 affiliated physicians caring for some of the most vulnerable patients, Pediatrix Medical Group (NYSE:MD) provides specialized physician services focused on neonatal, maternal-fetal, pediatric cardiology and other pediatric subspecialty care across 37 states.
- Products and services are facing significant end-market challenges during this cycle as sales have declined by 2.3% annually over the last two years
- Earnings growth underperformed the sector average over the last five years as its EPS grew by just 1.2% annually
- Demand will likely be soft over the next 12 months as Wall Street’s estimates imply tepid growth of 1.1%


Pediatrix Medical Group doesn’t meet our quality criteria. Better stocks can be found in the market.
Why There Are Better Opportunities Than Pediatrix Medical Group


At $22.47 per share, Pediatrix Medical Group trades at 10.1x forward P/E. This multiple is lower than most healthcare companies, but for good reason.
It’s better to pay up for high-quality businesses with higher long-term earnings potential rather than to buy lower-quality stocks because they appear cheap. These challenged businesses often don’t re-rate, a phenomenon known as a “value trap”.
3. Pediatrix Medical Group (MD) Research Report: Q4 CY2025 Update
Pediatric healthcare provider Pediatrix Medical Group (NYSE:MD) beat Wall Street’s revenue expectations in Q4 CY2025, but sales fell by 1.7% year on year to $493.8 million. Its non-GAAP profit of $0.50 per share was 7.1% below analysts’ consensus estimates.
Pediatrix Medical Group (MD) Q4 CY2025 Highlights:
- Revenue: $493.8 million vs analyst estimates of $487.3 million (1.7% year-on-year decline, 1.3% beat)
- Adjusted EPS: $0.50 vs analyst expectations of $0.54 (7.1% miss)
- Adjusted EBITDA: $65.85 million vs analyst estimates of $69.65 million (13.3% margin, 5.5% miss)
- EBITDA guidance for the upcoming financial year 2026 is $290 million at the midpoint, above analyst estimates of $282.7 million
- Operating Margin: 9.9%, up from 7.8% in the same quarter last year
- Same-Store Sales rose 4% year on year (8.7% in the same quarter last year)
- Market Capitalization: $1.85 billion
Company Overview
With a network of approximately 2,620 affiliated physicians caring for some of the most vulnerable patients, Pediatrix Medical Group (NYSE:MD) provides specialized physician services focused on neonatal, maternal-fetal, pediatric cardiology and other pediatric subspecialty care across 37 states.
Pediatrix operates through a network of affiliated physicians who primarily work in hospital settings, with neonatal intensive care units (NICUs) forming the core of their practice. The company's neonatologists provide round-the-clock care for premature and medically complex newborns, while maternal-fetal medicine specialists manage high-risk pregnancies. This coordinated approach creates a continuum of care from pregnancy through delivery and newborn treatment.
The company's business model centers on staffing and managing clinical activities within specific hospital-based units. When a hospital partners with Pediatrix, the company typically assumes responsibility for physician staffing, scheduling, and clinical management of specialized units like NICUs. For example, a hospital might contract with Pediatrix to ensure 24/7 neonatologist coverage in its NICU, providing immediate specialized care for any premature infant born at that facility.
Beyond neonatal and maternal care, Pediatrix has expanded into multiple pediatric subspecialties including cardiology, intensive care, hospital medicine, surgery, urology, ENT, and ophthalmology. The company also operates pediatric urgent care clinics and provides newborn hearing screening services, having screened over 795,000 babies in 2023 alone.
Pediatrix generates revenue primarily through billing patients and insurance companies for physician services. The company also receives administrative fees from hospital partners for services like medical directorships, which accounted for approximately 14% of net revenue in 2023. Hospital contracts typically run for one to three years with automatic renewal provisions.
The company maintains extensive clinical data systems, including its proprietary BabySteps Cloud platform, which enables documentation of patient care and supports clinical research initiatives. This research focus has allowed Pediatrix to develop evidence-based protocols that aim to improve patient outcomes while reducing healthcare costs.
4. Specialized Medical & Nursing Services
The skilled nursing services industry provides specialized care for patients requiring medical or rehabilitative support after hospital stays or for chronic conditions. These companies benefit from stable demand driven by an aging population and recurring revenue from Medicare, Medicaid, and private insurance. However, the industry faces challenges such as thin margins due to high labor costs and stringent regulatory requirements. Looking ahead, the industry is supported by tailwinds from an aging population, which means higher chronic disease prevalence. Advances in medical technology, including using AI to better predict, diagnose, and treat illnesses, may reduce hospital readmissions and improve outcomes. However, headwinds such as labor shortages, wage inflation, and potential government reimbursement cuts pose challenges. Adapting to value-based care models may further squeeze margins by requiring investments in training, technology, and compliance.
Pediatrix Medical Group competes with other physician services organizations like TeamHealth, Envision Healthcare, and Sound Physicians, as well as hospital-employed physician groups and academic medical centers that directly employ specialists in neonatal, maternal-fetal, and pediatric subspecialty care.
5. Revenue Scale
Larger companies benefit from economies of scale, where fixed costs like infrastructure, technology, and administration are spread over a higher volume of goods or services, reducing the cost per unit. Scale can also lead to bargaining power with suppliers, greater brand recognition, and more investment firepower. A virtuous cycle can ensue if a scaled company plays its cards right.
With just $1.91 billion in revenue over the past 12 months, Pediatrix Medical Group is a small company in an industry where scale matters. This makes it difficult to build trust with customers because healthcare is heavily regulated, complex, and resource-intensive.
6. Revenue Growth
A company’s long-term sales performance can indicate its overall quality. Any business can have short-term success, but a top-tier one grows for years. Over the last five years, Pediatrix Medical Group grew its sales at a tepid 2% compounded annual growth rate. This was below our standards and is a rough starting point for our analysis.
We at StockStory place the most emphasis on long-term growth, but within healthcare, a half-decade historical view may miss recent innovations or disruptive industry trends. Pediatrix Medical Group’s performance shows it grew in the past but relinquished its gains over the last two years, as its revenue fell by 2% annually. 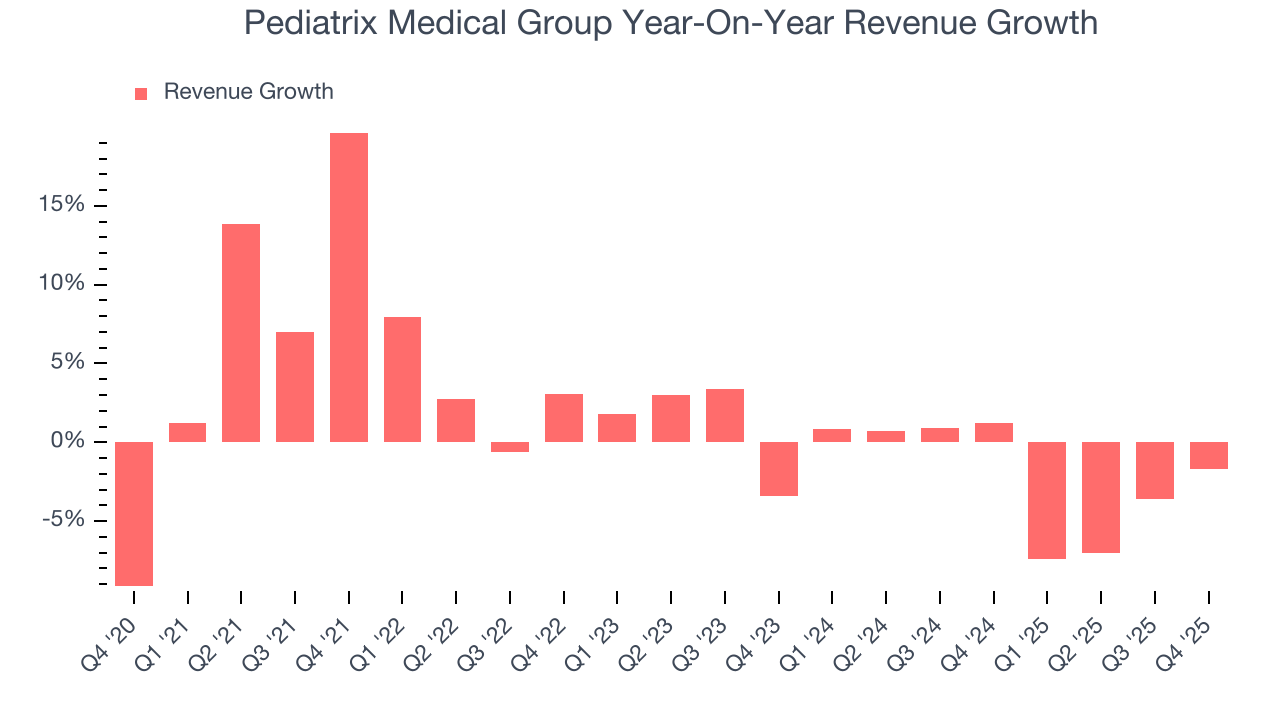
Pediatrix Medical Group also reports same-store sales, which show how much revenue its established locations generate. Over the last two years, Pediatrix Medical Group’s same-store sales averaged 5.5% year-on-year growth. Because this number is better than its revenue growth, we can see its sales from existing locations are performing better than its sales from new locations. 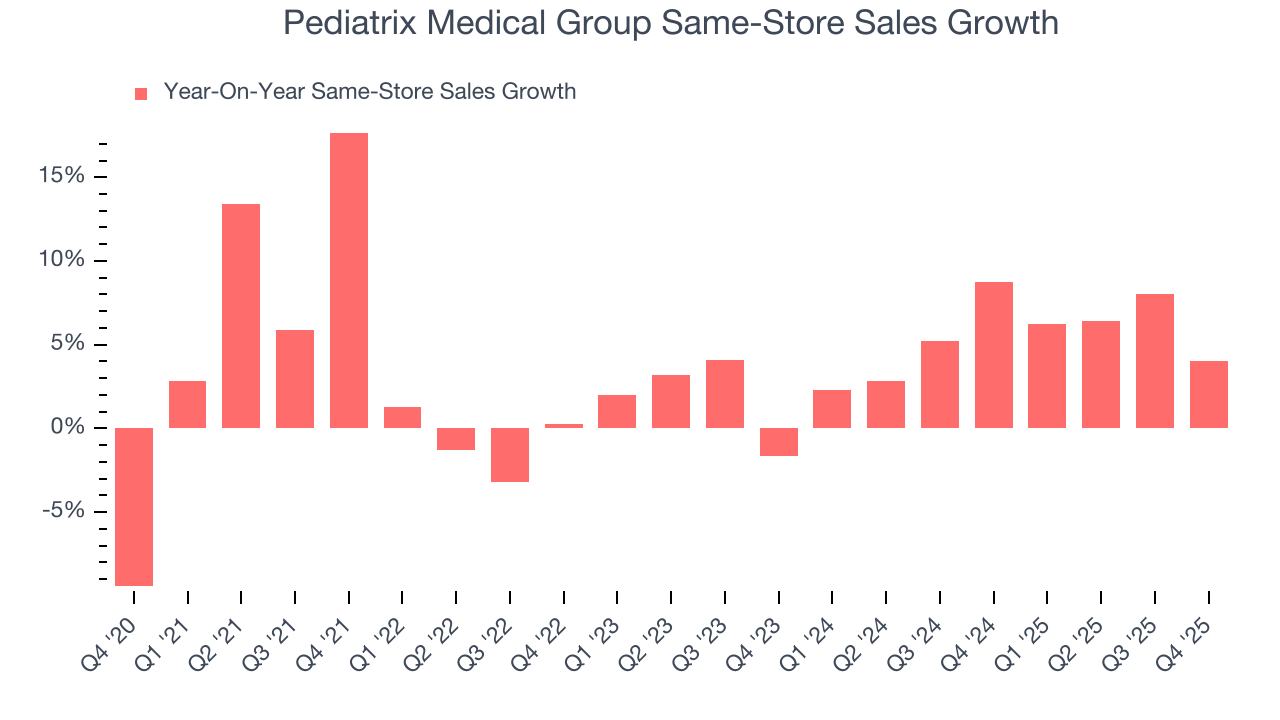
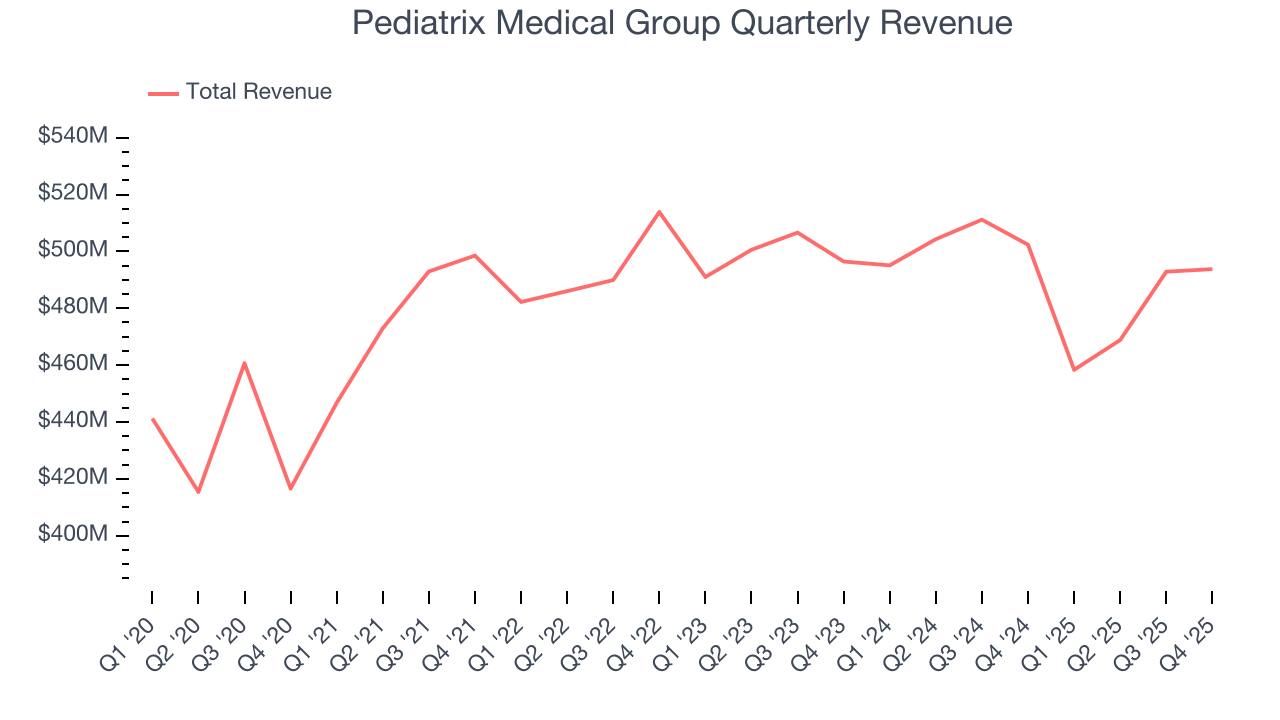
This quarter, Pediatrix Medical Group’s revenue fell by 1.7% year on year to $493.8 million but beat Wall Street’s estimates by 1.3%.
Looking ahead, sell-side analysts expect revenue to grow 2.2% over the next 12 months. While this projection suggests its newer products and services will catalyze better top-line performance, it is still below average for the sector.
7. Operating Margin
Pediatrix Medical Group’s operating margin has been trending up over the last 12 months and averaged 5.3% over the last five years. The company’s higher efficiency is a breath of fresh air, but its suboptimal cost structure means it still sports paltry profitability for a healthcare business.
Looking at the trend in its profitability, Pediatrix Medical Group’s operating margin of 10.9% for the trailing 12 months may be around the same as five years ago, but it has increased by 10.5 percentage points over the last two years.
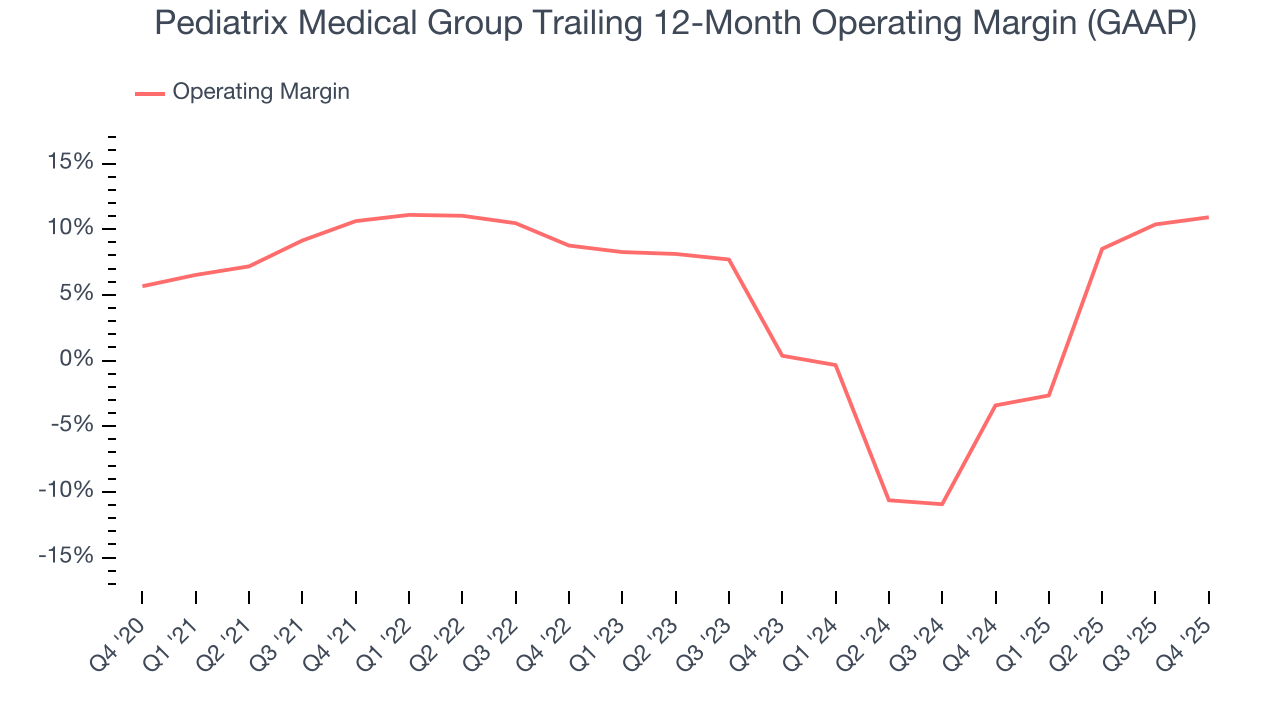
This quarter, Pediatrix Medical Group generated an operating margin profit margin of 9.9%, up 2.1 percentage points year on year. This increase was a welcome development, especially since its revenue fell, showing it was more efficient because it scaled down its expenses.
8. Earnings Per Share
We track the long-term change in earnings per share (EPS) for the same reason as long-term revenue growth. Compared to revenue, however, EPS highlights whether a company’s growth is profitable.
Pediatrix Medical Group’s EPS grew at a remarkable 10% compounded annual growth rate over the last five years, higher than its 2% annualized revenue growth. This tells us the company became more profitable on a per-share basis as it expanded.
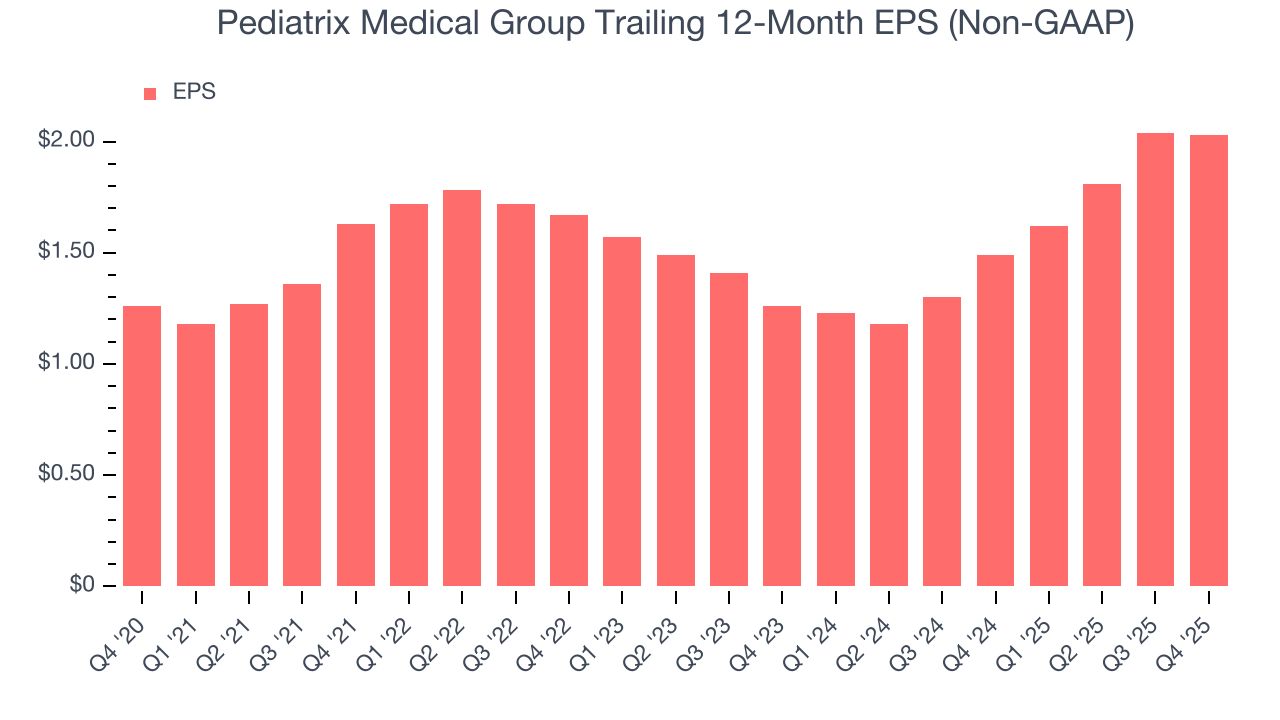
In Q4, Pediatrix Medical Group reported adjusted EPS of $0.50, down from $0.51 in the same quarter last year. This print missed analysts’ estimates, but we care more about long-term adjusted EPS growth than short-term movements. Over the next 12 months, Wall Street expects Pediatrix Medical Group’s full-year EPS of $2.03 to grow 8.8%.
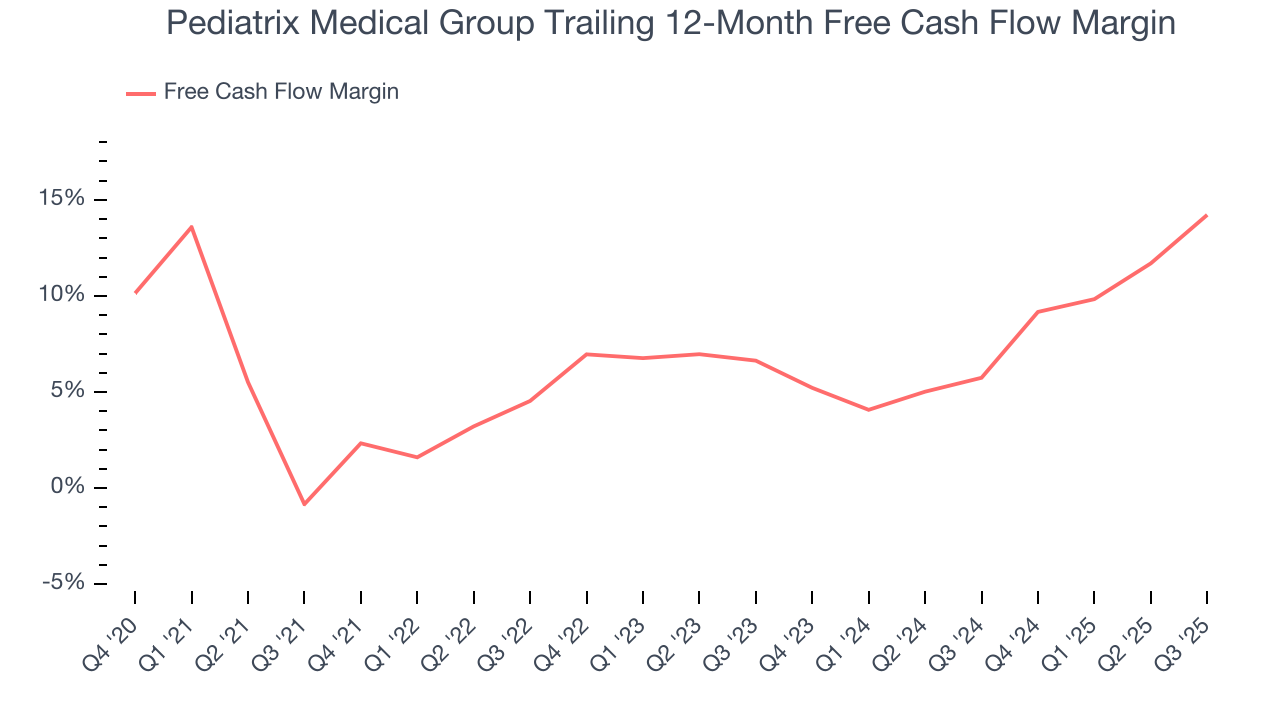
9. Cash Is King
Free cash flow isn't a prominently featured metric in company financials and earnings releases, but we think it's telling because it accounts for all operating and capital expenses, making it tough to manipulate. Cash is king.
Pediatrix Medical Group has shown decent cash profitability, giving it some flexibility to reinvest or return capital to investors. The company’s free cash flow margin averaged 6.6% over the last five years, slightly better than the broader healthcare sector.
Taking a step back, we can see that Pediatrix Medical Group’s margin expanded by 9.9 percentage points during that time. This is encouraging, and we can see it became a less capital-intensive business because its free cash flow profitability rose while its operating profitability was flat.
10. Return on Invested Capital (ROIC)
EPS and free cash flow tell us whether a company was profitable while growing its revenue. But was it capital-efficient? A company’s ROIC explains this by showing how much operating profit it makes compared to the money it has raised (debt and equity).
Pediatrix Medical Group historically did a mediocre job investing in profitable growth initiatives. Its five-year average ROIC was 6%, somewhat low compared to the best healthcare companies that consistently pump out 20%+.
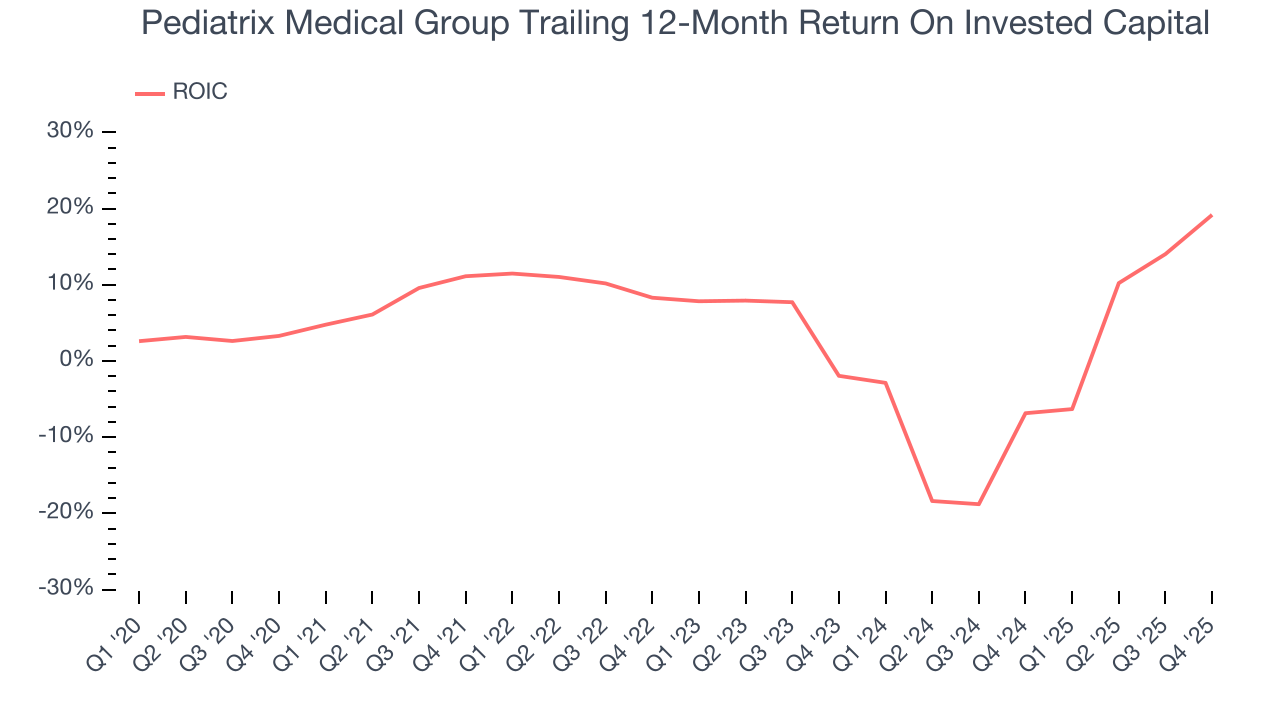
We like to invest in businesses with high returns, but the trend in a company’s ROIC is what often surprises the market and moves the stock price. Over the last few years, Pediatrix Medical Group’s ROIC averaged 3.6 percentage point decreases each year. Paired with its already low returns, these declines suggest its profitable growth opportunities are few and far between.
11. Balance Sheet Assessment
Pediatrix Medical Group reported $499.7 million of cash and $634.6 million of debt on its balance sheet in the most recent quarter. As investors in high-quality companies, we primarily focus on two things: 1) that a company’s debt level isn’t too high and 2) that its interest payments are not excessively burdening the business.
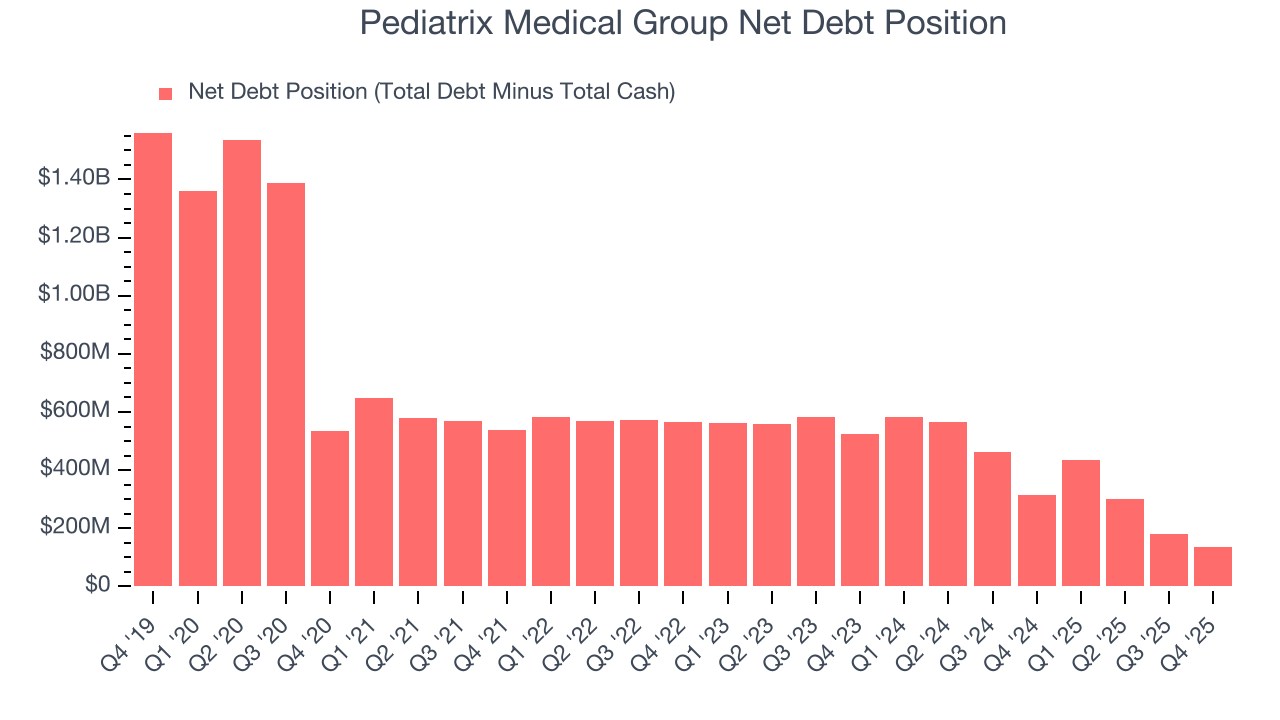
With $275.6 million of EBITDA over the last 12 months, we view Pediatrix Medical Group’s 0.5× net-debt-to-EBITDA ratio as safe. We also see its $4.14 million of annual interest expenses as appropriate. The company’s profits give it plenty of breathing room, allowing it to continue investing in growth initiatives.
12. Key Takeaways from Pediatrix Medical Group’s Q4 Results
It was good to see Pediatrix Medical Group narrowly top analysts’ revenue expectations this quarter. We were also glad its full-year EBITDA guidance exceeded Wall Street’s estimates. On the other hand, its EPS missed. Overall, this quarter was mixed. The stock traded up 2.1% to $22.44 immediately after reporting.
13. Is Now The Time To Buy Pediatrix Medical Group?
Updated: February 19, 2026 at 6:30 AM EST
A common mistake we notice when investors are deciding whether to buy a stock or not is that they simply look at the latest earnings results. Business quality and valuation matter more, so we urge you to understand these dynamics as well.
Pediatrix Medical Group isn’t a terrible business, but it doesn’t pass our quality test. To begin with, its revenue growth was uninspiring over the last five years, and analysts don’t see anything changing over the next 12 months. While its rising cash profitability gives it more optionality, the downside is its subscale operations give it fewer distribution channels than its larger rivals. On top of that, its operating margins are low compared to other healthcare companies.
Pediatrix Medical Group’s P/E ratio based on the next 12 months is 10x. While this valuation is optically cheap, the potential downside is big given its shaky fundamentals. We're pretty confident there are more exciting stocks to buy at the moment.
Wall Street analysts have a consensus one-year price target of $22.67 on the company (compared to the current share price of $22.44).