
Cactus (WHD)
Cactus is intriguing. Its exceptional revenue growth and returns on capital show it can expand quickly and profitably.― StockStory Analyst Team
1. News


2. Summary
Why Cactus Is Interesting
Named for the spiky wellhead equipment that reminded founders of desert cacti, Cactus (NYSE:WHD) manufactures wellheads, valves, and spoolable pipes used in drilling and producing oil and gas wells.
- Impressive 24.1% annual revenue growth over the last nine years indicates it’s winning market share this cycle
- Strong free cash flow margin of 21% gives it the option to reinvest, repurchase shares, or pay dividends
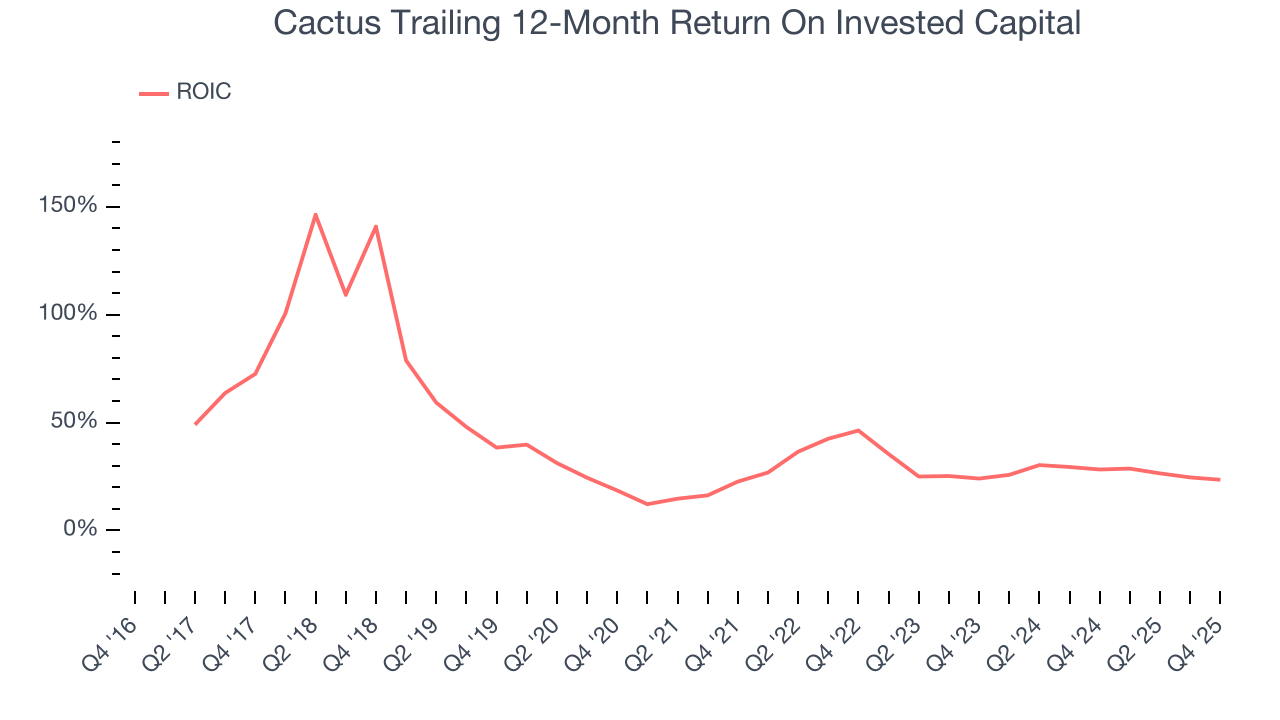
- On a dimmer note, its returns on capital are slipping, signaling its current investments aren’t as profitable as prior ones


Cactus has some respectable qualities. If you like the company, the price seems fair.
Why Is Now The Time To Buy Cactus?


Cactus’s stock price of $48.61 implies a valuation ratio of 18x forward P/E. Many energy upstream and integrated energy companies may feature a higher valuation multiple, but that doesn’t make Cactus a great deal. We think the current multiple fairly reflects the revenue characteristics.
Now could be a good time to invest if you believe in the story.
3. Cactus (WHD) Research Report: Q4 CY2025 Update
Oilfield equipment manufacturer Cactus (NYSE:WHD) beat Wall Street’s revenue expectations in Q4 CY2025, but sales fell by 4% year on year to $261.2 million. Its non-GAAP profit of $0.65 per share was 12.3% above analysts’ consensus estimates.
Cactus (WHD) Q4 CY2025 Highlights:
- Revenue: $261.2 million vs analyst estimates of $252.6 million (4% year-on-year decline, 3.4% beat)
- Adjusted EPS: $0.65 vs analyst estimates of $0.58 (12.3% beat)
- Adjusted EBITDA: $85.49 million vs analyst estimates of $78.52 million (32.7% margin, 8.9% beat)
- Operating Margin: 22.9%, down from 25.9% in the same quarter last year
- Free Cash Flow Margin: 25.2%, up from 20% in the same quarter last year
- Market Capitalization: $3.45 billion
Company Overview
Named for the spiky wellhead equipment that reminded founders of desert cacti, Cactus (NYSE:WHD) manufactures wellheads, valves, and spoolable pipes used in drilling and producing oil and gas wells.
The company operates through two main segments. Its Pressure Control business produces wellhead systems and pressure control equipment sold under the Cactus Wellhead brand. These products serve as the critical interface between the well and surface equipment, controlling pressure during drilling, completion, and production. Every new well drilled requires a wellhead, and after hydraulic fracturing, a production tree to manage flow. For example, when an operator drills a horizontal shale well in the Permian Basin, Cactus provides the wellhead assembly that gets installed first, then rents a frac tree during the completion phase when high-pressure fluids fracture the rock, and finally supplies the production tree that regulates oil and gas flow throughout the well's producing life.
The Spoolable Technologies segment manufactures flexible steel pipe under the FlexSteel brand. Unlike traditional rigid steel pipeline that requires welding joints together, spoolable pipe comes on large reels and can be unspooled continuously across terrain, reducing installation time and labor. Oil and gas operators use these pipes as gathering lines to transport production from wellheads to processing facilities or larger transmission pipelines. This is particularly useful in areas where wells are spread across difficult terrain or where operators want to bring new wells online quickly.
Cactus generates revenue from product sales, equipment rentals, and field services. Product sales account for the majority of revenue and include wellheads, production trees, and spoolable pipe. Rental revenue comes primarily from frac trees and installation tools, while field services cover installation, maintenance, and equipment handling. The company serves over 300 customers, from independent operators to major oil companies, primarily in U.S. shale basins, with additional operations in Canada, Australia, and the Middle East.
4. U.S. Shale E&P
US shale oil producers extract crude from tight rock formations using horizontal drilling and hydraulic fracturing (fracking) techniques, primarily in basins like the Permian, Bakken, and Eagle Ford. Tailwinds include short-cycle investment flexibility allowing rapid production adjustments, technological improvements enhancing well productivity, and proximity to refining and export infrastructure. Capital discipline has improved financial returns. Headwinds include commodity price sensitivity affecting drilling economics, accelerating well decline rates requiring continuous capital investment, and increasing regulatory and ESG scrutiny. Water usage, induced seismicity concerns, and evolving environmental regulations present ongoing operational challenges.
In pressure control, Cactus competes with Vault, divisions of SLB (NYSE:SLB) and TechnipFMC (NYSE:FTI). In spoolable technologies, competitors include Baker Hughes (NASDAQ:BKR), NOV (NYSE:NOV), and traditional steel pipe manufacturers like Tenaris (NYSE:TS).
5. Revenue Scale
The size of the revenue base is a way to assess topline, and it tells an investor whether an Energy producer has crossed the line between being a more vulnerable commodity taker and a durable operating platform. Scaled businesses tend to produce and generate revenue from many wells, pads, takeaway routes, and geographies, not just a single field or drilling program. Cactus’s $1.08 billion of revenue in the last year is pretty small for the industry, suggesting the company hasn’t hit a level of diversification where investors can sleep easy at night. is a small company in an industry where scale matters.
6. Revenue Growth
Cyclical sectors like Energy often flatter weaker operators during favorable price environments, but a longer-term lens separates those from businesses that can consistently perform across market cycles. Luckily, Cactus’s sales grew at an incredible 25.4% compounded annual growth rate over the last five years. Its growth beat the average energy upstream and integrated energy company and shows its offerings resonate with customers, a helpful starting point for our analysis.
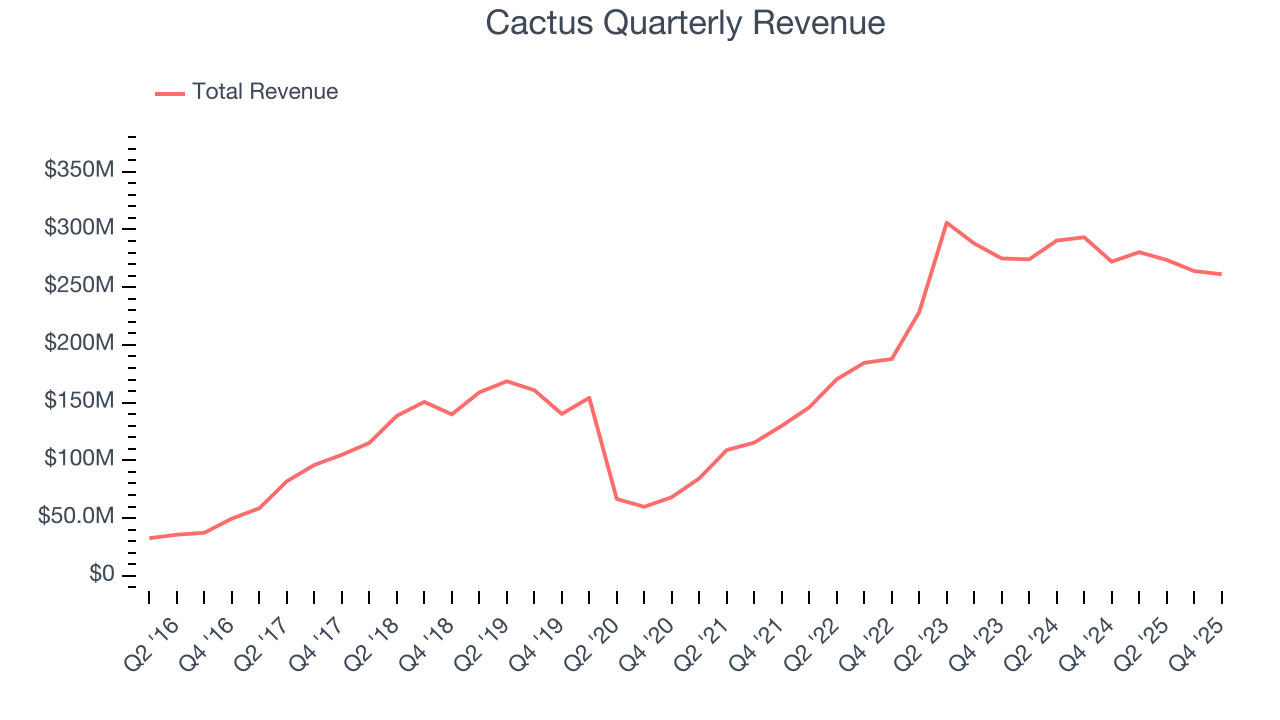
Even a long stretch in Energy can be shaped by a single commodity cycle, so extending the view to ten years adds another perspective and reveals which companies are built to grow regardless of the pricing regime. Cactus’s annualized revenue growth of 24.1% over the last nine years is below its five-year trend, but we still think the results suggest decent demand.
While looking at revenue is important, it can also introduce noise around commodity prices and M&A. Analyzing production, on the other hand, highlights what is happening inside the asset base and whether the economic footprint of a company is expanding. Over the last two years, Cactus’s total oil volume per day - Upstream averaged 2.5% year-on-year declines. while natural gas volume per day - Upstream averaged 2.5% year-on-year declines.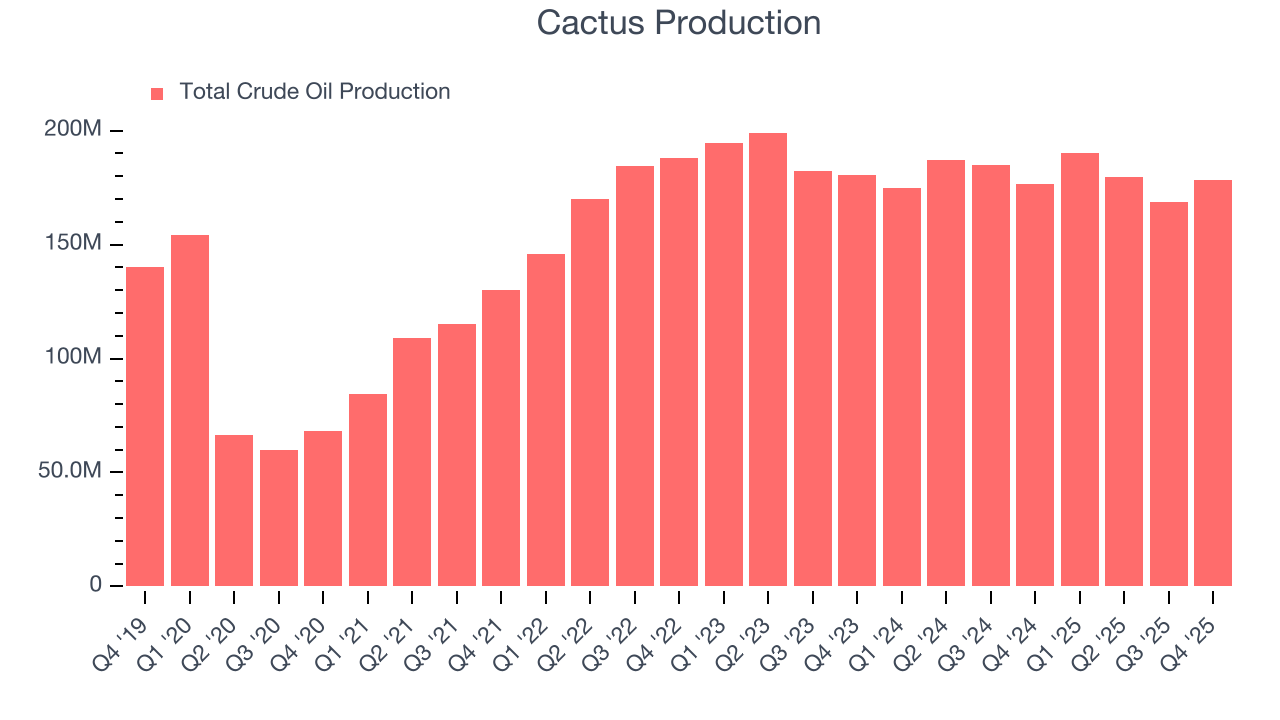
This quarter, Cactus’s revenue fell by 4% year on year to $261.2 million but beat Wall Street’s estimates by 3.4%. This quarter, Cactus’s 178,428 Mboe (thousand barrels of oil equivalent) of production was flat year on year but beat Wall Street’s estimates by 6.5%.
7. Gross Margin
While energy gross margins can be distorted by commodity prices, hedging, and short-term cost swings, sustained margins across a full cycle reflect a producer’s underlying asset quality, infrastructure position, and cost structure.
Cactus, which averaged 36.2% gross margin over the last five years, exhibits poor unit economics in the sector. It means the company will struggle more at lower commodity prices than peers with better gross margins. 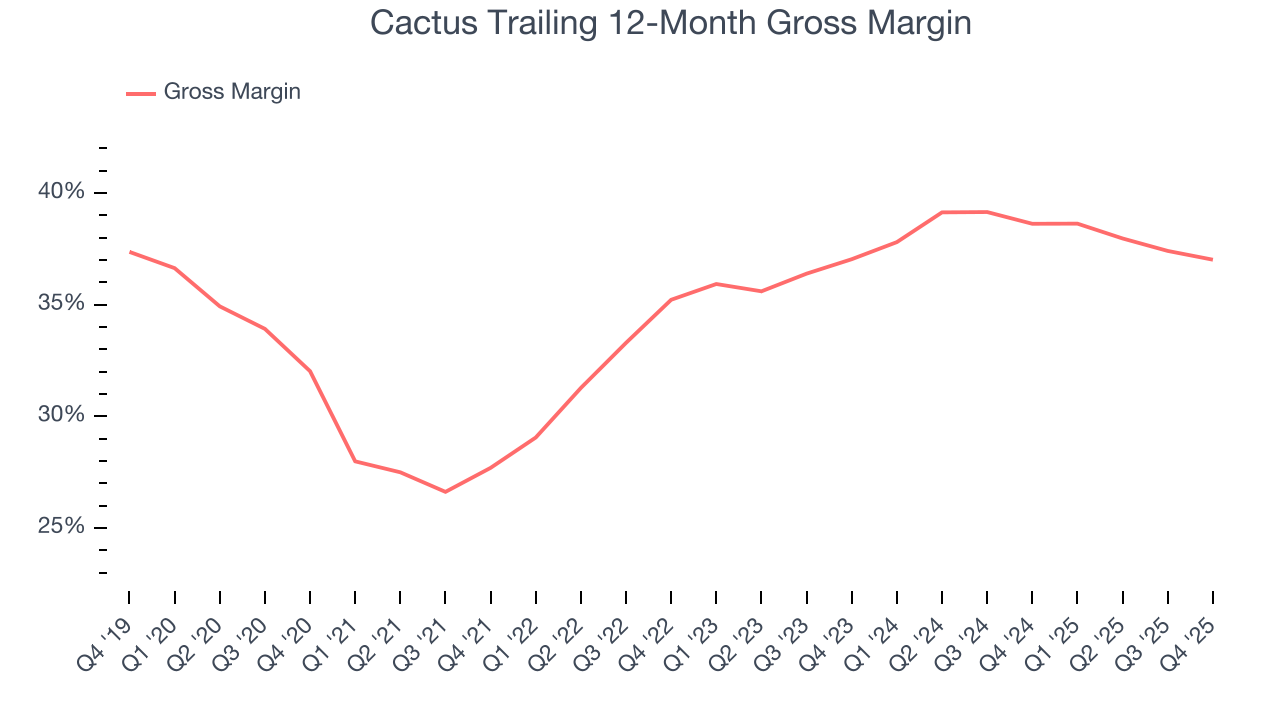
Cactus’s gross profit margin came in at 36.2% this quarter, down 1.6 percentage points year on year.
8. Adjusted EBITDA Margin
Cactus has done a decent job managing its cost base over the last five years. The company has produced an average EBITDA margin of 33.6%, higher than the broader energy upstream and integrated energy sector.
Analyzing the trend in its profitability, Cactus’s EBITDA margin rose by 5.3 percentage points over the last year, as its sales growth gave it operating leverage.
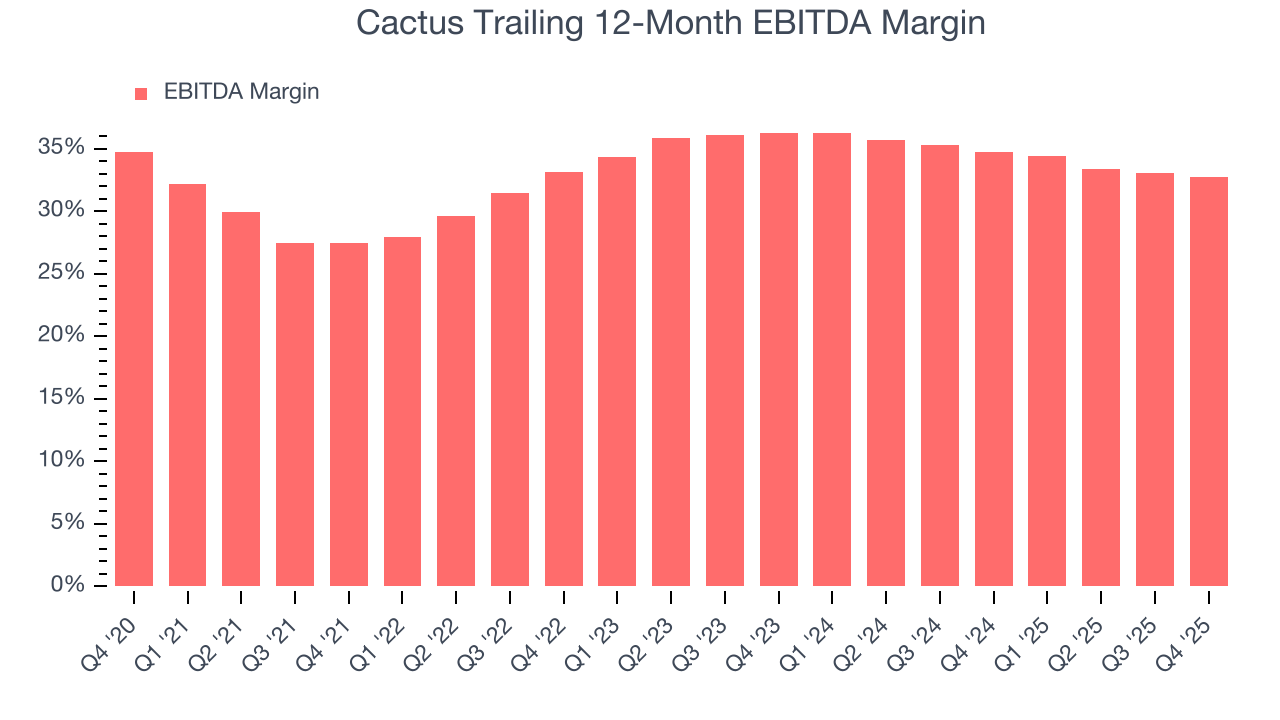
This quarter, Cactus generated an EBITDA margin profit margin of 32.7%, down 1.3 percentage points year on year. This reduction is quite minuscule and indicates the company’s overall cost structure has been relatively stable. This adjusted EBITDA beat Wall Street’s estimates by 8.9%.
9. Cash Is King
Adjusted EBITDA shows how profitable a company’s existing wells are before financing and reinvestment decisions, but free cash flow shows how much value remains after paying the cost of replacing those wells. In upstream energy, production naturally declines over time, so companies must continuously reinvest just to stand still. A producer can report strong EBITDA margins yet generate little or no free cash flow if its wells decline quickly or if new drilling is expensive. Free cash flow therefore captures not only how efficiently a company produces hydrocarbons today, but also how costly it is to sustain that production into the future.
Cactus has shown terrific cash profitability, enabling it to reinvest, return capital to investors, and stay ahead of the competition while maintaining an ample cushion. The company’s free cash flow margin was among the best in the energy upstream and integrated energy sector, averaging 21% over the last five years.
Absolute FCF margin levels matter but so does stability of free cash flow. All else equal, we’d prefer a 25.0% average free cash flow margin that is quite steady no matter how commodity prices behave rather than extremely high margins when times are good and negative ones when they’re tough.
Cactus’s ratio of quarterly free cash flow volatility to WTI crude price volatility over the past five years was 3.9 (lower is better), indicating excellent insulation from commodity swings. This stability supports superior capital access in downturns and positions Cactus to act as a consolidator when weaker peers are forced to retrench.
You may be asking why we wait until the free cash flow line to perform this stability analysis versus commodity prices. Why not compare revenue or EBITDA to WTI in the case of Cactus? Because what ultimately matters is not how much revenue or profit you earn when prices are high but how much cash you can generate when prices are low. Free cash flow is the superior metric because it includes everything from hedging prowess to growth and maintenance capex to management behavior during good times and bad.
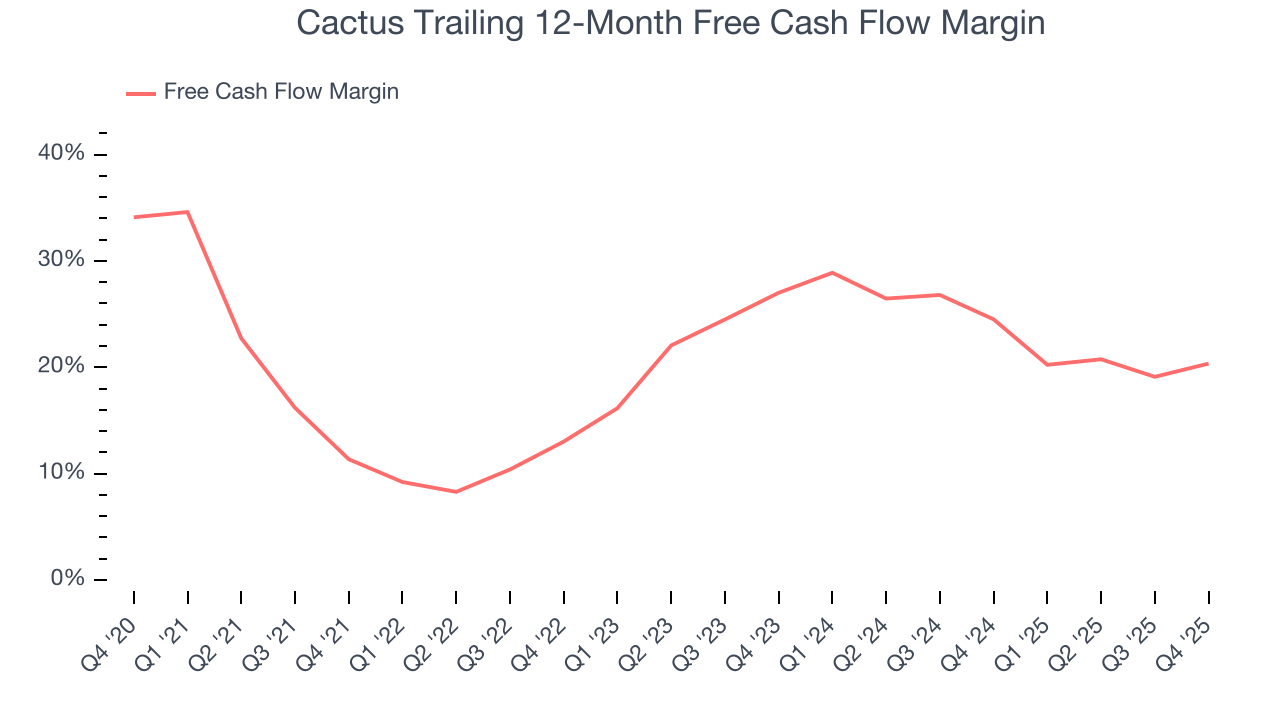
Cactus’s free cash flow clocked in at $65.82 million in Q4, equivalent to a 25.2% margin. This result was good as its margin was 5.2 percentage points higher than in the same quarter last year, building on its favorable historical trend.
10. Return on Invested Capital (ROIC)
Free cash flow shows how much money a producer generated, while ROIC shows how efficiently that money was earned. ROIC measures the operating profit produced for each dollar of capital invested, whether from debt or equity. Cash generation measures quantity while ROIC measures the quality of value creation.
We at StockStory like to look at ROIC over a ten-year period because energy investment cycles can involve up to five years of ramping production and another five years of harvesting. A decade view captures buying, extracting, and monetizing rather than just part of that picture. Cactus’s nine-year average ROIC was 34.3%, placing it among the best energy upstream and integrated energy companies. This illustrates its management team’s ability to invest in highly profitable ventures and produce tangible results for shareholders.
 Note: Quarters not shown were determined to be outliers, impacted by outsized investment gains/losses that are not indicative of the recurring fundamentals of the business.
We like to invest in businesses with high returns, but the trend in a company’s ROIC is what often surprises the market and moves the stock price. Over the last few years, Cactus’s ROIC has unfortunately decreased. Only time will tell if its new bets can bear fruit and potentially reverse the trend.
11. Balance Sheet Assessment
Companies with more cash than debt have lower bankruptcy risk.
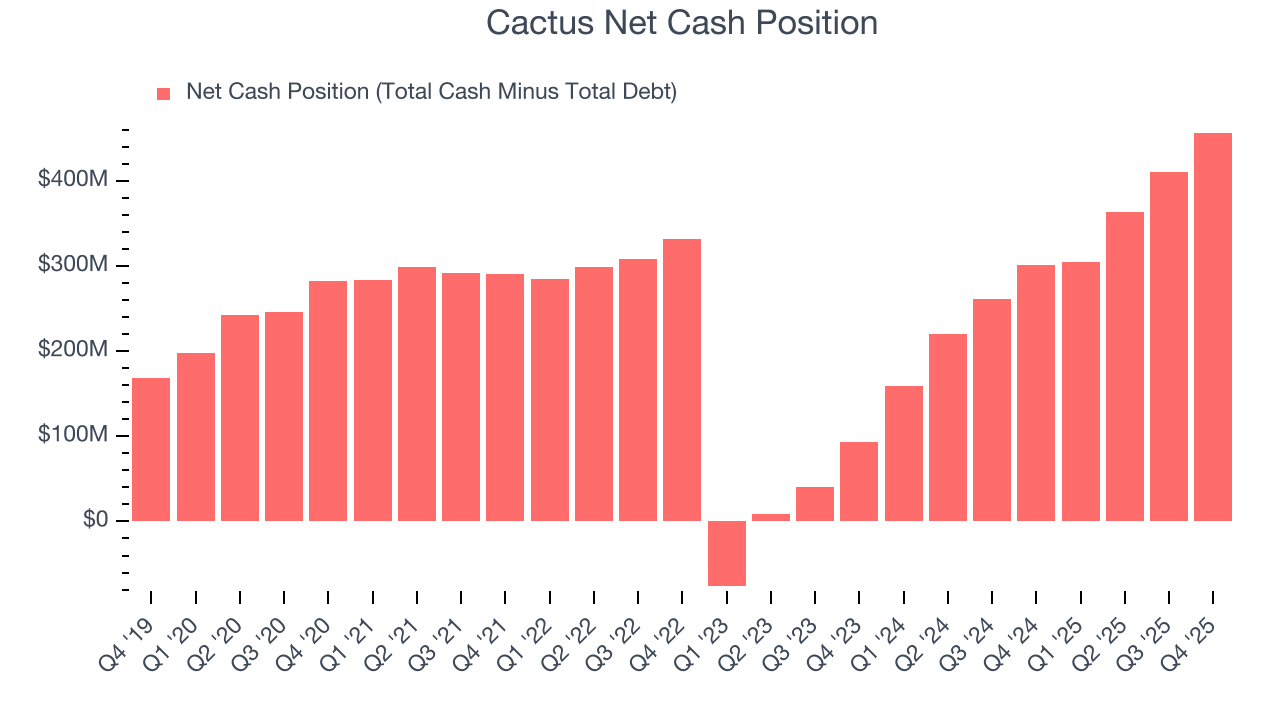
Cactus is a profitable, well-capitalized company with $494.6 million of cash and $37.75 million of debt on its balance sheet. This $456.8 million net cash position is 13.3% of its market cap and gives it the freedom to borrow money, return capital to shareholders, or invest in growth initiatives. Leverage is not an issue here.
12. Key Takeaways from Cactus’s Q4 Results
We were impressed by how significantly Cactus blew past analysts’ production expectations this quarter. We were also glad its revenue outperformed Wall Street’s estimates. Zooming out, we think this quarter featured some important positives. The market seemed to be hoping for more, and the stock traded down 1% to $49.49 immediately following the results.
13. Is Now The Time To Buy Cactus?
Updated: March 11, 2026 at 1:01 AM EDT
Before deciding whether to buy Cactus or pass, we urge investors to consider business quality, valuation, and the latest quarterly results.
For starters, its revenue growth over the last five years was top-tier for the sector and is expected to accelerate over the next 12 months. And while its diminishing returns show management's recent bets still have yet to bear fruit, its revenue growth over the last nine years was top-tier for the sector. On top of that, Cactus’s powerful free cash flow generation enables it to stay ahead of the competition through consistent reinvestment of profits.
Cactus’s P/E ratio based on the next 12 months is 18x. Looking at the energy upstream and integrated energy space right now, Cactus trades at a compelling valuation. If you’re a fan of the business and management team, now is a good time to scoop up some shares.
Wall Street analysts have a consensus one-year price target of $56.56 on the company (compared to the current share price of $48.61), implying they see 16.3% upside in buying Cactus in the short term.