Xylem (XYL)
Xylem is interesting. Its combination of extraordinary growth and outstanding unit economics makes it a unique asset.― StockStory Analyst Team
1. News


2. Summary
Why Xylem Is Interesting
Formed through a spinoff, Xylem (NYSE:XYL) manufactures and services engineered products across a wide variety of applications primarily in the water sector.
- Earnings growth has massively outpaced its peers over the last five years as its EPS has compounded at 17.7% annually
- Market share has increased this cycle as its 12.8% annual revenue growth over the last five years was exceptional
- On the flip side, its estimated sales growth of 3.9% for the next 12 months implies demand will slow from its two-year trend


Xylem shows some promise. If you like the story, the price seems fair.
Why Is Now The Time To Buy Xylem?


At $141.26 per share, Xylem trades at 26.3x forward P/E. Looking at the industrials space, we think the multiple is fair for the revenue growth characteristics.
If you think the market is undervaluing the company, now could be a good time to build a position.
3. Xylem (XYL) Research Report: Q3 CY2025 Update
Water technology company Xylem (NYSE:XYL) announced better-than-expected revenue in Q3 CY2025, with sales up 7.8% year on year to $2.27 billion. The company’s full-year revenue guidance of $9 billion at the midpoint came in 0.5% above analysts’ estimates. Its non-GAAP profit of $1.37 per share was 11.1% above analysts’ consensus estimates.
Xylem (XYL) Q3 CY2025 Highlights:
- Revenue: $2.27 billion vs analyst estimates of $2.23 billion (7.8% year-on-year growth, 1.9% beat)
- Adjusted EPS: $1.37 vs analyst estimates of $1.23 (11.1% beat)
- Adjusted EBITDA: $527 million vs analyst estimates of $491.2 million (23.2% margin, 7.3% beat)
- The company slightly lifted its revenue guidance for the full year to $9 billion at the midpoint from $8.95 billion
- Management raised its full-year Adjusted EPS guidance to $5.06 at the midpoint, a 5.9% increase
- Operating Margin: 14.7%, up from 13.3% in the same quarter last year
- Free Cash Flow Margin: 12.4%, up from 11.3% in the same quarter last year
- Organic Revenue rose 7% year on year vs analyst estimates of 5% growth (201.5 basis point beat)
- Market Capitalization: $36.37 billion
Company Overview
Formed through a spinoff, Xylem (NYSE:XYL) manufactures and services engineered products across a wide variety of applications primarily in the water sector.
Xylem was established in 2011 when it was spun off from ITT Corporation, which had been a diversified manufacturer of critical components for the energy, transportation, and industrial markets. Named after the tissue in plants that transports water, Xylem was formed to focus specifically on the technology and equipment for water solutions and services. Over the years, the company has expanded its portfolio and global footprint through strategic acquisitions, including the notable purchase of Evoqua, which significantly enhanced its range of water treatment products and services.
Xylem plays a critical role in addressing the growing demands and challenges of water scarcity, quality, and affordability through solutions that span the entire water cycle, from the supply and treatment of drinking water to wastewater collection, and return to the environment. Xylem's offerings include transport, treatment, smart metering, digital software solutions, and infrastructure assessment services. These are directed towards a customer base that includes water and wastewater utilities, EPC firms, and third-party contractors involved in the design and construction of water infrastructure networks. For instance, an energy company might use Xylem’s remote monitoring and leak detection systems to quickly identify and solve any issues that may arise.
Xylem generates revenue through the sale of its water technology products and services. The company revenue streams also include recurring revenue from short-term deionization and maintenance contracts, as well as, long-term contracts such as build-own-operate agreements. Additionally Xylem has focused on increasing users on its digital platforms providing another source of recurring revenue. The company utilizes an acquisition strategy of acquiring high quality companies that will significantly increase operational value. This is exemplified by its acquisition of Sensus for $1.7 billion for its FlexNet communications network technology and its acquisition of Evoqua for $7.5 billion in 2023.
4. Water Infrastructure
Trends towards conservation and reducing groundwater depletion are putting water infrastructure and treatment products front and center. Companies that can innovate and create solutions–especially automated or connected solutions–to address these thematic trends will create incremental demand and speed up replacement cycles. On the other hand, water infrastructure and treatment companies are at the whim of economic cycles. Consumer spending and interest rates, for example, can greatly impact the industrial production that drives demand for these companies’ offerings.
Competitors offering similar products include Sulzer (SWX:SUN), Veolia (EPA:VIE), and Graco (NYSE:GGG).
5. Revenue Growth
A company’s long-term sales performance can indicate its overall quality. Even a bad business can shine for one or two quarters, but a top-tier one grows for years. Over the last five years, Xylem grew its sales at an excellent 12.8% compounded annual growth rate. Its growth beat the average industrials company and shows its offerings resonate with customers, a helpful starting point for our analysis.
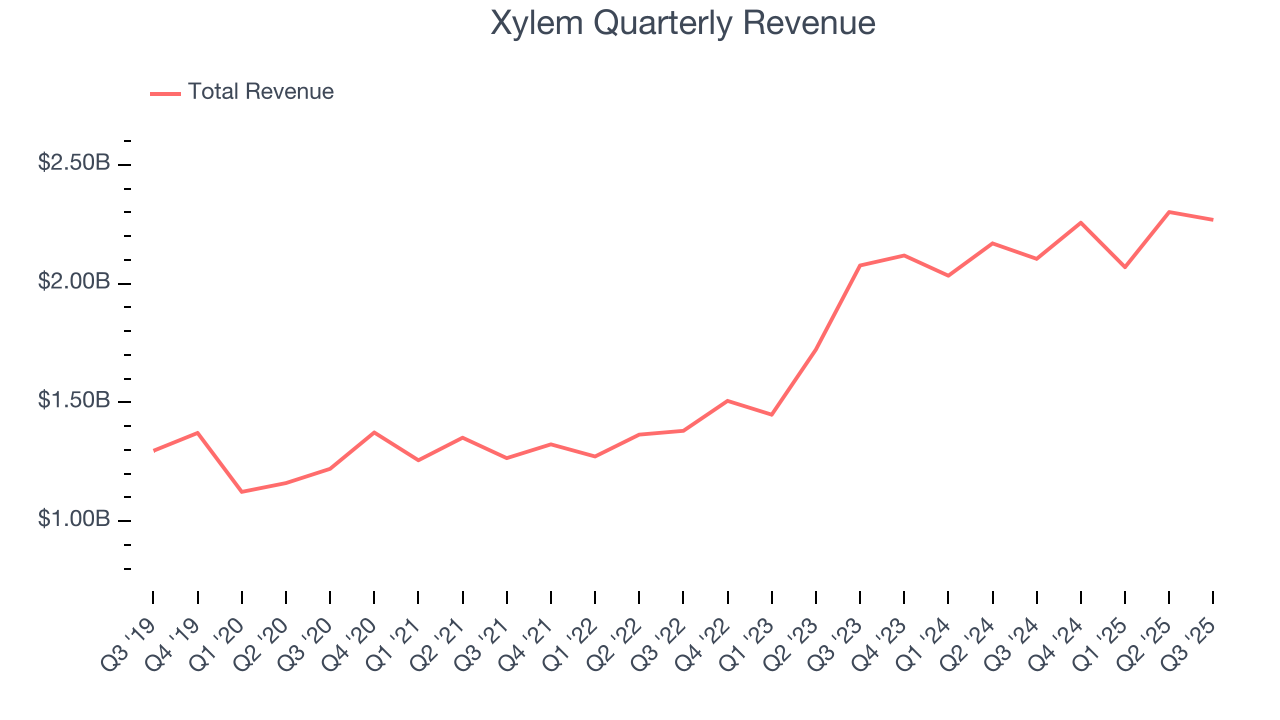
We at StockStory place the most emphasis on long-term growth, but within industrials, a half-decade historical view may miss cycles, industry trends, or a company capitalizing on catalysts such as a new contract win or a successful product line. Xylem’s annualized revenue growth of 14.8% over the last two years is above its five-year trend, suggesting its demand was strong and recently accelerated. 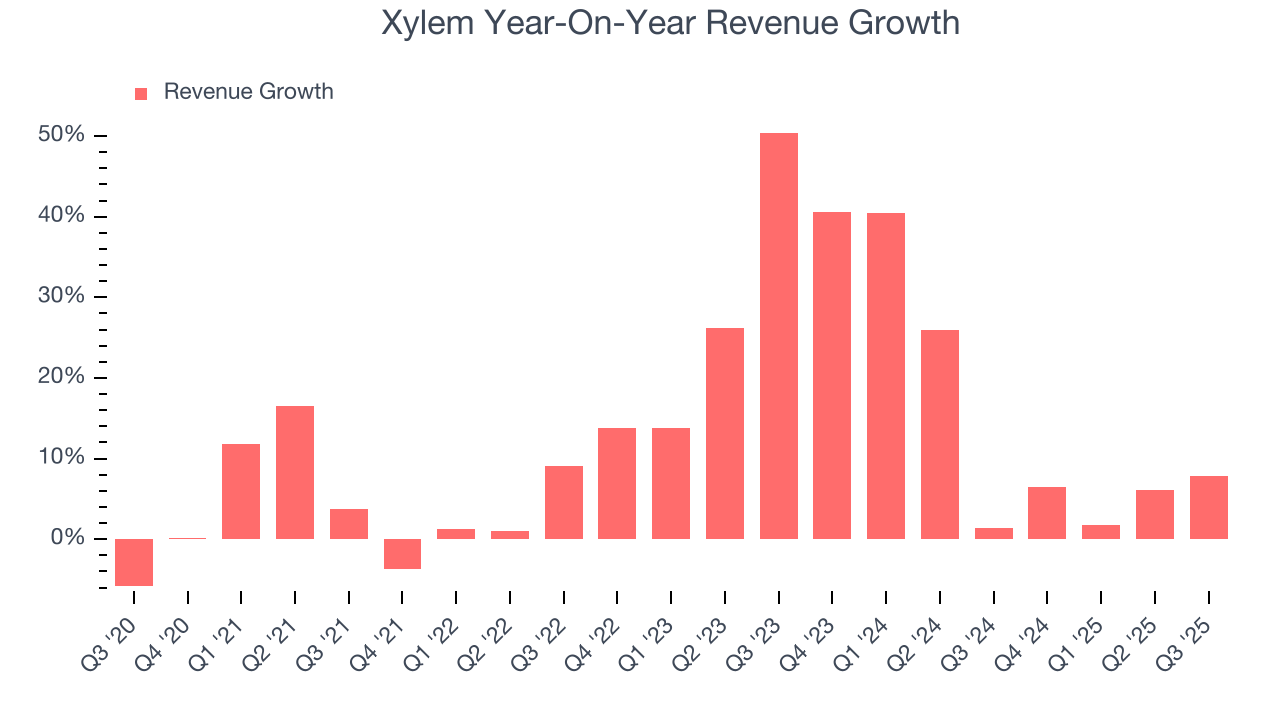
Xylem also reports organic revenue, which strips out one-time events like acquisitions and currency fluctuations that don’t accurately reflect its fundamentals. Over the last two years, Xylem’s organic revenue averaged 6.1% year-on-year growth. Because this number is lower than its two-year revenue growth, we can see that some mixture of acquisitions and foreign exchange rates boosted its headline results. 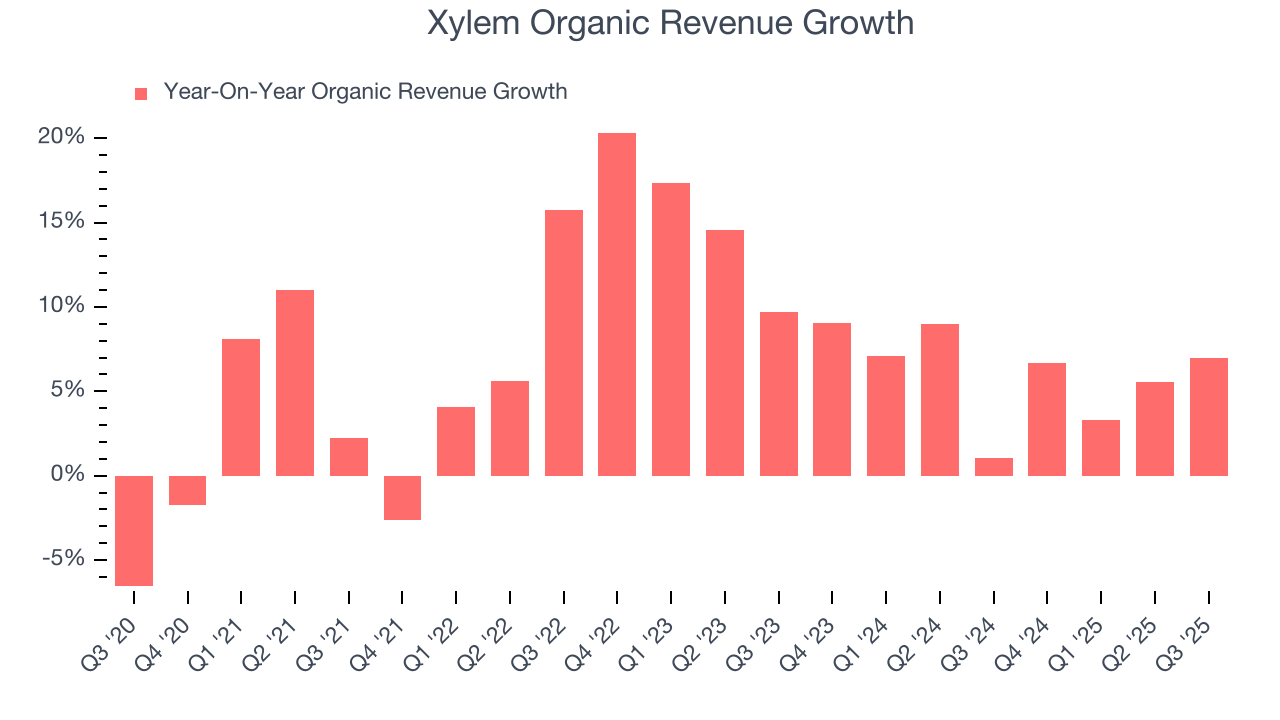
This quarter, Xylem reported year-on-year revenue growth of 7.8%, and its $2.27 billion of revenue exceeded Wall Street’s estimates by 1.9%.
Looking ahead, sell-side analysts expect revenue to grow 4.7% over the next 12 months, a deceleration versus the last two years. This projection doesn't excite us and indicates its products and services will face some demand challenges. At least the company is tracking well in other measures of financial health.
6. Gross Margin & Pricing Power
All else equal, we prefer higher gross margins because they usually indicate that a company sells more differentiated products and commands stronger pricing power.
Xylem’s unit economics are great compared to the broader industrials sector and signal that it enjoys product differentiation through quality or brand. As you can see below, it averaged an excellent 37.7% gross margin over the last five years. Said differently, roughly $37.71 was left to spend on selling, marketing, R&D, and general administrative overhead for every $100 in revenue. 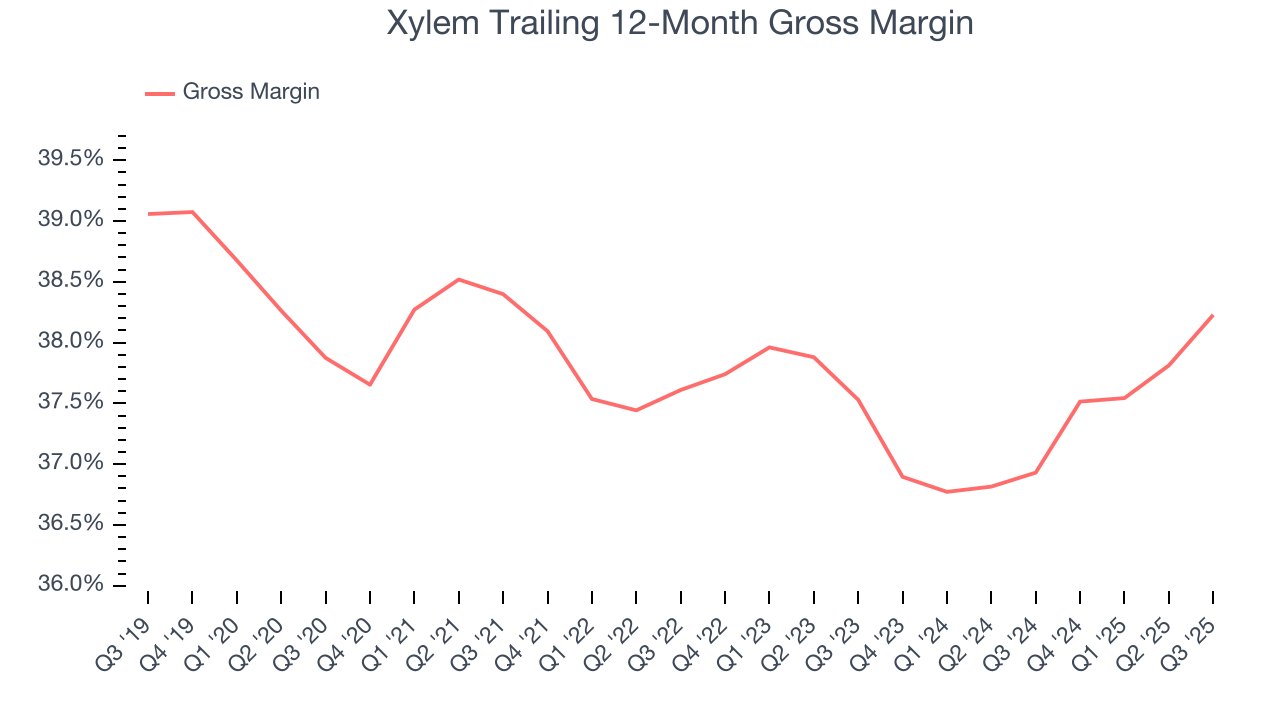
Xylem produced a 38.9% gross profit margin in Q3, up 1.7 percentage points year on year. Xylem’s full-year margin has also been trending up over the past 12 months, increasing by 1.3 percentage points. If this move continues, it could suggest better unit economics due to more leverage from its growing sales on the fixed portion of its cost of goods sold (such as manufacturing expenses).
7. Operating Margin
Operating margin is an important measure of profitability as it shows the portion of revenue left after accounting for all core expenses – everything from the cost of goods sold to advertising and wages. It’s also useful for comparing profitability across companies with different levels of debt and tax rates because it excludes interest and taxes.
Xylem’s operating margin has risen over the last 12 months and averaged 11.3% over the last five years. Its solid profitability for an industrials business shows it manages its expenses efficiently and benefits from operating leverage as it scales. This is seen in its fast historical revenue growth and healthy gross margin, which is why we look at all three data points together.
Looking at the trend in its profitability, Xylem’s operating margin might fluctuated slightly but has generally stayed the same over the last five years. This raises questions about the company’s expense base because its revenue growth should have given it leverage on its fixed costs, resulting in better economies of scale and profitability.
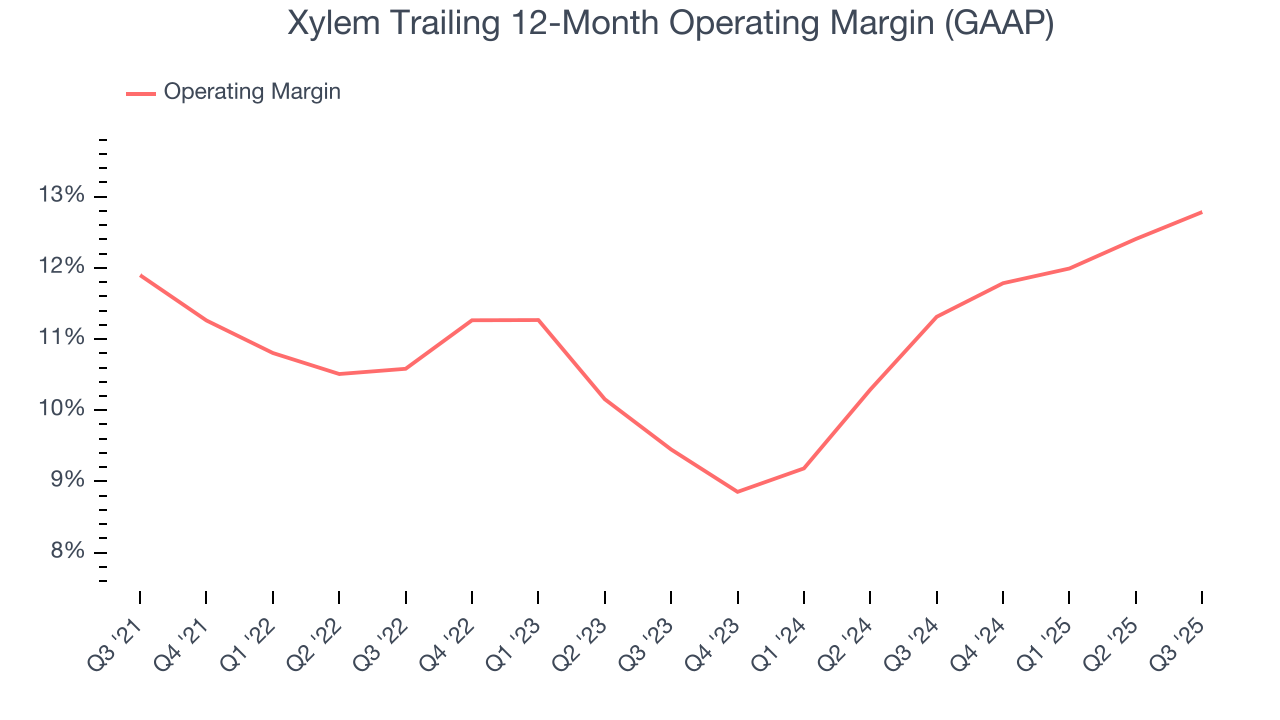
In Q3, Xylem generated an operating margin profit margin of 14.7%, up 1.4 percentage points year on year. Since its gross margin expanded more than its operating margin, we can infer that leverage on its cost of sales was the primary driver behind the recently higher efficiency.
8. Earnings Per Share
Revenue trends explain a company’s historical growth, but the long-term change in earnings per share (EPS) points to the profitability of that growth – for example, a company could inflate its sales through excessive spending on advertising and promotions.
Xylem’s EPS grew at an astounding 17.7% compounded annual growth rate over the last five years, higher than its 12.8% annualized revenue growth. This tells us the company became more profitable on a per-share basis as it expanded.
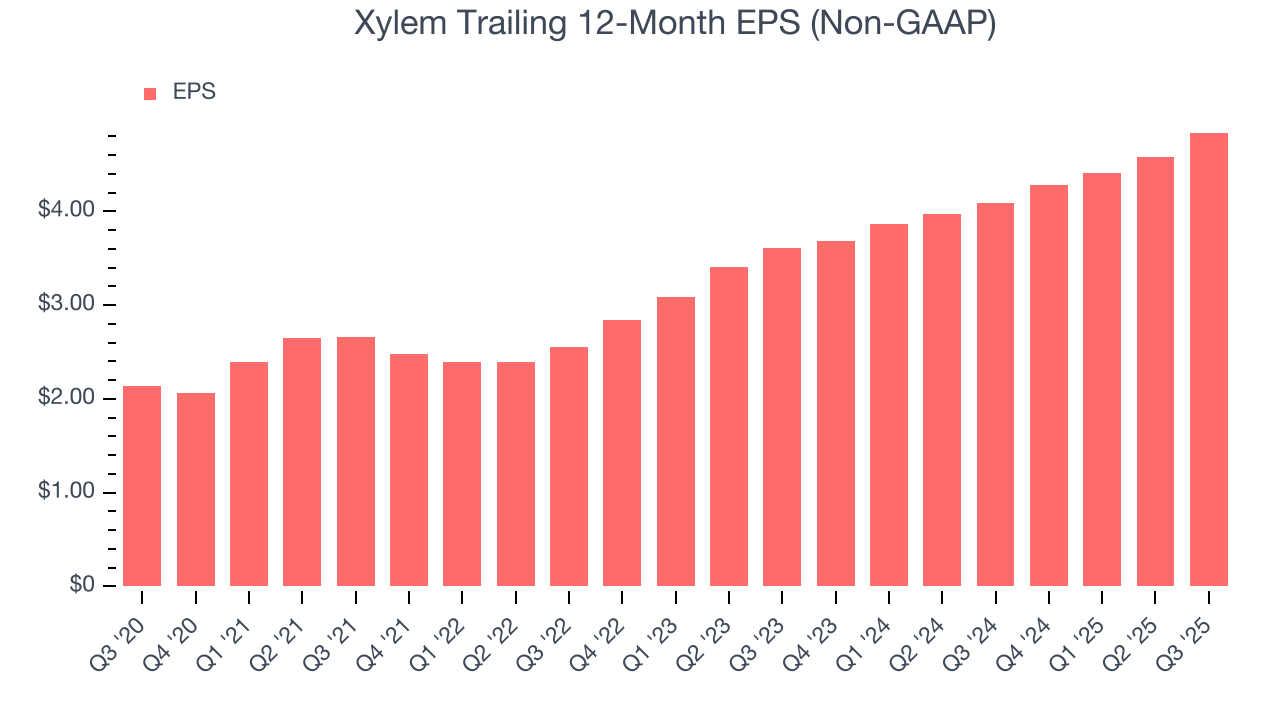
Like with revenue, we analyze EPS over a shorter period to see if we are missing a change in the business.
For Xylem, its two-year annual EPS growth of 15.8% was lower than its five-year trend. We still think its growth was good and hope it can accelerate in the future.
In Q3, Xylem reported adjusted EPS of $1.37, up from $1.11 in the same quarter last year. This print easily cleared analysts’ estimates, and shareholders should be content with the results. Over the next 12 months, Wall Street expects Xylem’s full-year EPS of $4.84 to grow 8.2%.
9. Cash Is King
If you’ve followed StockStory for a while, you know we emphasize free cash flow. Why, you ask? We believe that in the end, cash is king, and you can’t use accounting profits to pay the bills.
Xylem has shown impressive cash profitability, enabling it to ride out cyclical downturns more easily while maintaining its investments in new and existing offerings. The company’s free cash flow margin averaged 8.7% over the last five years, better than the broader industrials sector.
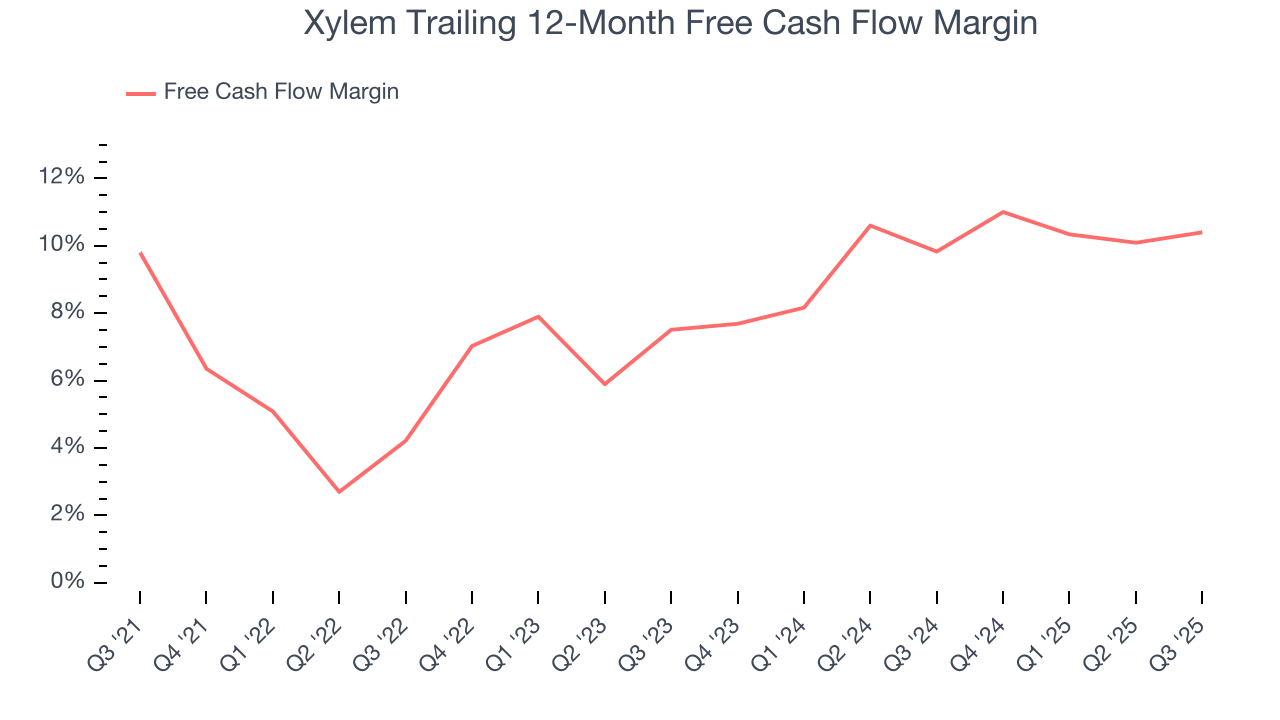
Xylem’s free cash flow clocked in at $281 million in Q3, equivalent to a 12.4% margin. This result was good as its margin was 1.1 percentage points higher than in the same quarter last year. Its cash profitability was also above its five-year level, and we hope the company can build on this trend.
10. Return on Invested Capital (ROIC)
EPS and free cash flow tell us whether a company was profitable while growing its revenue. But was it capital-efficient? Enter ROIC, a metric showing how much operating profit a company generates relative to the money it has raised (debt and equity).
Although Xylem has shown solid business quality lately, it historically did a mediocre job investing in profitable growth initiatives. Its five-year average ROIC was 8.4%, somewhat low compared to the best industrials companies that consistently pump out 20%+.
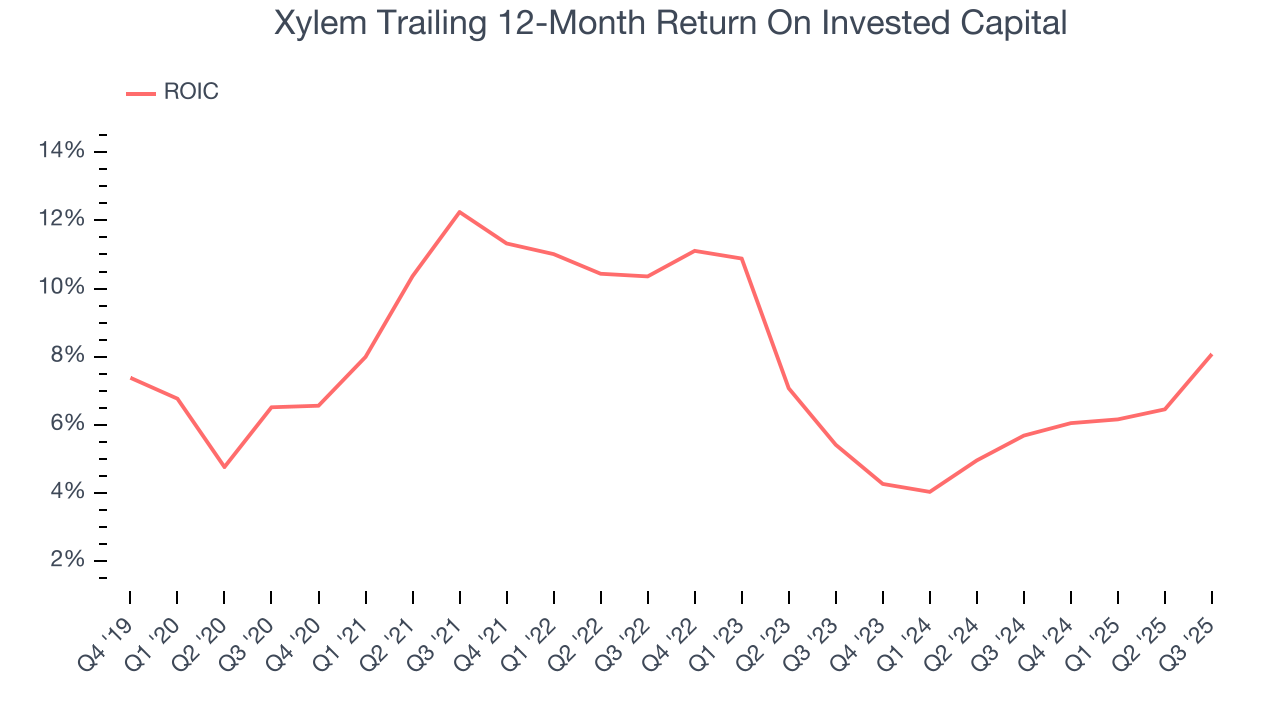
We like to invest in businesses with high returns, but the trend in a company’s ROIC is what often surprises the market and moves the stock price. Over the last few years, Xylem’s ROIC averaged 4.4 percentage point decreases each year. If its returns keep falling, it could suggest its profitable growth opportunities are drying up. We’ll keep a close eye.
11. Balance Sheet Assessment
Xylem reported $1.19 billion of cash and $1.96 billion of debt on its balance sheet in the most recent quarter. As investors in high-quality companies, we primarily focus on two things: 1) that a company’s debt level isn’t too high and 2) that its interest payments are not excessively burdening the business.
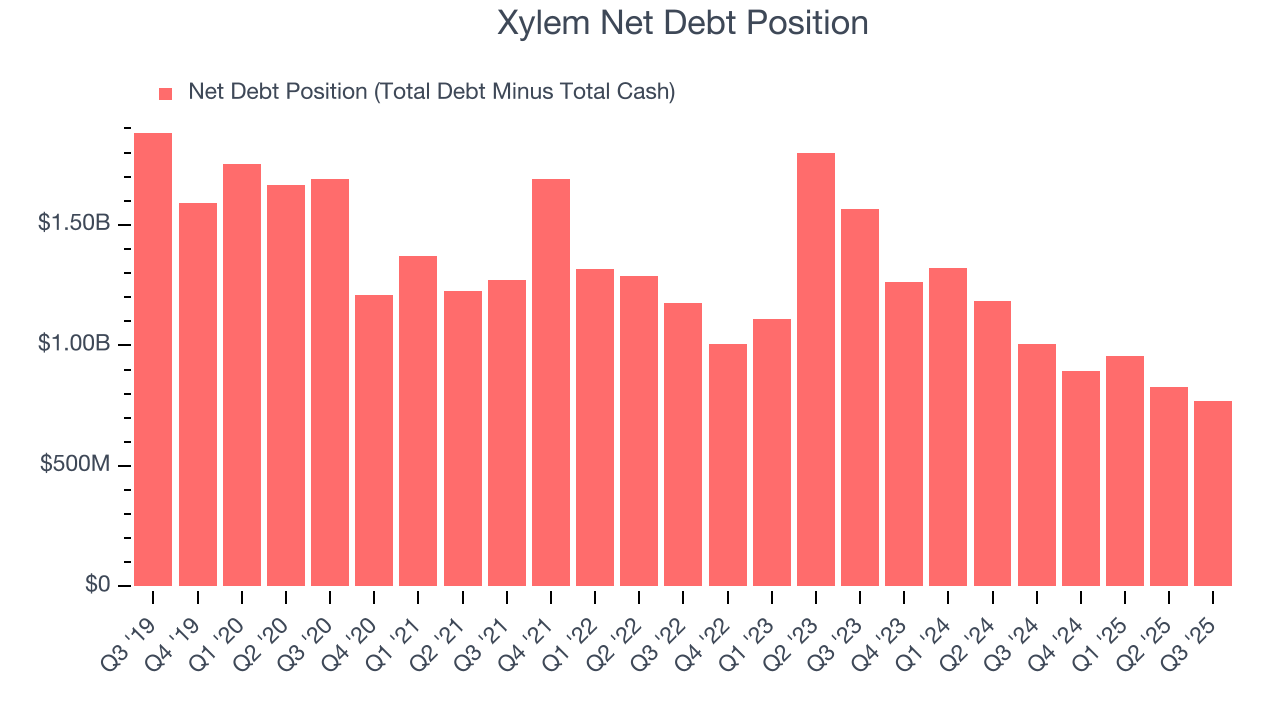
With $2.06 billion of EBITDA over the last 12 months, we view Xylem’s 0.4× net-debt-to-EBITDA ratio as safe. We also see its $8 million of annual interest expenses as appropriate. The company’s profits give it plenty of breathing room, allowing it to continue investing in growth initiatives.
12. Key Takeaways from Xylem’s Q3 Results
We were impressed by Xylem’s optimistic full-year EPS guidance, which blew past analysts’ expectations. We were also glad its EBITDA outperformed Wall Street’s estimates. Zooming out, we think this quarter featured some important positives. The stock traded up 2.8% to $153.54 immediately after reporting.
13. Is Now The Time To Buy Xylem?
Updated: January 24, 2026 at 9:12 PM EST
The latest quarterly earnings matters, sure, but we actually think longer-term fundamentals and valuation matter more. Investors should consider all these pieces before deciding whether or not to invest in Xylem.
Xylem possesses a number of positive attributes. First off, its revenue growth was impressive over the last five years. And while its diminishing returns show management's recent bets still have yet to bear fruit, its astounding EPS growth over the last five years shows its profits are trickling down to shareholders. On top of that, its healthy gross margins indicate the value of its differentiated offerings.
Xylem’s P/E ratio based on the next 12 months is 26.3x. Looking at the industrials landscape right now, Xylem trades at a pretty interesting price. If you trust the business and its direction, this is an ideal time to buy.
Wall Street analysts have a consensus one-year price target of $167.18 on the company (compared to the current share price of $141.26), implying they see 18.3% upside in buying Xylem in the short term.