
Aramark (ARMK)
We aren’t fans of Aramark. Its low returns on capital raise concerns about its ability to deliver profits, a must for quality companies.― StockStory Analyst Team
1. News
2. Summary
Why Aramark Is Not Exciting
From serving hot dogs at major league stadiums to managing college dining halls that feed thousands daily, Aramark (NYSE:ARMK) provides food services and facilities management to schools, healthcare facilities, businesses, sports venues, and correctional institutions across 16 countries.
- Ability to fund investments or reward shareholders with increased buybacks or dividends is restricted by its weak free cash flow margin of 1.2% for the last five years
- Subpar adjusted operating margin constrains its ability to invest in process improvements or effectively respond to new competitive threats
- The good news is that its enormous revenue base of $18.79 billion provides significant distribution advantages


Aramark doesn’t measure up to our expectations. There are more appealing investments to be made.
Why There Are Better Opportunities Than Aramark


Aramark is trading at $38.98 per share, or 17x forward P/E. While valuation is appropriate for the quality you get, we’re still on the sidelines for now.
We’d rather invest in similarly-priced but higher-quality companies with more reliable earnings growth.
3. Aramark (ARMK) Research Report: Q4 CY2025 Update
Food and facilities services provider Aramark (NYSE:ARMK) reported Q4 CY2025 results beating Wall Street’s revenue expectations, with sales up 6.1% year on year to $4.83 billion. The company expects the full year’s revenue to be around $19.75 billion, close to analysts’ estimates. Its GAAP profit of $0.36 per share was 20.1% below analysts’ consensus estimates.
Aramark (ARMK) Q4 CY2025 Highlights:
- Revenue: $4.83 billion vs analyst estimates of $4.75 billion (6.1% year-on-year growth, 1.8% beat)
- EPS (GAAP): $0.36 vs analyst expectations of $0.45 (20.1% miss)
- Adjusted EBITDA: $359.8 million vs analyst estimates of $361.4 million (7.4% margin, in line)
- The company reconfirmed its revenue guidance for the full year of $19.75 billion at the midpoint
- EPS (GAAP) guidance for the full year is $2.23 at the midpoint, beating analyst estimates by 16.4%
- Operating Margin: 4.5%, in line with the same quarter last year
- Free Cash Flow was -$902.2 million compared to -$707 million in the same quarter last year
- Market Capitalization: $10.2 billion
Company Overview
From serving hot dogs at major league stadiums to managing college dining halls that feed thousands daily, Aramark (NYSE:ARMK) provides food services and facilities management to schools, healthcare facilities, businesses, sports venues, and correctional institutions across 16 countries.
Aramark operates through two main segments: Food and Support Services United States and Food and Support Services International. The company serves as an exclusive provider at most locations, handling everything from food procurement and preparation to hiring and supervising service personnel. Beyond just food service, Aramark offers comprehensive facilities management including custodial services, grounds maintenance, energy management, and plant operations.
In education, Aramark serves approximately 1,330 colleges, universities, and school systems, offering dining services, catering, and retail food operations. Its healthcare division supports about 190 healthcare client families across more than 1,100 facilities with patient nutrition, retail food, and environmental services. The company's sports and leisure division is particularly visible, serving 26 teams across major professional leagues and approximately 150 college teams, plus convention centers and national parks.
Aramark's business model typically involves multi-year contracts with clients that provide a captive customer base of employees, students, patients, or event attendees. For larger venues like universities or stadiums, contracts often require significant upfront capital investments in exchange for longer contract terms, usually ranging from five to fifteen years. This creates a stable revenue structure while allowing for seasonal variations, particularly between academic and sports schedules throughout the fiscal year.
4. Business Process Outsourcing & Consulting
The sector stands to benefit from ongoing digital transformation, increasing corporate demand for cost efficiencies, and the growing complexity of regulatory and cybersecurity landscapes. For those that invest wisely, AI and automation capabilities could emerge as competitive advantages, enhancing process efficiencies for the companies themselves as well as their clients. On the flip side, AI could be a headwind as well as the technology could lower the barrier to entry in the space and give rise to more self-service solutions. Additional challenges in the years ahead could include wage inflation for highly skilled consultants and potential regulatory scrutiny on outsourcing practices—especially in industries like finance and healthcare where who has access to certain data matters greatly.
Aramark's primary competitors include other multinational food and facilities management providers such as Compass Group plc, Sodexo SA, Delaware North Companies Inc. in the United States, and additional international rivals like Elior SA and ISS in its overseas markets.
5. Revenue Growth
A company’s long-term sales performance can indicate its overall quality. Any business can put up a good quarter or two, but many enduring ones grow for years.
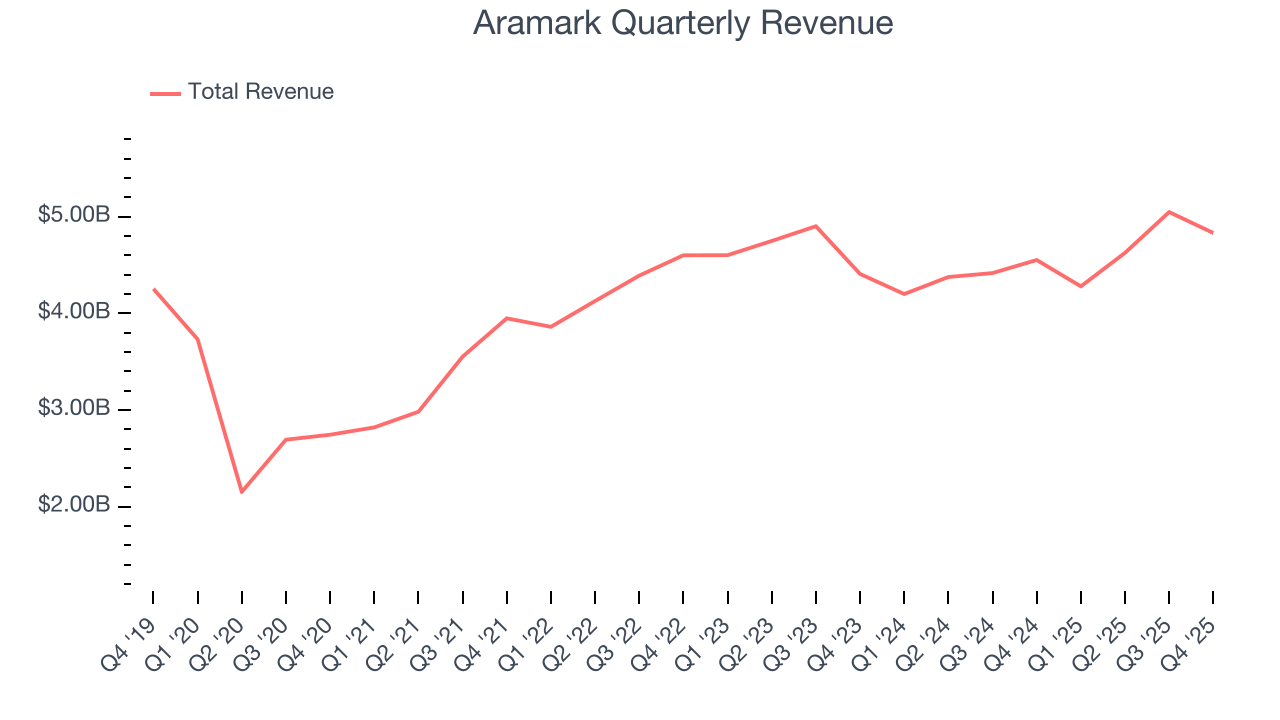
With $18.79 billion in revenue over the past 12 months, Aramark is a behemoth in the business services sector and benefits from economies of scale, giving it an edge in distribution. This also enables it to gain more leverage on its fixed costs than smaller competitors and the flexibility to offer lower prices.
As you can see below, Aramark’s 10.7% annualized revenue growth over the last five years was impressive. This shows it had high demand, a useful starting point for our analysis.
We at StockStory place the most emphasis on long-term growth, but within business services, a half-decade historical view may miss recent innovations or disruptive industry trends. Aramark’s recent performance shows its demand has slowed significantly as its revenue was flat over the last two years. 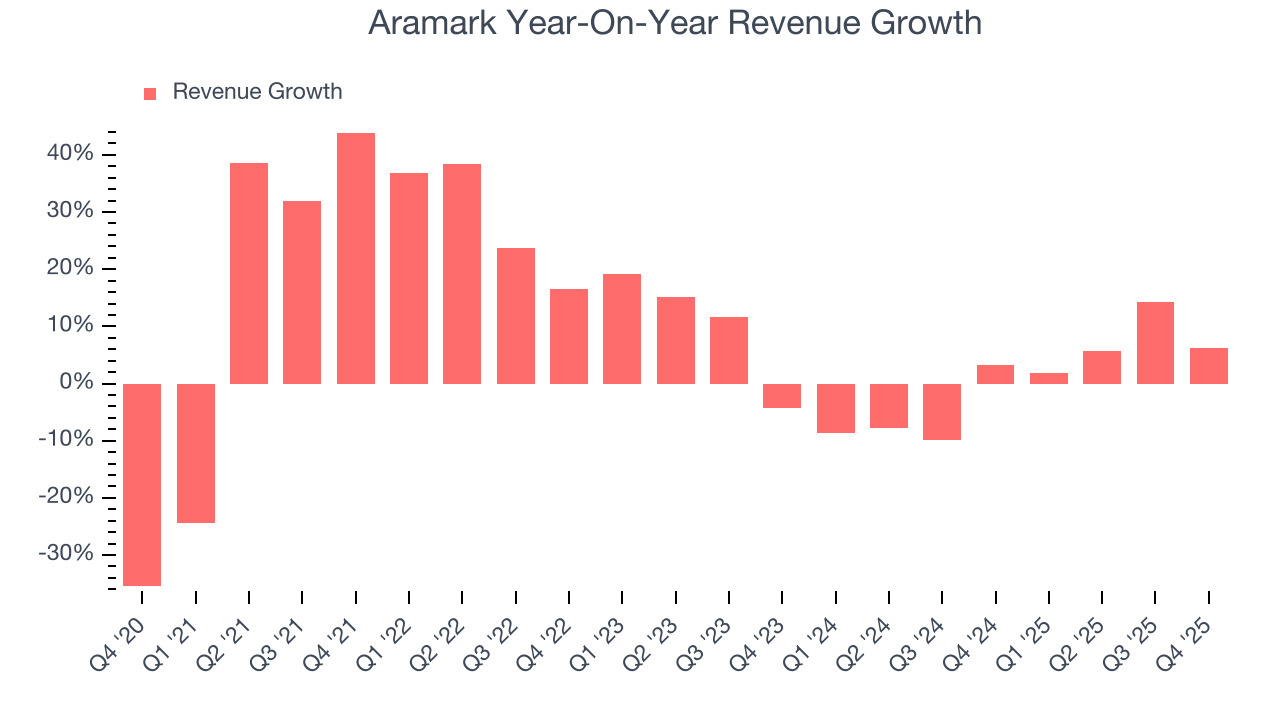
This quarter, Aramark reported year-on-year revenue growth of 6.1%, and its $4.83 billion of revenue exceeded Wall Street’s estimates by 1.8%.
Looking ahead, sell-side analysts expect revenue to grow 6.2% over the next 12 months, an improvement versus the last two years. This projection is above the sector average and implies its newer products and services will spur better top-line performance.
6. Operating Margin
Operating margin is one of the best measures of profitability because it tells us how much money a company takes home after subtracting all core expenses, like marketing and R&D.
Aramark was profitable over the last five years but held back by its large cost base. Its average operating margin of 4% was weak for a business services business.
On the plus side, Aramark’s operating margin rose by 1.6 percentage points over the last five years, as its sales growth gave it operating leverage.
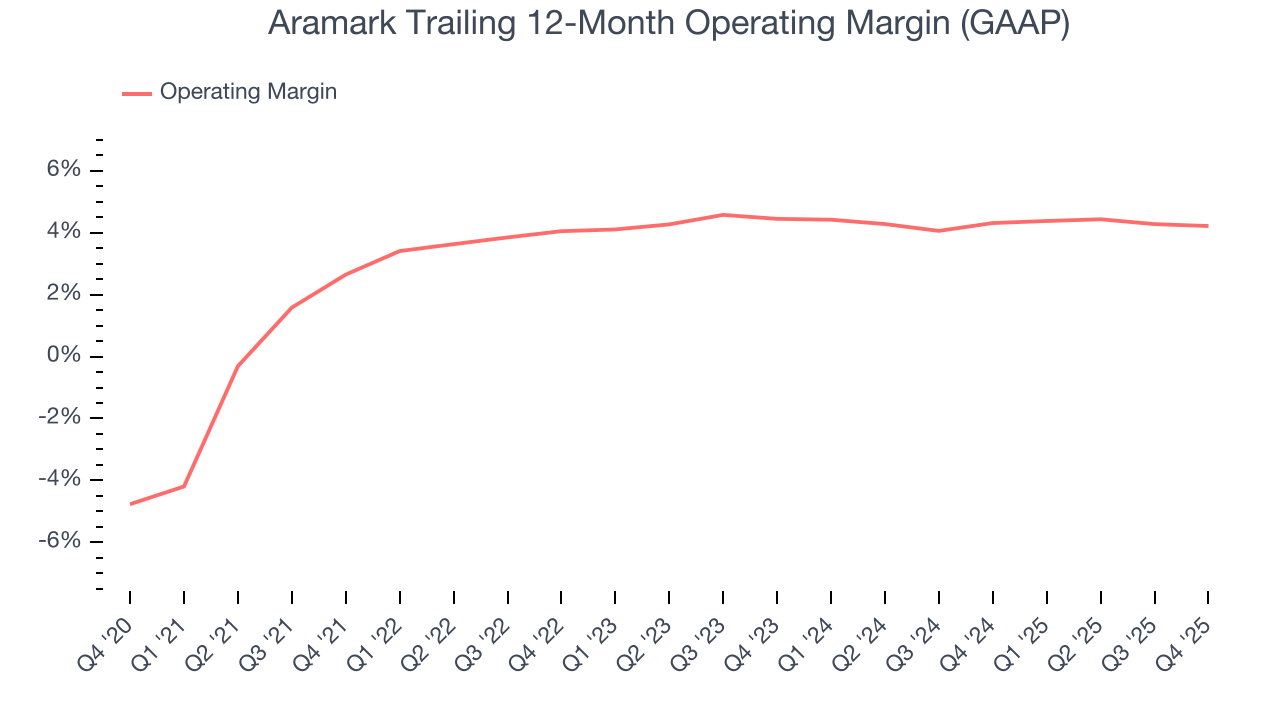
This quarter, Aramark generated an operating margin profit margin of 4.5%, in line with the same quarter last year. This indicates the company’s overall cost structure has been relatively stable.
7. Earnings Per Share
Revenue trends explain a company’s historical growth, but the long-term change in earnings per share (EPS) points to the profitability of that growth – for example, a company could inflate its sales through excessive spending on advertising and promotions.
Aramark’s full-year EPS flipped from negative to positive over the last five years. This is encouraging and shows it’s at a critical moment in its life.
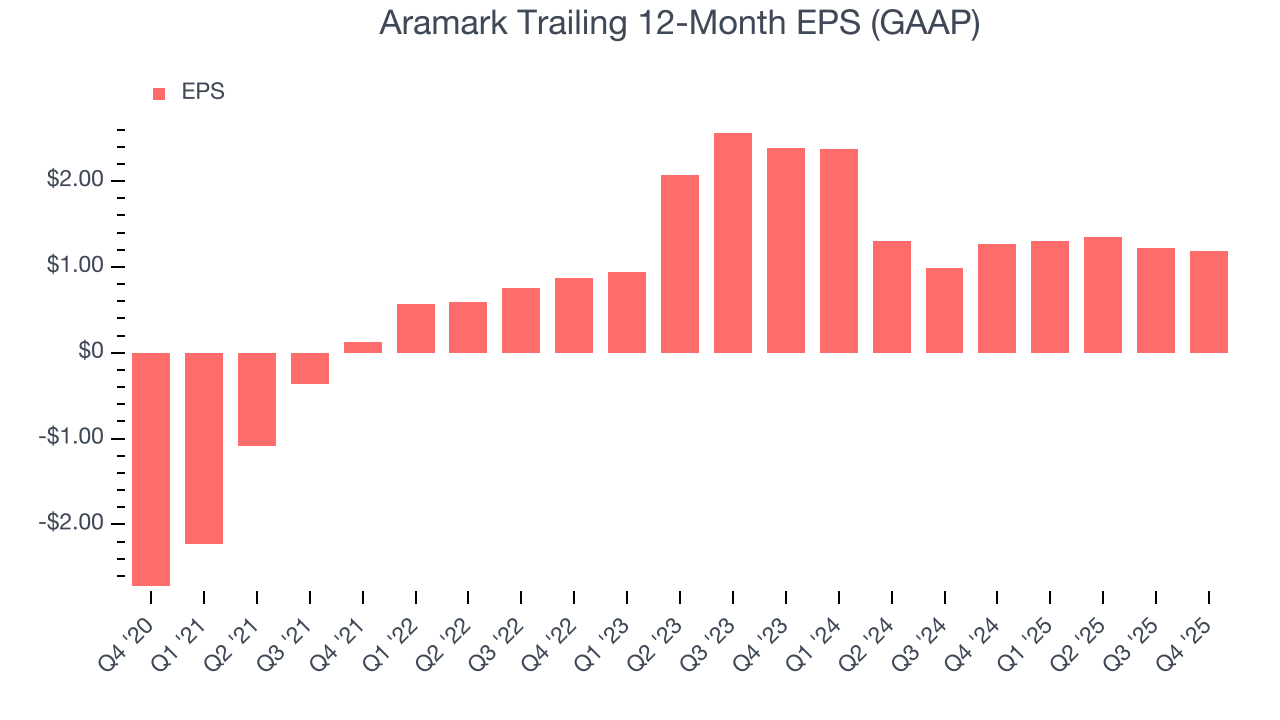
Like with revenue, we analyze EPS over a more recent period because it can provide insight into an emerging theme or development for the business.
Sadly for Aramark, its EPS declined by 29.5% annually over the last two years while its revenue was flat. This tells us the company struggled to adjust to choppy demand.
In Q4, Aramark reported EPS of $0.36, down from $0.39 in the same quarter last year. This print missed analysts’ estimates, but we care more about long-term EPS growth than short-term movements. Over the next 12 months, Wall Street expects Aramark’s full-year EPS of $1.19 to grow 73.5%.
8. Cash Is King
Free cash flow isn't a prominently featured metric in company financials and earnings releases, but we think it's telling because it accounts for all operating and capital expenses, making it tough to manipulate. Cash is king.
Aramark has shown poor cash profitability over the last five years, giving the company limited opportunities to return capital to shareholders. Its free cash flow margin averaged 1.2%, lousy for a business services business.
Taking a step back, an encouraging sign is that Aramark’s margin expanded by 2.2 percentage points during that time. We have no doubt shareholders would like to continue seeing its cash conversion rise as it gives the company more optionality.
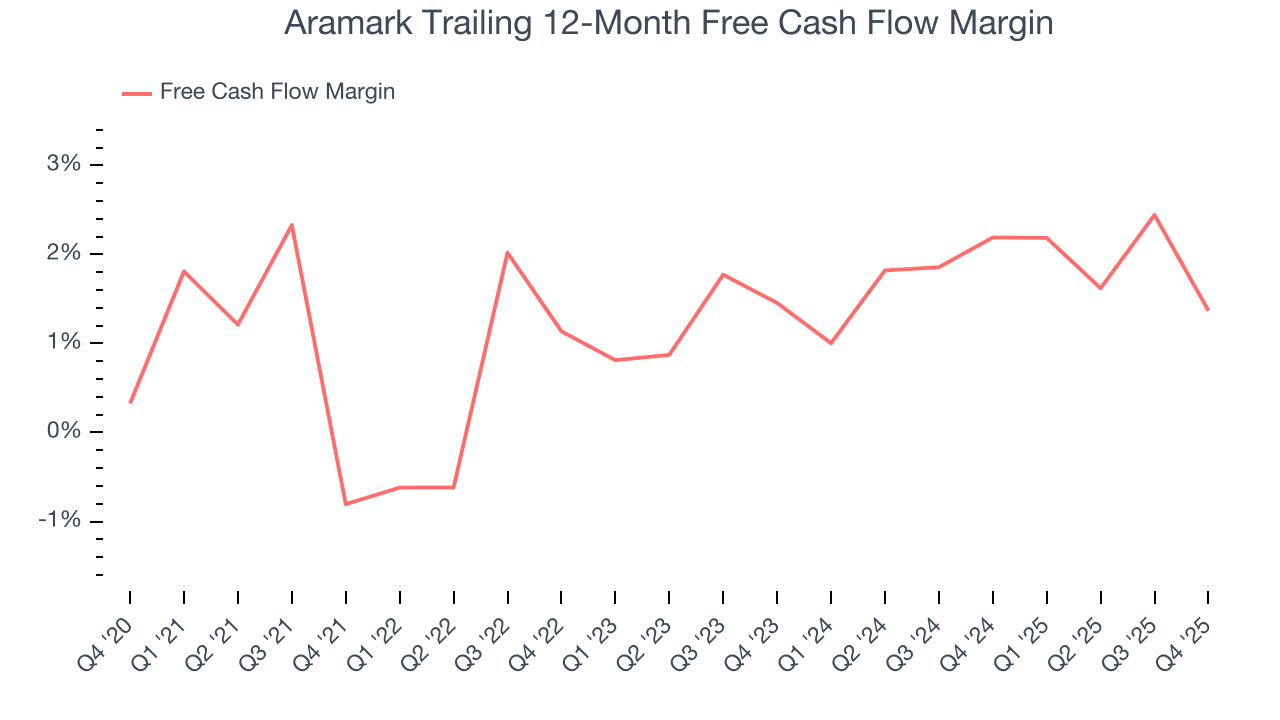
Aramark burned through $902.2 million of cash in Q4, equivalent to a negative 18.7% margin. The company’s cash burn increased from $707 million of lost cash in the same quarter last year. These numbers deviate from its longer-term margin, indicating it is a seasonal business that must build up inventory during certain quarters.
9. Return on Invested Capital (ROIC)
EPS and free cash flow tell us whether a company was profitable while growing its revenue. But was it capital-efficient? Enter ROIC, a metric showing how much operating profit a company generates relative to the money it has raised (debt and equity).
Aramark historically did a mediocre job investing in profitable growth initiatives. Its five-year average ROIC was 6.6%, somewhat low compared to the best business services companies that consistently pump out 25%+.
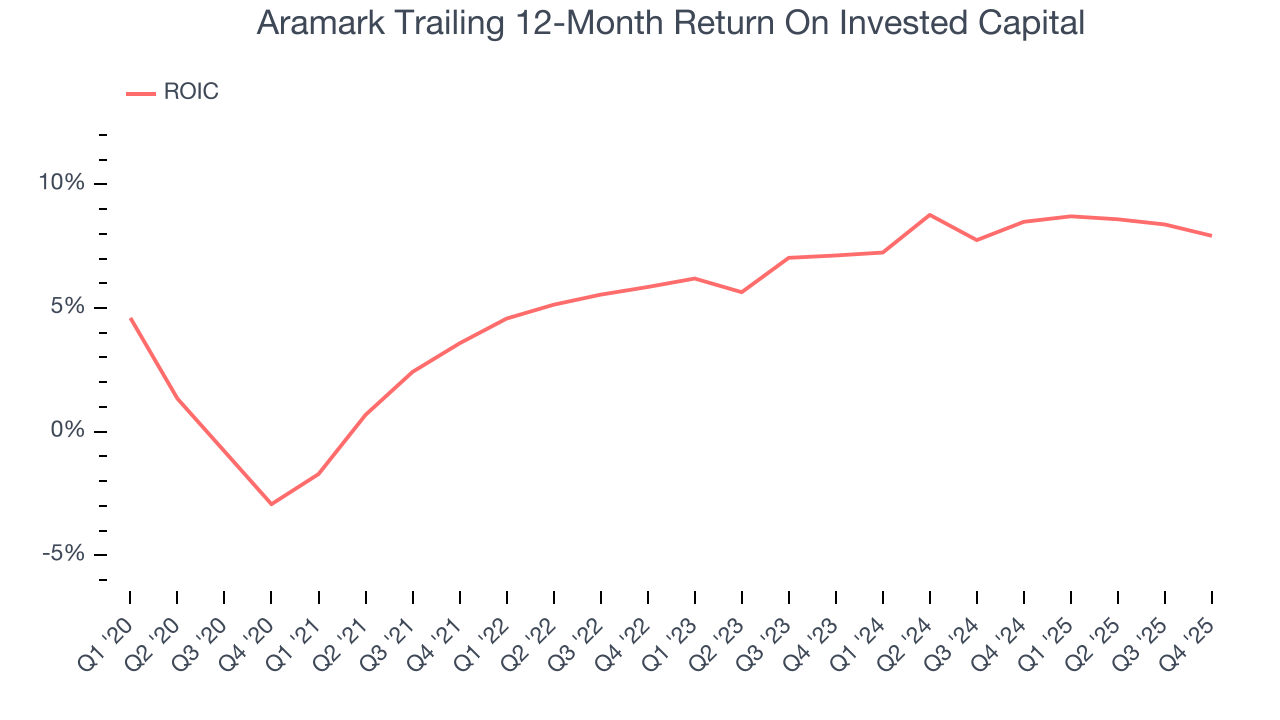
We like to invest in businesses with high returns, but the trend in a company’s ROIC is what often surprises the market and moves the stock price. Fortunately, Aramark’s ROIC averaged 3.5 percentage point increases each year over the last few years. This is a good sign, and if its returns keep rising, there’s a chance it could evolve into an investable business.
10. Balance Sheet Assessment
Aramark reported $439.6 million of cash and $6.57 billion of debt on its balance sheet in the most recent quarter. As investors in high-quality companies, we primarily focus on two things: 1) that a company’s debt level isn’t too high and 2) that its interest payments are not excessively burdening the business.
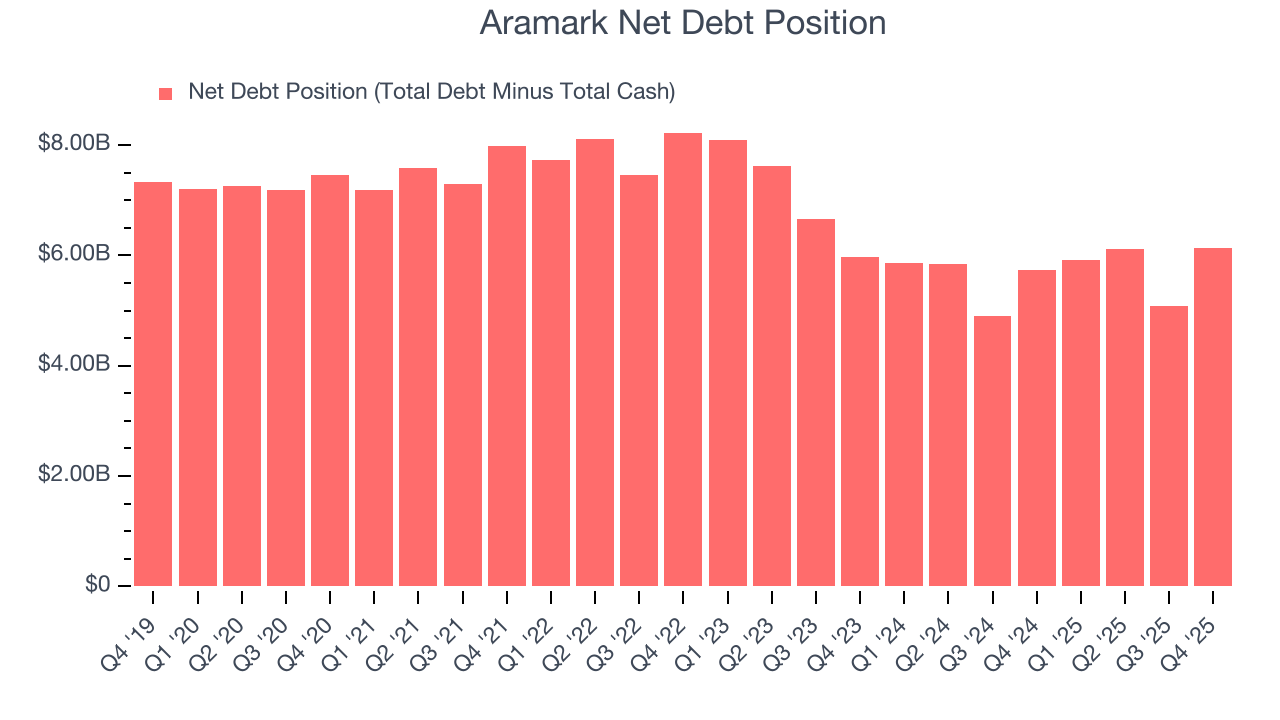
With $1.35 billion of EBITDA over the last 12 months, we view Aramark’s 4.5× net-debt-to-EBITDA ratio as safe. We also see its $184.2 million of annual interest expenses as appropriate. The company’s profits give it plenty of breathing room, allowing it to continue investing in growth initiatives.
11. Key Takeaways from Aramark’s Q4 Results
We were impressed by how significantly Aramark blew past analysts’ full-year EPS guidance expectations this quarter. We were also happy its revenue outperformed Wall Street’s estimates. On the other hand, its EPS missed. Zooming out, we think this was a mixed quarter. The stock remained flat at $38.86 immediately following the results.
12. Is Now The Time To Buy Aramark?
Updated: February 13, 2026 at 11:47 PM EST
The latest quarterly earnings matters, sure, but we actually think longer-term fundamentals and valuation matter more. Investors should consider all these pieces before deciding whether or not to invest in Aramark.
When it comes to Aramark’s business quality, there are some positives, but it ultimately falls short. First off, its revenue growth was impressive over the last five years. And while Aramark’s low free cash flow margins give it little breathing room, its scale makes it a trusted partner with negotiating leverage.
Aramark’s P/E ratio based on the next 12 months is 17x. This valuation is reasonable, but the company’s shakier fundamentals present too much downside risk. We're fairly confident there are better stocks to buy right now.
Wall Street analysts have a consensus one-year price target of $46.40 on the company (compared to the current share price of $38.98).