
Oceaneering (OII)
We’re cautious of Oceaneering. Its weak sales growth and low returns on capital show it struggled to generate demand and profits.― StockStory Analyst Team
1. News
2. Summary
Why We Think Oceaneering Will Underperform
Deploying a fleet of 250 tethered underwater robots around the globe, Oceaneering International (NYSE:OII) provides remotely operated underwater vehicles and subsea equipment for offshore energy exploration.
- Gross margin of 17.1% is below its competitors, leaving less money to invest in exploration and production
- Responsiveness to unforeseen market trends is restricted due to its substandard EBITDA margin profitability
- A silver lining is that its returns on capital are increasing as management makes relatively better investment decisions


Oceaneering falls short of our expectations. There are more promising prospects in the market.
Why There Are Better Opportunities Than Oceaneering


At $33.05 per share, Oceaneering trades at 19.4x forward P/E. This multiple is quite expensive for the quality you get.
It’s better to pay up for high-quality businesses with strong long-term earnings potential rather than to buy lower-quality companies with open questions and big downside risks.
3. Oceaneering (OII) Research Report: Q4 CY2025 Update
Offshore services provider Oceaneering International (NYSE:OII) missed Wall Street’s revenue expectations in Q4 CY2025, with sales falling 6.3% year on year to $668.6 million. Its non-GAAP profit of $0.45 per share was 47.1% above analysts’ consensus estimates.
Oceaneering (OII) Q4 CY2025 Highlights:
- Revenue: $668.6 million vs analyst estimates of $674.8 million (6.3% year-on-year decline, 0.9% miss)
- Adjusted EPS: $0.45 vs analyst estimates of $0.31 (47.1% beat)
- Adjusted EBITDA: $90.49 million vs analyst estimates of $88.18 million (13.5% margin, 2.6% beat)
- Operating Margin: 9.8%, down from 10.9% in the same quarter last year
- Free Cash Flow Margin: 28.5%, up from 13.2% in the same quarter last year
- Market Capitalization: $3.59 billion
Company Overview
Deploying a fleet of 250 tethered underwater robots around the globe, Oceaneering International (NYSE:OII) provides remotely operated underwater vehicles and subsea equipment for offshore energy exploration.
The company operates primarily through four energy-focused segments. Its Subsea Robotics division provides remotely operated vehicles (ROVs)—tethered submersible robots controlled from the surface—that perform tasks like inspecting pipelines, maintaining underwater production facilities, supporting drilling operations, and installing subsea hardware. These work-class ROVs are equipped with manipulators, sonar, and cameras, allowing them to operate in deepwater environments where human divers cannot safely work. For example, an oil company might use Oceaneering's ROV to inspect a pipeline connection 5,000 feet underwater or to tighten bolts on a wellhead assembly on the seafloor.
Oceaneering's Manufactured Products segment produces the infrastructure that connects offshore platforms to subsea wells, including umbilicals—bundled tubes and cables that carry power, hydraulic fluids, and control signals to subsea equipment—along with specialized connectors, valves, and control systems. The Offshore Projects Group manages vessel-based operations using owned and chartered ships equipped with ROVs to install subsea equipment, perform maintenance and repairs, and provide well intervention services that restore or enhance production from existing wells. The Integrity Management & Digital Solutions segment offers inspection and testing services to ensure the safety and reliability of onshore and offshore facilities, using techniques like ultrasonic testing to detect corrosion or structural flaws in pipelines and platforms.
Beyond energy, Oceaneering's Aerospace and Defense Technologies segment applies its expertise in harsh-environment engineering to serve NASA and the U.S. Navy, providing engineering services, prototype development, and maintenance for submarines, surface ships, and space exploration systems.
4. Oilfield Services
Oilfield services companies provide equipment, technology, and services enabling exploration and production activities, including drilling, completion, well intervention, and reservoir evaluation. Their fortunes closely track upstream capital spending cycles. Tailwinds include increased drilling activity during favorable commodity environments, demand for efficiency-enhancing technologies, and growing offshore and unconventional resource development. Headwinds include significant revenue volatility tied to oil and gas price swings and producer spending discipline. Intense competition pressures pricing and margins, while the energy transition may structurally reduce long-term demand. Workforce availability and technological disruption require continuous adaptation.
Oceaneering's competitors include TechnipFMC (NYSE:FTI) in subsea equipment, Saipem (BIT:SPM) and Subsea 7 (OSE:SUBC) in offshore installation services, and Aker Solutions (OSE:AKSO) in subsea systems.
5. Economies of Scale
The scale of a company’s revenue base is an important lens through which to view the topline, as it signals whether a producer has gone from a vulnerable commodity taker into a durable operating platform. Larger producers generate revenue across many wells, pads, takeaway routes, and geographies rather than relying on a single field or drilling program. Oceaneering’s $2.78 billion of revenue in the last year lacks scale in an industry where it matters.
6. Revenue Growth
A company’s long-term performance can give signals about its business quality. Even a bad business, especially in a cyclical industry, can shine for a year or so, but a top-tier one should exhibit resilience through cycles. Regrettably, Oceaneering’s sales grew at a mediocre 8.8% compounded annual growth rate over the last five years. This fell short of our benchmark for the energy upstream and integrated energy sector and is a tough starting point for our analysis.
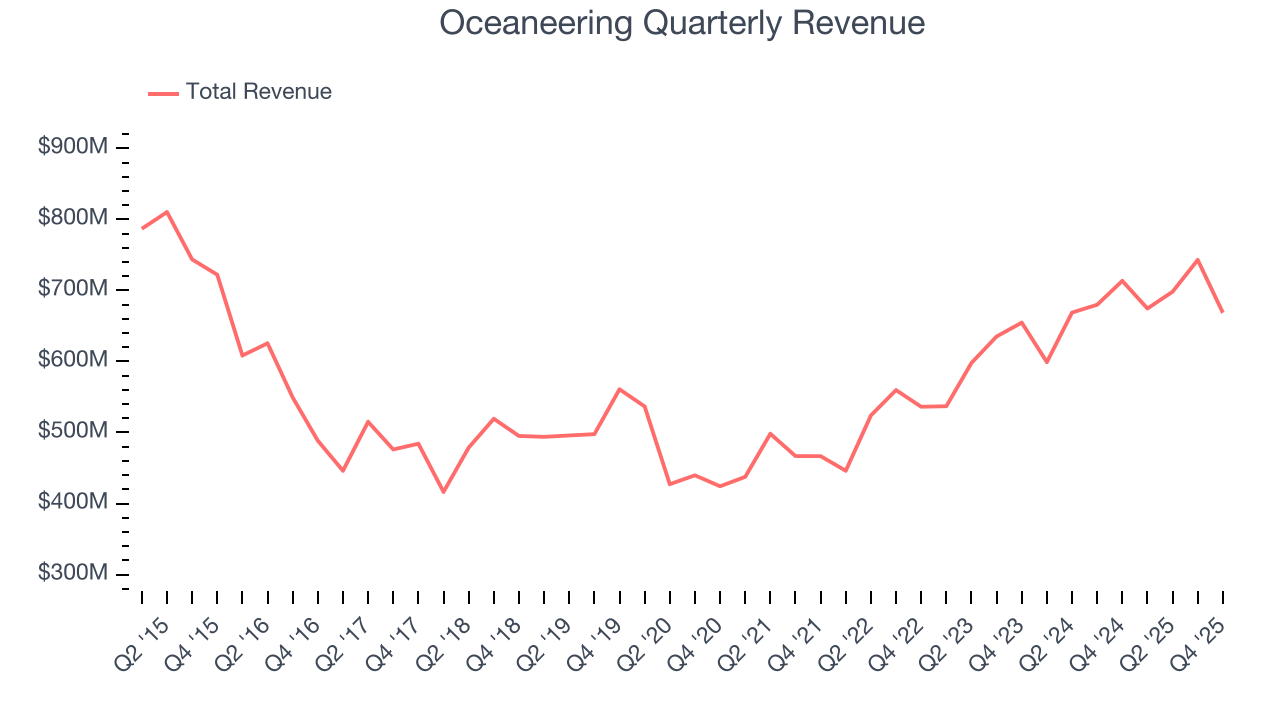
Even a long stretch in Energy can be shaped by a single commodity cycle, so extending the view to ten years adds another perspective and reveals which companies are built to grow regardless of the pricing regime. Oceaneering’s recent performance shows its demand has accelerated as its revenue was flat over the last ten years.
This quarter, Oceaneering missed Wall Street’s estimates and reported a rather uninspiring 6.3% year-on-year revenue decline, generating $668.6 million of revenue.
7. Gross Margin
In any given year, energy gross margins are heavily influenced by prices, hedging, and cost inflation, but over a full cycle these gross margins reveal which producers are structurally advantaged through superior “rock” quality, infrastructure access, and cost position.
Oceaneering, which averaged 17.1% gross margin over the last five years, exhibiting bottom-tier unit economics in the sector. It means the company will struggle at higher commodity prices than peers with better gross margins. 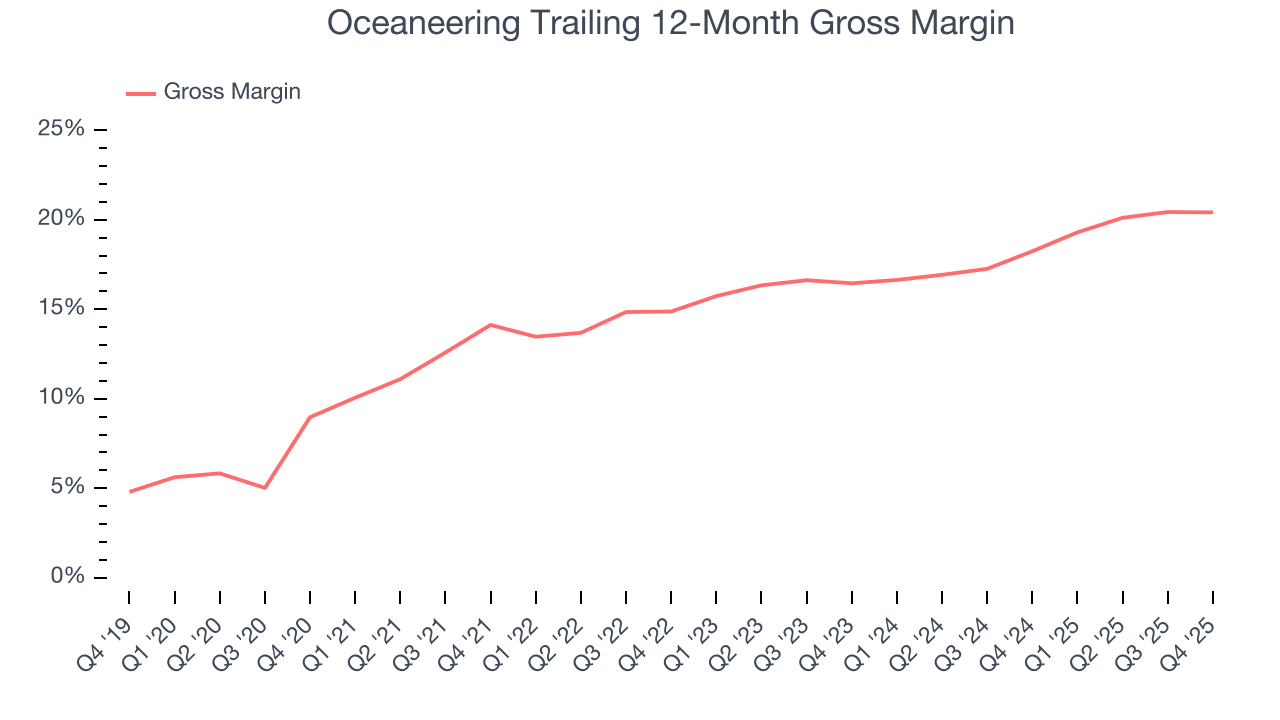
Oceaneering produced a 19.8% gross profit margin in Q4, in line with the same quarter last year.
8. Adjusted EBITDA Margin
Oceaneering was profitable over the last five years but held back by its large cost base. Its average EBITDA margin of 12.5% was among the worst in the energy upstream and integrated energy sector.
On the plus side, Oceaneering’s EBITDA margin rose by 3.2 percentage points over the last year.
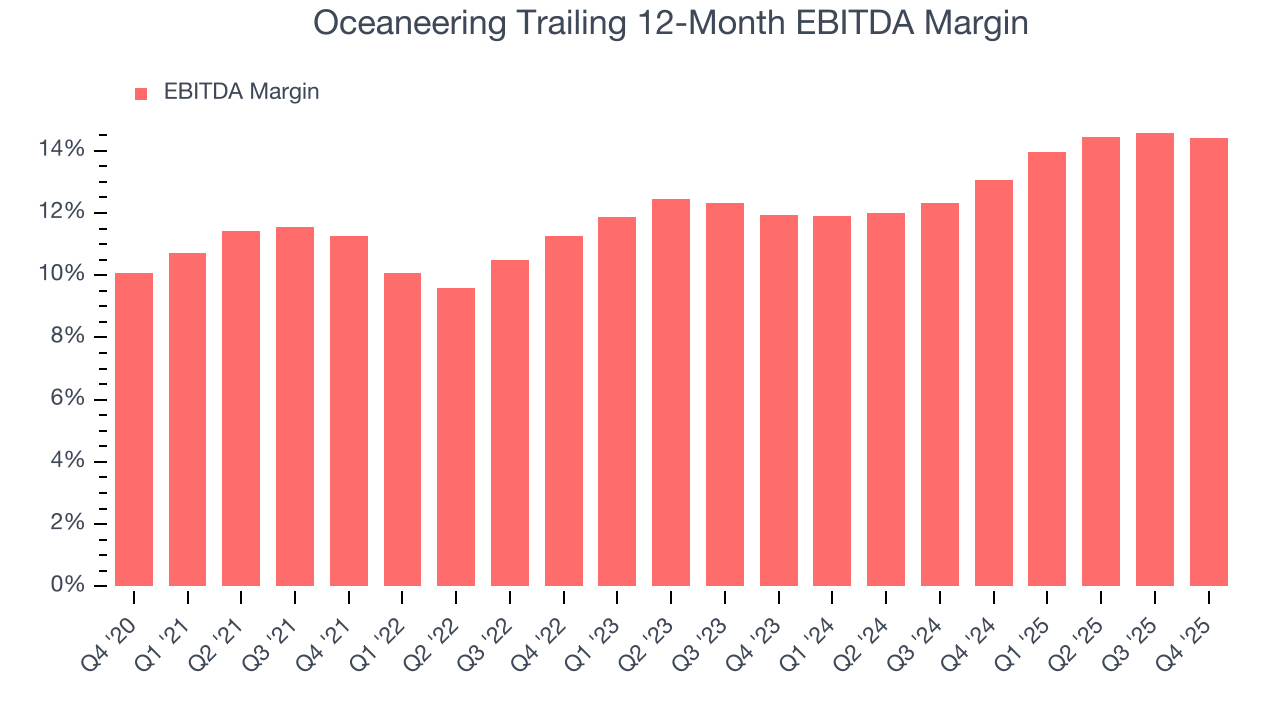
In Q4, Oceaneering generated an EBITDA margin profit margin of 13.5%, in line with the same quarter last year. This indicates the company’s overall cost structure has been relatively stable. This adjusted EBITDA beat Wall Street’s estimates by 2.6%.
9. Cash Is King
Adjusted EBITDA shows how profitable a company’s existing wells are before financing and reinvestment decisions, but free cash flow shows how much value remains after paying the cost of replacing those wells. In upstream energy, production naturally declines over time, so companies must continuously reinvest just to stand still. A producer can report strong EBITDA margins yet generate little or no free cash flow if its wells decline quickly or if new drilling is expensive. Free cash flow therefore captures not only how efficiently a company produces hydrocarbons today, but also how costly it is to sustain that production into the future.
Oceaneering has shown mediocre cash profitability relative to peers over the last five years, giving the company fewer opportunities to return capital to shareholders. Its free cash flow margin averaged 5.3%, below what we’d expect for an upstream and integrated energy business.
Absolute FCF margin levels matter but so does stability of free cash flow. All else equal, we’d prefer a 25.0% average free cash flow margin that is quite steady no matter how commodity prices behave rather than extremely high margins when times are good and negative ones when they’re tough.
Oceaneering’s ratio of quarterly free cash flow volatility to WTI crude price volatility over the past five years was 16.7 (lower is better), indicating that its cash generation is far more sensitive to commodity-price swings than most peers. This elevated volatility limits its access to capital in downturns and makes it unlikely to act as a consolidator when weaker competitors come under pressure.
You may be asking why we wait until the free cash flow line to perform this stability analysis versus commodity prices. Why not compare revenue or EBITDA to WTI in the case of Oceaneering? Because what ultimately matters is not how much revenue or profit you earn when prices are high but how much cash you can generate when prices are low. Free cash flow is the superior metric because it includes everything from hedging prowess to growth and maintenance capex to management behavior during good times and bad.
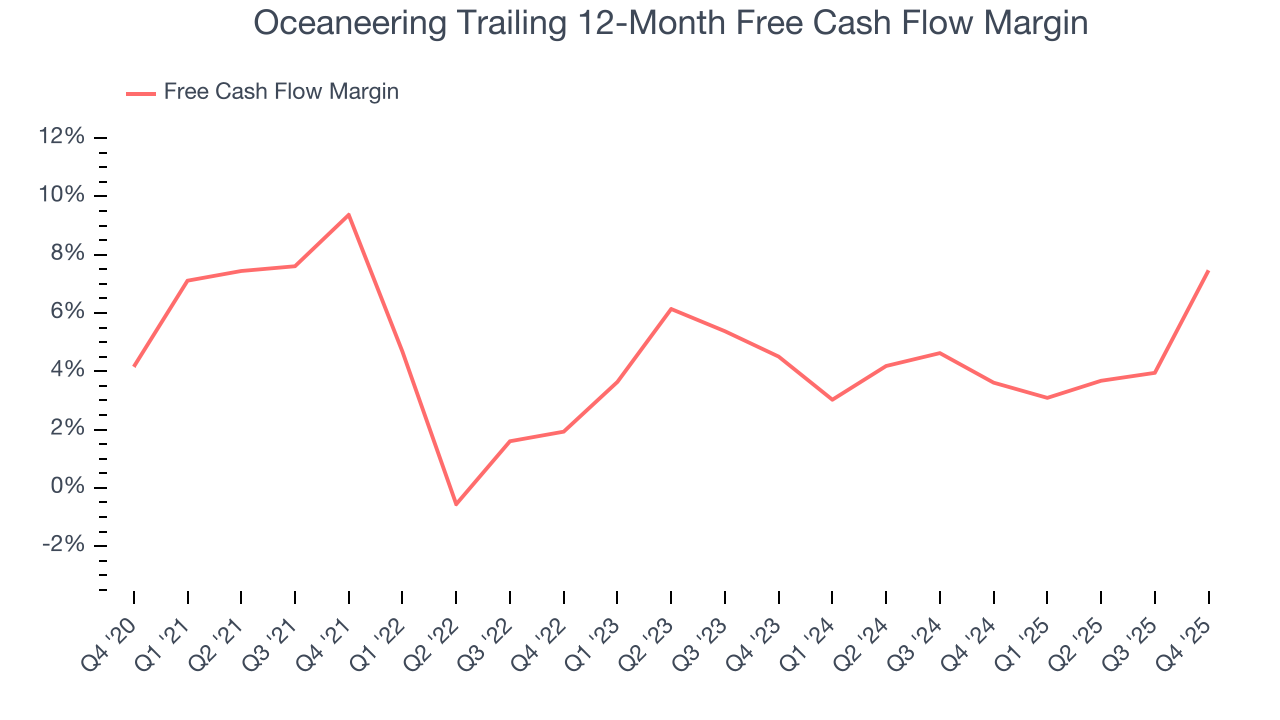
Oceaneering’s free cash flow clocked in at $190.7 million in Q4, equivalent to a 28.5% margin. This result was good as its margin was 15.3 percentage points higher than in the same quarter last year, but we wouldn’t put too much weight on the short term because investment needs can be seasonal, causing temporary swings. Long-term trends carry greater meaning.
10. Return on Invested Capital (ROIC)
Free cash flow tells investors how much money an Energy producer made, and ROIC takes this one step further by telling investors how well and effectively the business made it. ROIC illustrates how much operating profit a producer generated relative to the money it has raised (debt and equity).
We at StockStory like to look at ROIC over a ten-year period because energy investment cycles can involve up to five years of ramping production and another five years of harvesting. A decade view captures buying, extracting, and monetizing rather than just part of that picture. Oceaneering historically did a mediocre job investing in profitable growth initiatives. Its ten-year average ROIC was 7%, somewhat low compared to the best energy upstream and integrated energy companies that consistently pump out 25%+.
We like to invest in businesses with high returns, but the trend in a company’s ROIC is what often surprises the market and moves the stock price. Over the last few years, Oceaneering’s ROIC has increased significantly. This is a good sign, and we hope the company can continue improving.
11. Balance Sheet Assessment
One of the best ways to mitigate bankruptcy risk is to hold more cash than debt.
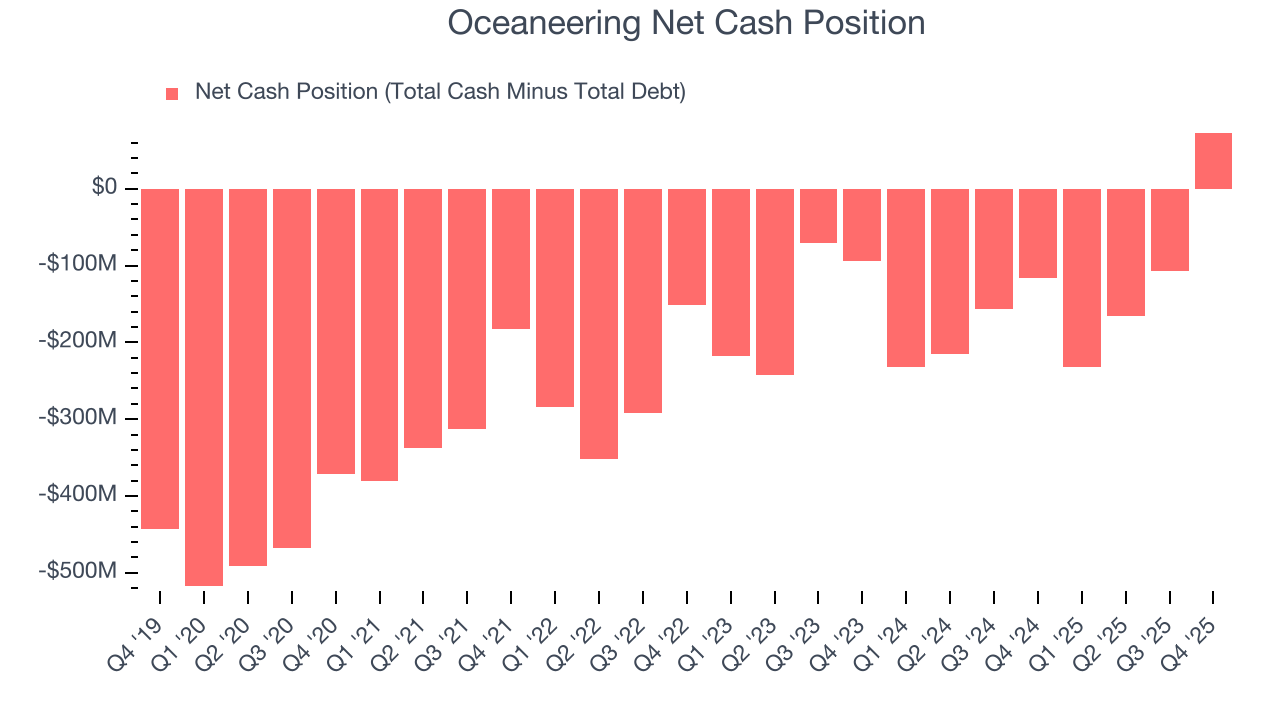
Oceaneering is a profitable, well-capitalized company with $688.9 million of cash and $615.9 million of debt on its balance sheet. This $73 million net cash position is 2% of its market cap and gives it the freedom to borrow money, return capital to shareholders, or invest in growth initiatives. Leverage is not an issue here.
12. Key Takeaways from Oceaneering’s Q4 Results
It was good to see Oceaneering beat analysts’ EPS expectations this quarter. We were also happy its EBITDA outperformed Wall Street’s estimates. On the other hand, its revenue slightly missed. Overall, this print had some key positives. Investors were likely hoping for more, and shares traded down 2.2% to $35.33 immediately following the results.
13. Is Now The Time To Buy Oceaneering?
Updated: March 16, 2026 at 1:09 AM EDT
Are you wondering whether to buy Oceaneering or pass? We urge investors to not only consider the latest earnings results but also longer-term business quality and valuation as well.
Oceaneering isn’t a terrible business, but it doesn’t pass our quality test. For starters, its revenue growth over the last five years was subpar for the sector, and analysts expect its demand to deteriorate over the next 12 months. While its rising returns show management's prior bets are at least better than before, the downside is its EBITDA margins reveal bottom-tier profitability compared to other energy upstream and integrated energy companies. On top of that, its gross margins show its business model is much less lucrative than other companies.
Oceaneering’s P/E ratio based on the next 12 months is 19.4x. Investors with a higher risk tolerance might like the company, but we think the potential downside is too great. We're pretty confident there are more exciting stocks to buy at the moment.
Wall Street analysts have a consensus one-year price target of $31.50 on the company (compared to the current share price of $33.05), implying they don’t see much short-term potential in Oceaneering.