Warby Parker (WRBY)
We’d invest in Warby Parker. Its revenue and EPS are projected to skyrocket next year, an optimistic sign for its share price.― StockStory Analyst Team
1. News


2. Summary
Why We Like Warby Parker
Founded in 2010, Warby Parker (NYSE:WRBY) designs, manufactures, and sells eyewear, including prescription glasses, sunglasses, and contact lenses, through its e-commerce platform and physical retail locations.
- Bold push to open new stores demonstrates an ambitious strategy to establish itself in underpenetrated territories
- Market share will likely rise over the next 12 months as its expected revenue growth of 12.5% is robust
- Earnings growth has trumped its peers over the last three years as its EPS has compounded at 134% annually


We’re optimistic about Warby Parker. There’s a lot to like here.
Is Now The Time To Buy Warby Parker?


Warby Parker is trading at $24.83 per share, or 54.6x forward P/E. The pricey valuation means expectations are high for this company over the near to medium term.
If you like the company and believe the bull case, we suggest making it a smaller position as our analysis shows high-quality companies outperform the market over a multi-year period regardless of valuation.
3. Warby Parker (WRBY) Research Report: Q4 CY2025 Update
Eyewear retailer Warby Parker (NYSE:WRBY) met Wall Street’s revenue expectations in Q4 CY2025, with sales up 11.2% year on year to $212 million. On the other hand, the company’s full-year revenue guidance of $967.5 million at the midpoint came in 2% below analysts’ estimates. Its GAAP loss of $0.05 per share was significantly below analysts’ consensus estimates.
Warby Parker (WRBY) Q4 CY2025 Highlights:
- Revenue: $212 million vs analyst estimates of $213 million (11.2% year-on-year growth, in line)
- EPS (GAAP): -$0.05 vs analyst estimates of $0.02 (significant miss)
- Adjusted EBITDA: $15.25 million vs analyst estimates of $19.89 million (7.2% margin, 23.3% miss)
- EBITDA guidance for the upcoming financial year 2026 is $118 million at the midpoint, below analyst estimates of $128.1 million
- Operating Margin: -3.2%, up from -4.9% in the same quarter last year
- Free Cash Flow Margin: 3.8%, up from 1.1% in the same quarter last year
- Market Capitalization: $2.66 billion
Company Overview
Founded in 2010, Warby Parker (NYSE:WRBY) designs, manufactures, and sells eyewear, including prescription glasses, sunglasses, and contact lenses, through its e-commerce platform and physical retail locations.
The company is known for its direct-to-consumer business model and initiatives such as the Home Try-On program and the "Buy a Pair, Give a Pair" social mission.
4. Beauty and Cosmetics Retailer
Beauty and cosmetics retailers understand that beauty is in the eye of the beholder, but a little lipstick, nail polish, and glowing skin also help the cause. These stores—which mostly cater to consumers but can also garner the attention of salon pros—aim to be a one-stop personal care and beauty products shop with many brands across many categories. E-commerce is changing how consumers buy cosmetics, so these retailers are constantly evolving to meet the customer where and how they want to shop.
Competitors in the eyewear retail industry include EssilorLuxottica (ENXTPA:EL), National Vision Holdings (NASDAQ:EYE), and EyeBuyDirect (private).
5. Revenue Growth
A company’s long-term sales performance can indicate its overall quality. Even a bad business can shine for one or two quarters, but a top-tier one grows for years.
With $871.9 million in revenue over the past 12 months, Warby Parker is a small retailer, which sometimes brings disadvantages compared to larger competitors benefiting from economies of scale and negotiating leverage with suppliers. On the bright side, it can grow faster because it has more white space to build new stores.
As you can see below, Warby Parker’s 13.4% annualized revenue growth over the last three years was solid as it opened new stores and expanded its reach.
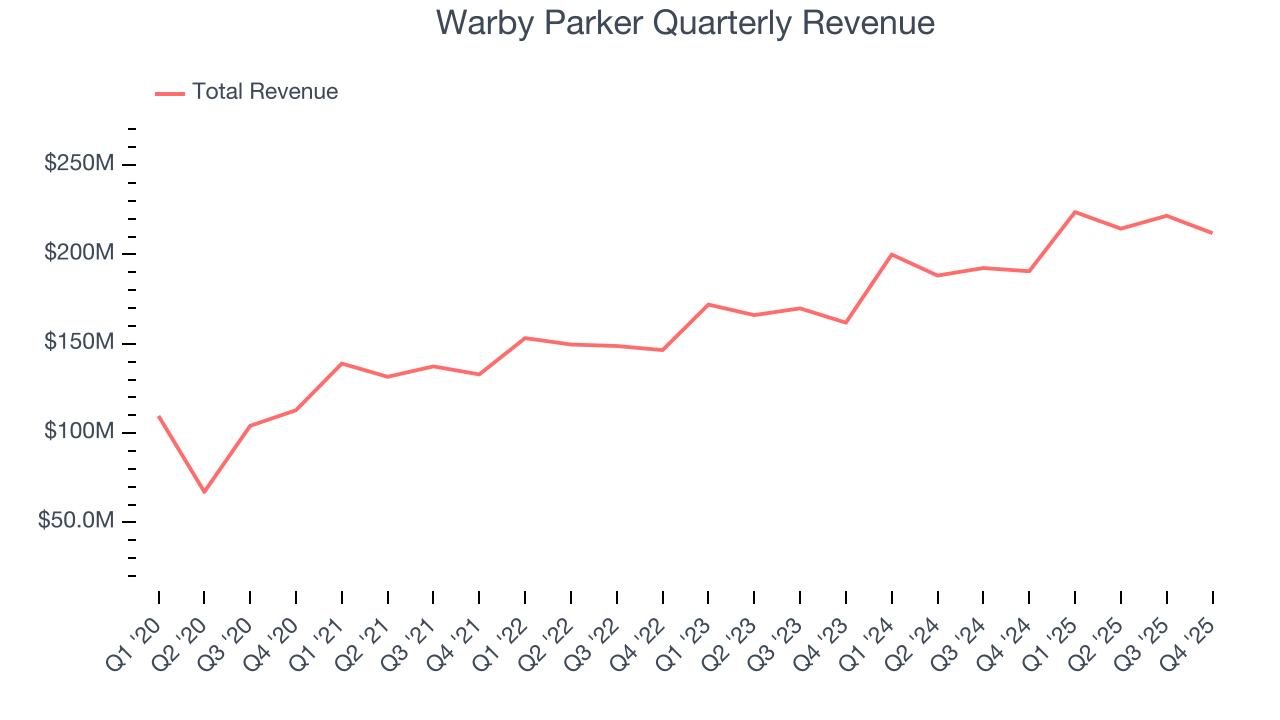
This quarter, Warby Parker’s year-on-year revenue growth was 11.2%, and its $212 million of revenue was in line with Wall Street’s estimates.
Looking ahead, sell-side analysts expect revenue to grow 13.8% over the next 12 months, similar to its three-year rate. This projection is eye-popping and implies the market is forecasting success for its products.
6. Number of Stores
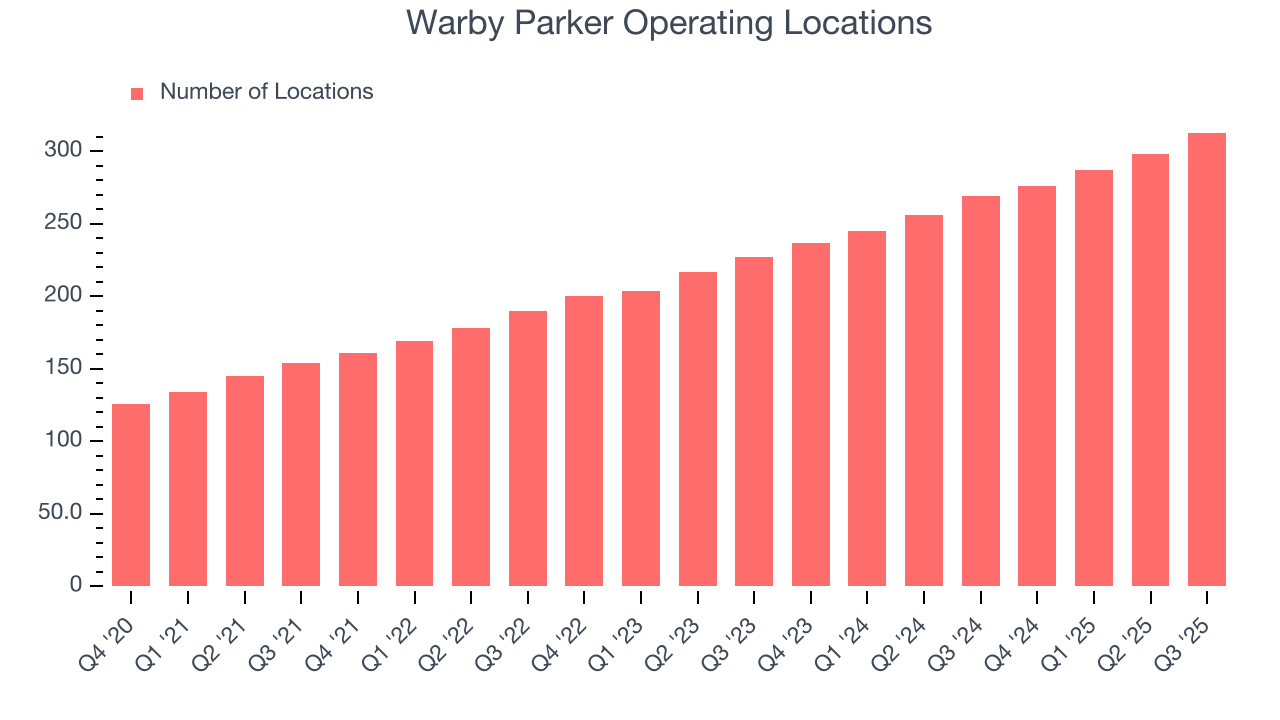
The number of stores a retailer operates is a critical driver of how quickly company-level sales can grow.
Warby Parker opened new stores at a rapid clip over the last two years, averaging 17.6% annual growth, much faster than the broader consumer retail sector. This gives it a chance to scale into a mid-sized business over time.
When a retailer opens new stores, it usually means it’s investing for growth because demand is greater than supply, especially in areas where consumers may not have a store within reasonable driving distance.
Note that Warby Parker reports its store count intermittently, so some data points are missing in the chart below.
7. Gross Margin & Pricing Power
Warby Parker has best-in-class unit economics for a retailer, enabling it to invest in areas such as marketing and talent. As you can see below, it averaged an elite 54.6% gross margin over the last two years. That means Warby Parker only paid its suppliers $45.39 for every $100 in revenue. 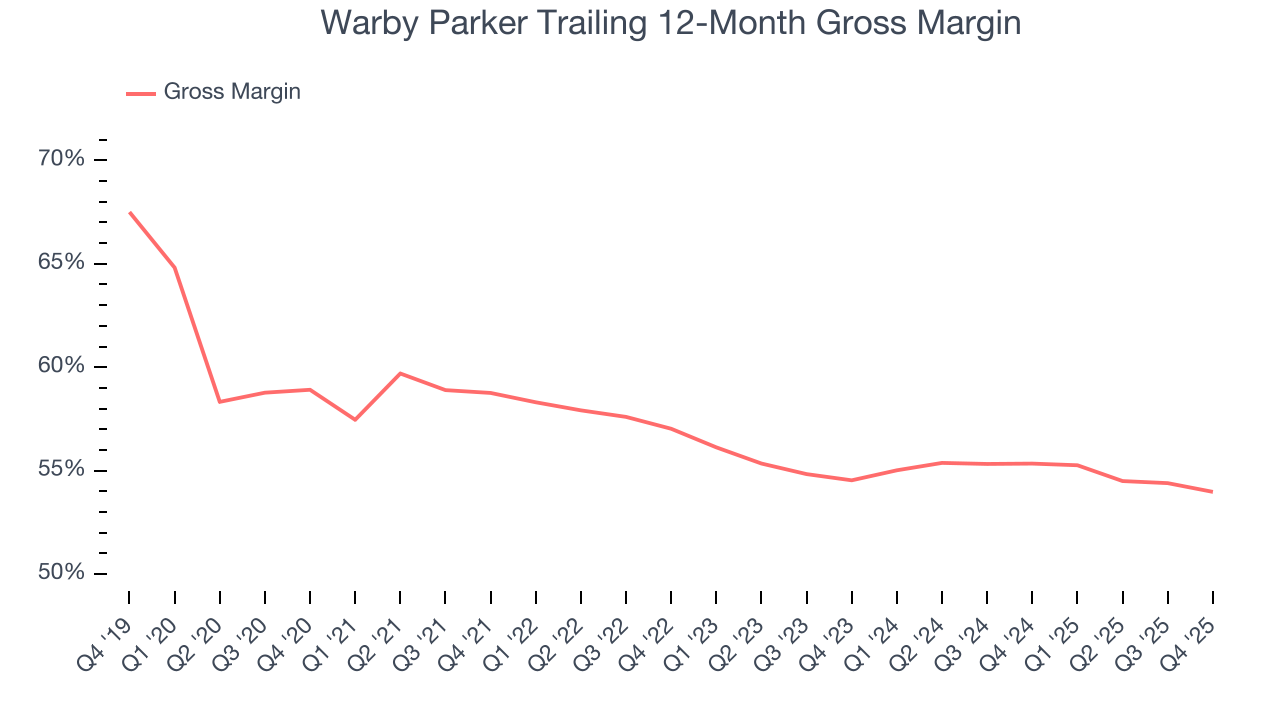
This quarter, Warby Parker’s gross profit margin was 52.4%, down 1.7 percentage points year on year. Warby Parker’s full-year margin has also been trending down over the past 12 months, decreasing by 1.4 percentage points. If this move continues, it could suggest a more competitive environment with some pressure to discount products and higher input costs (such as labor and freight expenses to transport goods).
8. Operating Margin
Operating margin is an important measure of profitability for retailers as it accounts for all expenses necessary to run a store, including wages, inventory, rent, advertising, and other administrative costs.
Despite the consumer retail industry’s secular decline, unprofitable public companies are few and far between. Unfortunately, Warby Parker was one of them over the last two years as its high expenses contributed to an average operating margin of negative 2.2%.
On the plus side, Warby Parker’s operating margin rose by 3.3 percentage points over the last year, as its sales growth gave it operating leverage. Still, it will take much more for the company to reach long-term profitability.
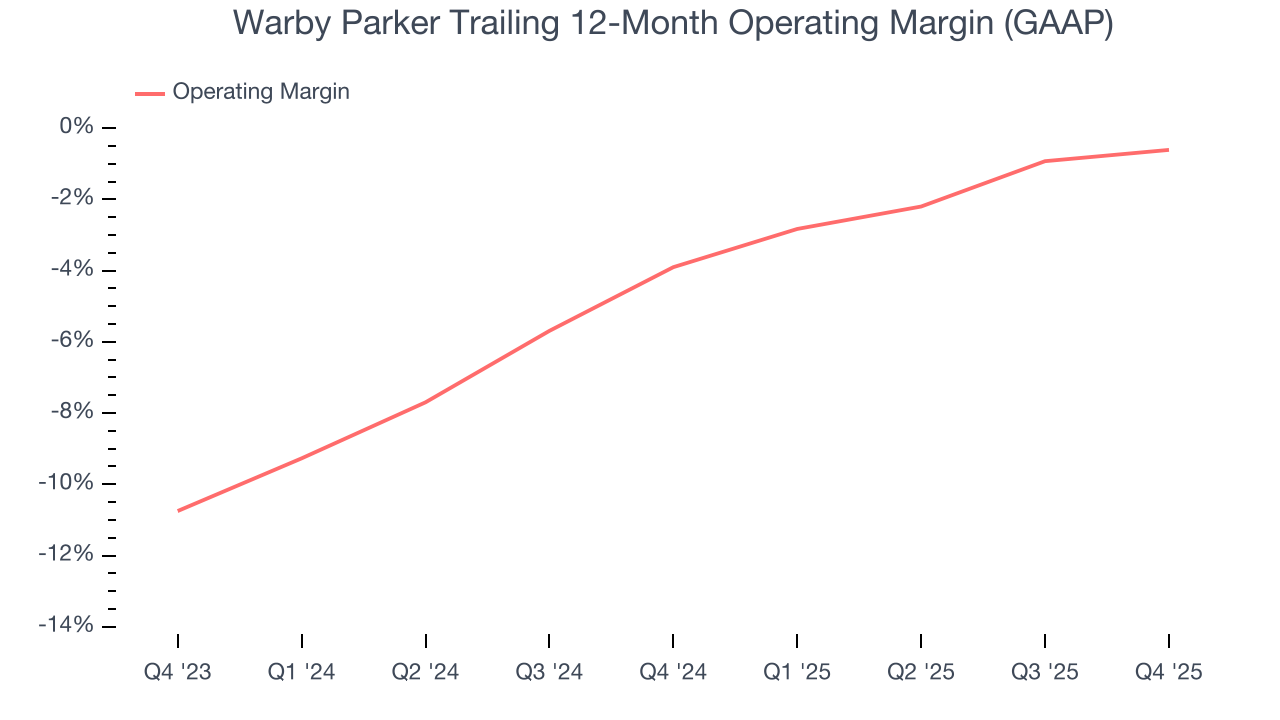
Warby Parker’s operating margin was negative 3.2% this quarter.
9. Earnings Per Share
Revenue trends explain a company’s historical growth, but the long-term change in earnings per share (EPS) points to the profitability of that growth – for example, a company could inflate its sales through excessive spending on advertising and promotions.
Warby Parker’s full-year EPS flipped from negative to positive over the last three years. This is a good sign and shows it’s at an inflection point.
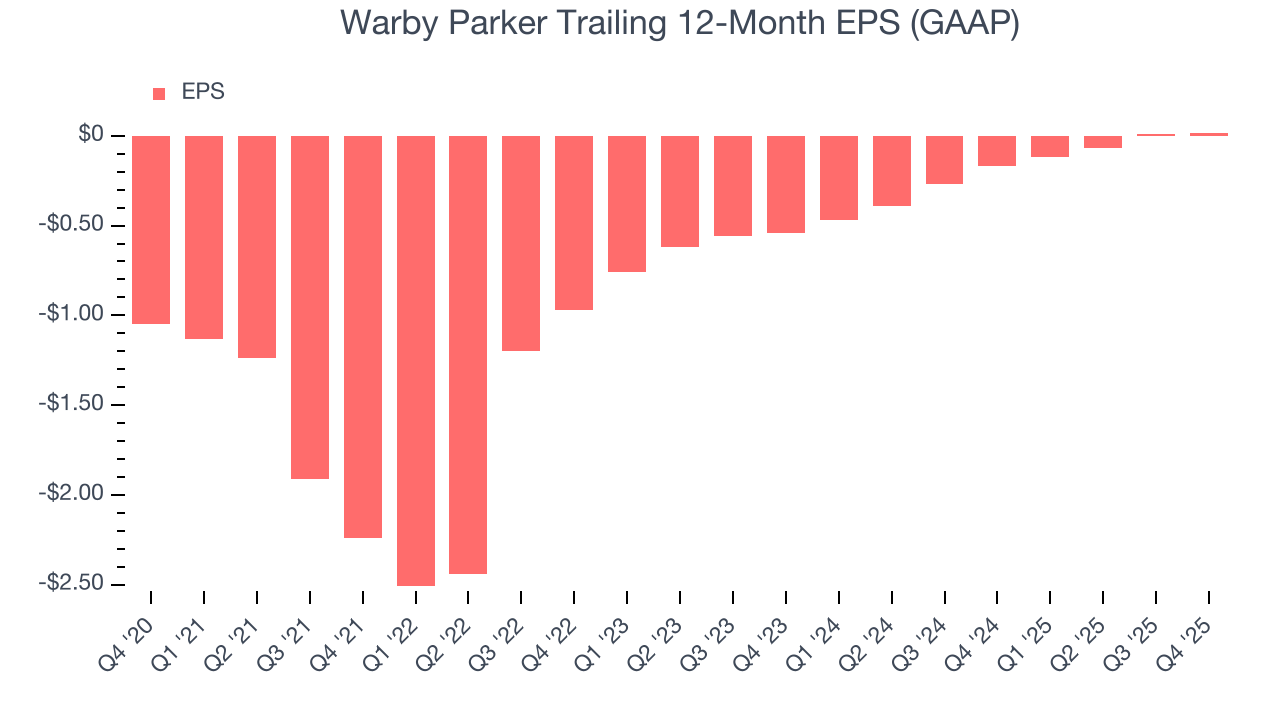
In Q4, Warby Parker reported EPS of negative $0.05, in line with the same quarter last year. This print missed analysts’ estimates, but we care more about long-term EPS growth than short-term movements. Over the next 12 months, Wall Street expects Warby Parker’s full-year EPS of $0.02 to grow 2,109%.
10. Cash Is King
If you’ve followed StockStory for a while, you know we emphasize free cash flow. Why, you ask? We believe that in the end, cash is king, and you can’t use accounting profits to pay the bills.
Warby Parker has shown impressive cash profitability, driven by its attractive business model that gives it the option to reinvest or return capital to investors. The company’s free cash flow margin averaged 4.7% over the last two years, better than the broader consumer retail sector. The divergence from its underwhelming operating margin stems from the add-back of non-cash charges like depreciation and stock-based compensation. GAAP operating profit expenses these line items, but free cash flow does not.
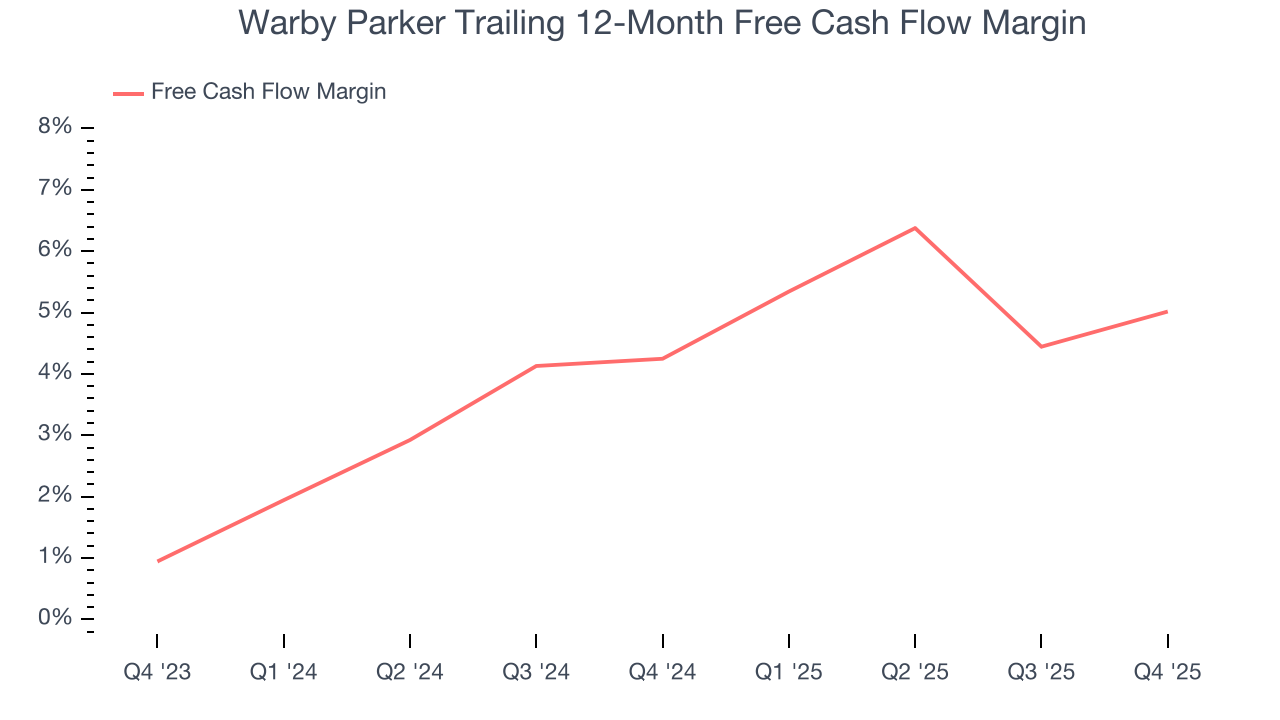
Warby Parker’s free cash flow clocked in at $8.13 million in Q4, equivalent to a 3.8% margin. This result was good as its margin was 2.7 percentage points higher than in the same quarter last year. We hope the company can build on this trend.
11. Balance Sheet Assessment
Companies with more cash than debt have lower bankruptcy risk.
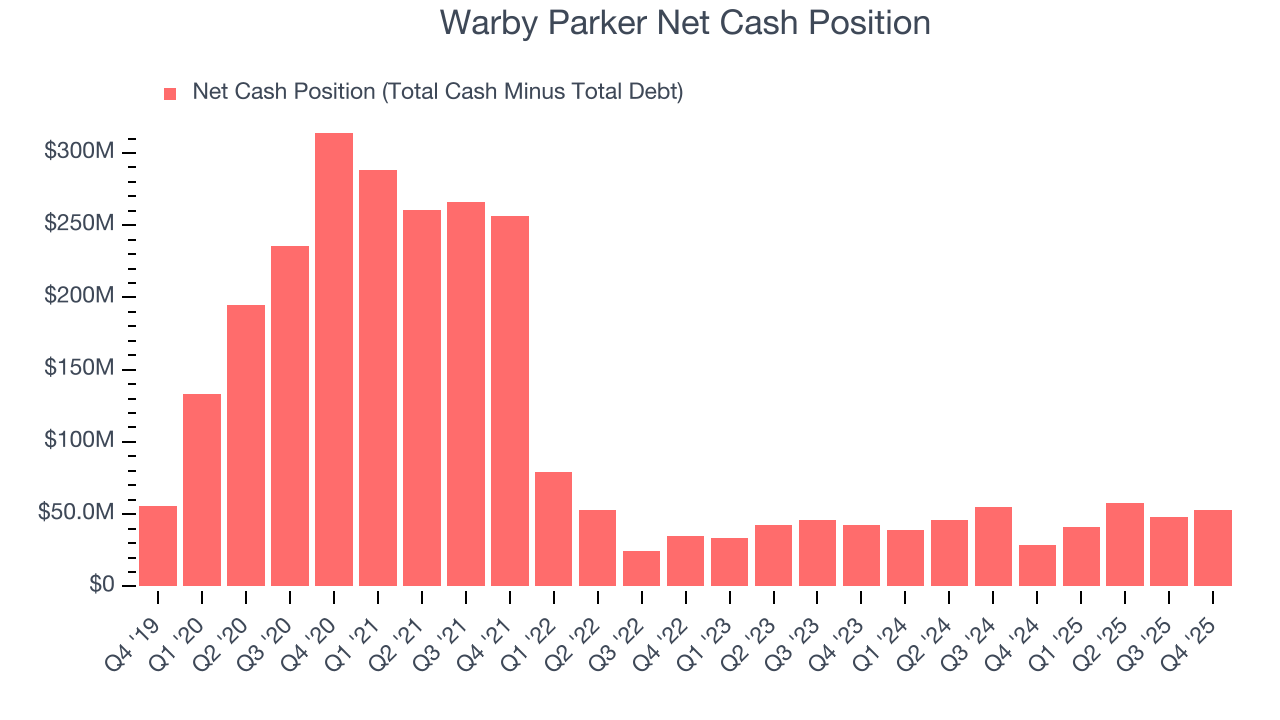
Warby Parker is a well-capitalized company with $286.4 million of cash and $233.1 million of debt on its balance sheet. This $53.21 million net cash position is 2% of its market cap and gives it the freedom to borrow money, return capital to shareholders, or invest in growth initiatives. Leverage is not an issue here.
12. Key Takeaways from Warby Parker’s Q4 Results
We struggled to find many positives in these results. Its full-year EBITDA guidance missed and its EBITDA fell short of Wall Street’s estimates. Overall, this was a weaker quarter. The stock traded down 8.5% to $19.93 immediately following the results.
13. Is Now The Time To Buy Warby Parker?
Updated: February 27, 2026 at 11:49 PM EST
The latest quarterly earnings matters, sure, but we actually think longer-term fundamentals and valuation matter more. Investors should consider all these pieces before deciding whether or not to invest in Warby Parker.
Warby Parker is an amazing business ranking highly on our list. First, the company’s revenue growth was good over the last three years, and analysts believe it can continue growing at these levels. And while its brand caters to a niche market, its new store openings have increased its brand equity. Additionally, Warby Parker’s projected EPS for the next year implies the company will continue generating shareholder value.
Warby Parker’s P/E ratio based on the next 12 months is 54.6x. There’s no doubt it’s a bit of a market darling given the lofty multiple, but we don’t mind owning a high-quality business, even if it’s expensive. We’re in the camp that investments like this should be held for at least three to five years to negate the short-term price volatility that can come with high valuations.
Wall Street analysts have a consensus one-year price target of $28.33 on the company (compared to the current share price of $24.83).