
Golar LNG (GLNG)
We’re skeptical of Golar LNG. Its low returns on capital and plummeting sales suggest it struggles to generate demand and profits, a red flag.― StockStory Analyst Team
1. News
2. Summary
Why We Think Golar LNG Will Underperform
Pioneering a way to monetize stranded gas reserves that would otherwise be uneconomical to develop, Golar LNG (NASDAQ:GLNG) converts ships into floating liquefied natural gas facilities that liquefy natural gas at offshore sites.
- Sales tumbled by 2.7% annually over the last five years, showing market trends are working against its favor during this cycle
- Smaller revenue base of $393.5 million means it hasn’t achieved the economies of scale that some industry juggernauts enjoy
- Depletion of cash reserves could lead to a fundraising event that triggers shareholder dilution


Golar LNG’s quality doesn’t meet our expectations. There are superior stocks for sale in the market.
Why There Are Better Opportunities Than Golar LNG


Golar LNG’s stock price of $45.15 implies a valuation ratio of 64.7x forward P/E. This valuation multiple seems a bit much considering the quality you get.
There are stocks out there featuring similar valuation multiples with better fundamentals. We prefer to invest in those.
3. Golar LNG (GLNG) Research Report: Q4 CY2025 Update
Floating LNG company Golar LNG (NASDAQ:GLNG) announced better-than-expected revenue in Q4 CY2025, with sales up 103% year on year to $132.8 million. Its GAAP profit of $0.10 per share was 72.6% below analysts’ consensus estimates.
Golar LNG (GLNG) Q4 CY2025 Highlights:
- Revenue: $132.8 million vs analyst estimates of $131.2 million (103% year-on-year growth, 1.2% beat)
- EPS (GAAP): $0.10 vs analyst expectations of $0.37 (72.6% miss)
- Adjusted EBITDA: $79.92 million vs analyst estimates of $84.32 million (60.2% margin, 5.2% miss)
- Operating Margin: 36.1%, up from 12.7% in the same quarter last year
- Free Cash Flow was -$237.7 million compared to -$73.53 million in the same quarter last year
- Market Capitalization: $4.82 billion
Company Overview
Pioneering a way to monetize stranded gas reserves that would otherwise be uneconomical to develop, Golar LNG (NASDAQ:GLNG) converts ships into floating liquefied natural gas facilities that liquefy natural gas at offshore sites.
The company specializes in designing and operating floating liquefied natural gas (FLNG) vessels, which are essentially offshore factories that convert natural gas into LNG directly at sea. This approach eliminates the need for expensive onshore liquefaction plants and pipelines, making it economically viable to develop gas fields that are too remote or too small to justify traditional infrastructure. Golar takes existing LNG carriers—ships originally designed to transport LNG—and retrofits them with liquefaction equipment, transforming them into floating production facilities.
The company's fleet currently includes FLNG Hilli, which has been operating offshore Cameroon since 2018 and is being redeployed to Argentina to process gas from the Vaca Muerta shale formation, and FLNG Gimi, which began commissioning activities offshore Mauritania and Senegal in 2024 for BP's Greater Tortue Ahmeyim project. A third vessel, the MKII FLNG, is undergoing conversion in China with expected delivery in 2027. These vessels have production capacities ranging from 2.45 to 3.5 million tonnes per annum.
Golar's customers are typically energy companies or governments seeking to monetize gas reserves. For instance, a gas field discovered far offshore might have enough reserves to be valuable but not enough to justify building an onshore LNG plant and subsea pipeline infrastructure. In such cases, Golar positions an FLNG vessel at the field, where it receives gas through flexible risers, processes and liquefies it onboard, stores the LNG in the vessel's tanks, and offloads it to LNG carriers for transport to buyers. The company generates revenue through long-term tolling agreements, typically spanning 20 years, where customers pay fees based on the vessel's liquefaction capacity and usage.
4. Infrastructure
Energy infrastructure companies build, own, and operate assets including pipelines, storage facilities, and processing plants that transport and handle oil, natural gas, and related products. These businesses often generate fee-based revenues providing cash flow stability. Tailwinds include growing production volumes requiring expanded takeaway capacity and export infrastructure demand. Long-term contracts with creditworthy counterparties reduce commodity price exposure. Headwinds include permitting and regulatory challenges delaying new projects, environmental opposition to pipeline construction, and potential long-term demand decline from energy transition. High capital intensity and interest rate sensitivity affecting financing costs present additional considerations.
Golar LNG's competitors include other FLNG operators such as Shell, which operates the Prelude FLNG offshore Australia, and Eni, along with traditional onshore LNG developers and modular LNG solution providers.
5. Revenue Scale
The scale of a company’s revenue base is an important lens through which to view the topline, as it signals whether a producer has gone from a vulnerable commodity taker into a durable operating platform. Larger producers generate revenue across many wells, pads, takeaway routes, and geographies rather than relying on a single field or drilling program. Golar LNG’s $393.5 million of revenue in the last year is pretty small for the industry, suggesting the type of diversification that reduces operational risk.
6. Revenue Growth
Cyclical industries such as Energy can make mediocre companies look great for a time, but a long-term view reveals which businesses can actually withstand and adapt to changing conditions. Golar LNG’s demand was weak over the last five years as its sales fell at a 2.7% annual rate. This was below our standards and is a tough starting point for our analysis.
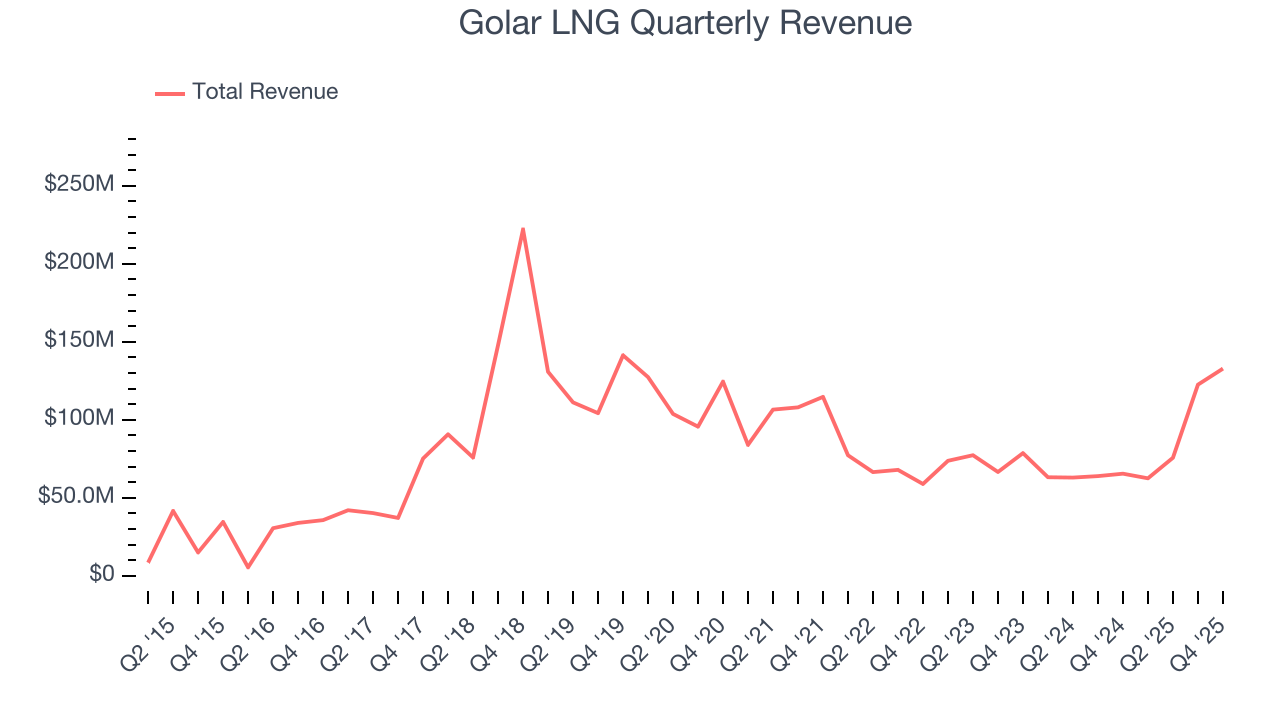
Within Energy, a singular timeframe, even if it’s quite long-term, only sheds light on how well a company rode the last commodity cycle. To better assess whether a company compounds through cycles, we validate our view with an even longer, ten-year view. Golar LNG’s annualized revenue growth of 14.7% over the last ten years is above its five-year trend.
Revenue provides useful context, but it is heavily influenced by commodity prices and acquisitions. Production volumes, by contrast, reveal whether the underlying asset base is actually growing. Over the last two years, Golar LNG’s total oil volume per day - Upstream averaged 20% year-on-year growth. 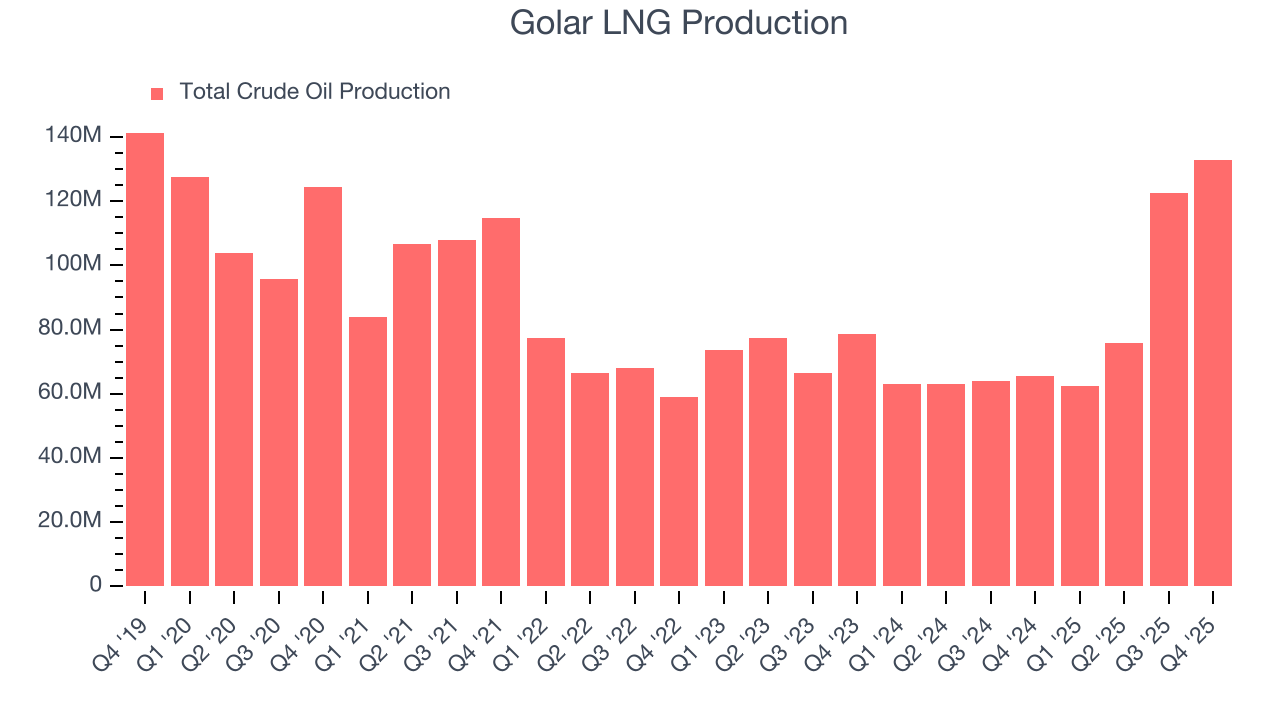
This quarter, Golar LNG reported magnificent year-on-year revenue growth of 103%, and its $132.8 million of revenue beat Wall Street’s estimates by 1.2%. This quarter, Golar LNG reported magnificent year-on-year production growth of 103%, and its 132,812 Mboe (thousand barrels of oil equivalent) of production beat Wall Street’s estimates by 1.2%.
7. Gross Margin
While energy gross margins can be distorted by commodity prices, hedging, and short-term cost swings, sustained margins across a full cycle reflect a producer’s underlying asset quality, infrastructure position, and cost structure.
Golar LNG, which averaged 63.4% gross margin over the last five years, exhibits good unit economics in the sector. It means the company will remain profitable at lower commodity prices than peers with inferior gross margins and serves as an encouraging starting point for ultimate operating profits and free cash flow generation. 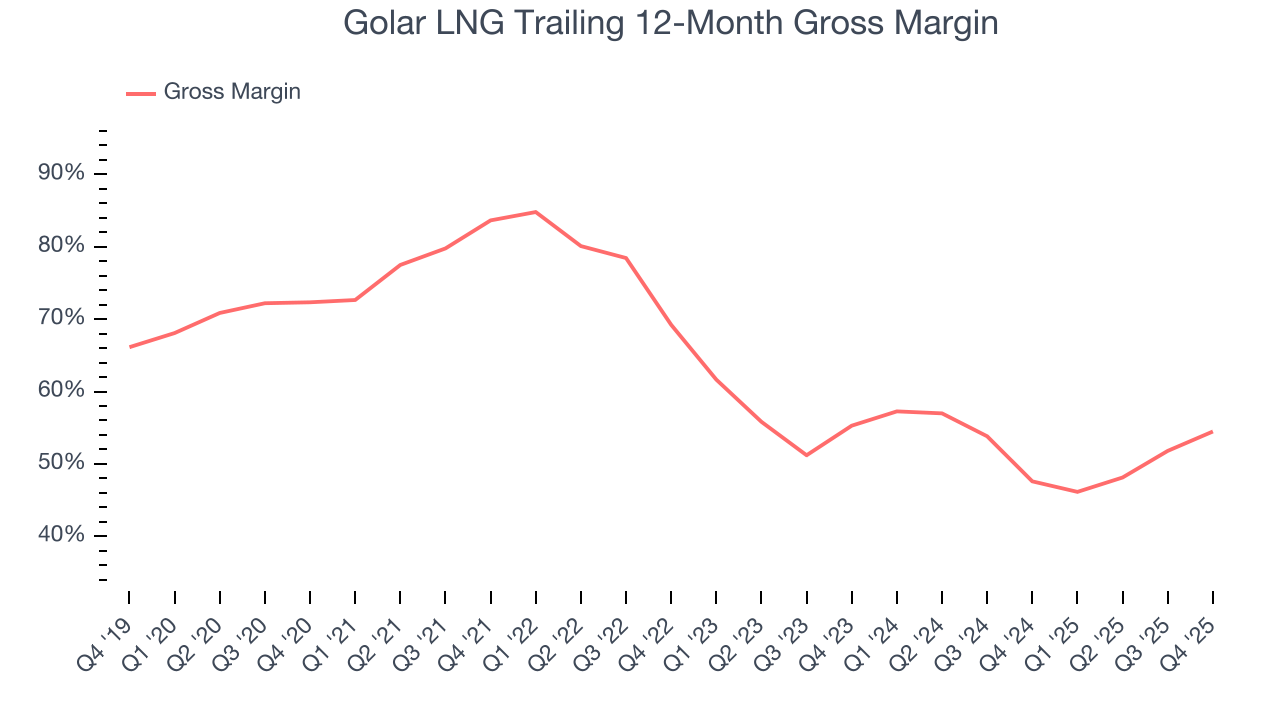
Golar LNG produced a 58.5% gross profit margin in Q4 , marking a 9.2 percentage point increase from 49.3% in the same quarter last year. Note that energy margins can be volatile due to commodity price changes.
8. Adjusted EBITDA Margin
Adjusted EBITDA margin captures the true operating profitability of an energy producer by removing accounting noise around depletion and capitalized drilling costs. It reveals how much cash the asset base generates before capital structure and reinvestment requirements shape reported earnings.
Golar LNG has been a well-oiled machine over the last five years. It demonstrated elite profitability for an upstream and integrated energy business, boasting an average EBITDA margin of 74.1%.
Analyzing the trend in its profitability, Golar LNG’s EBITDA margin rose by 9.6 percentage points over the last year, as its sales growth gave it operating leverage.
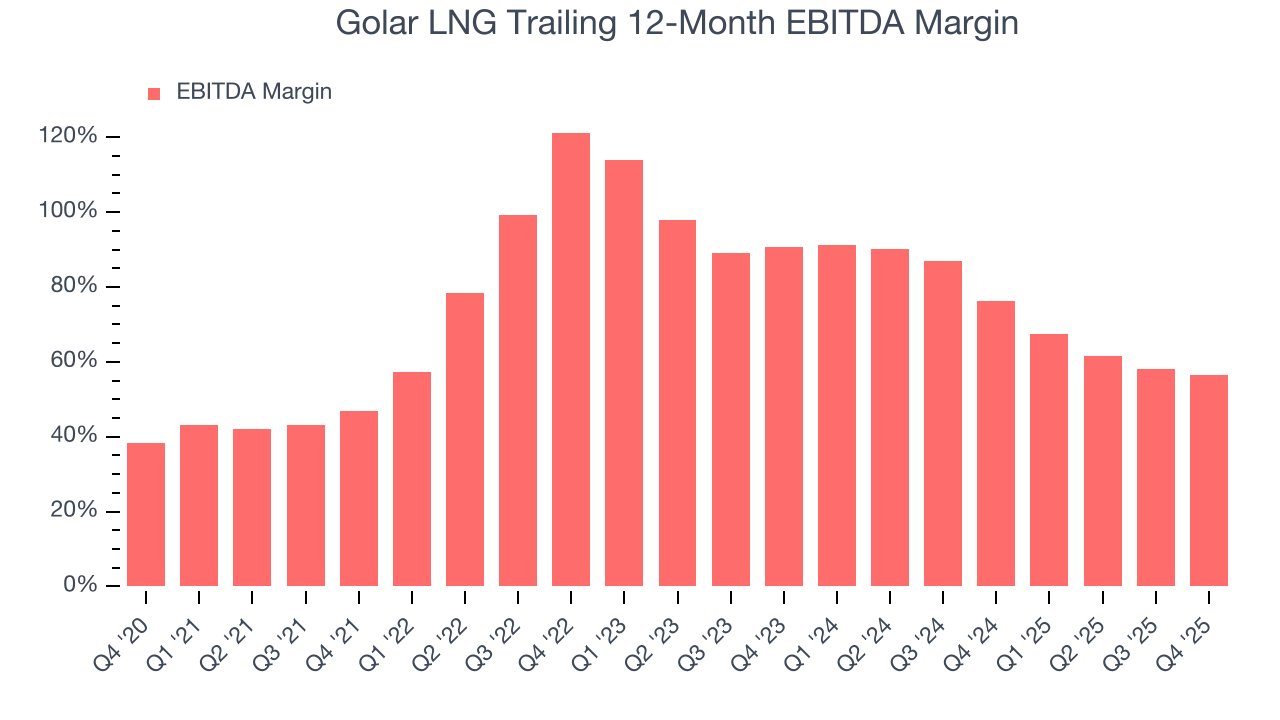
In Q4, Golar LNG generated an EBITDA margin profit margin of 60.2%, down 12.8 percentage points year on year. This contraction shows it was less efficient because its expenses grew faster than its revenue. This adjusted EBITDA fell short of Wall Street’s estimates.
9. Cash Is King
As mentioned above, adjusted EBITDA ignores capital structure and drilling expenditure decisions. These are two huge aspects of an Energy producer, so in order to understand a comprehensive picture of business quality, an investor needs to account for these. Said differently, adjusted EBITDA margins could be solid but free cash flow is abysmal because decline rates of the asset are extreme and the drilling is expensive. Free cash flow tells you about not only the economics of the production that has happened but how much it costs to stay in business as well (further drilling or extraction).
Golar LNG’s demanding reinvestments have drained its resources over the last five years, putting it in a pinch and limiting its ability to return capital to investors. Its free cash flow margin averaged negative 79.9%, meaning it lit $79.88 of cash on fire for every $100 in revenue.
The level of free cash flow is important, but its durability across cycles is just as critical. Consistent margins are far more valuable than volatile swings driven by commodity prices.
Golar LNG’s ratio of quarterly free cash flow volatility to WTI crude price volatility over the past five years was 8.4 (lower is better), indicating reasonable insulation from commodity swings.
You may be asking why we wait until the free cash flow line to perform this stability analysis versus commodity prices. Why not compare revenue or EBITDA to WTI in the case of Golar LNG? Because what ultimately matters is not how much revenue or profit you earn when prices are high but how much cash you can generate when prices are low. Free cash flow is the superior metric because it includes everything from hedging prowess to growth and maintenance capex to management behavior during good times and bad.
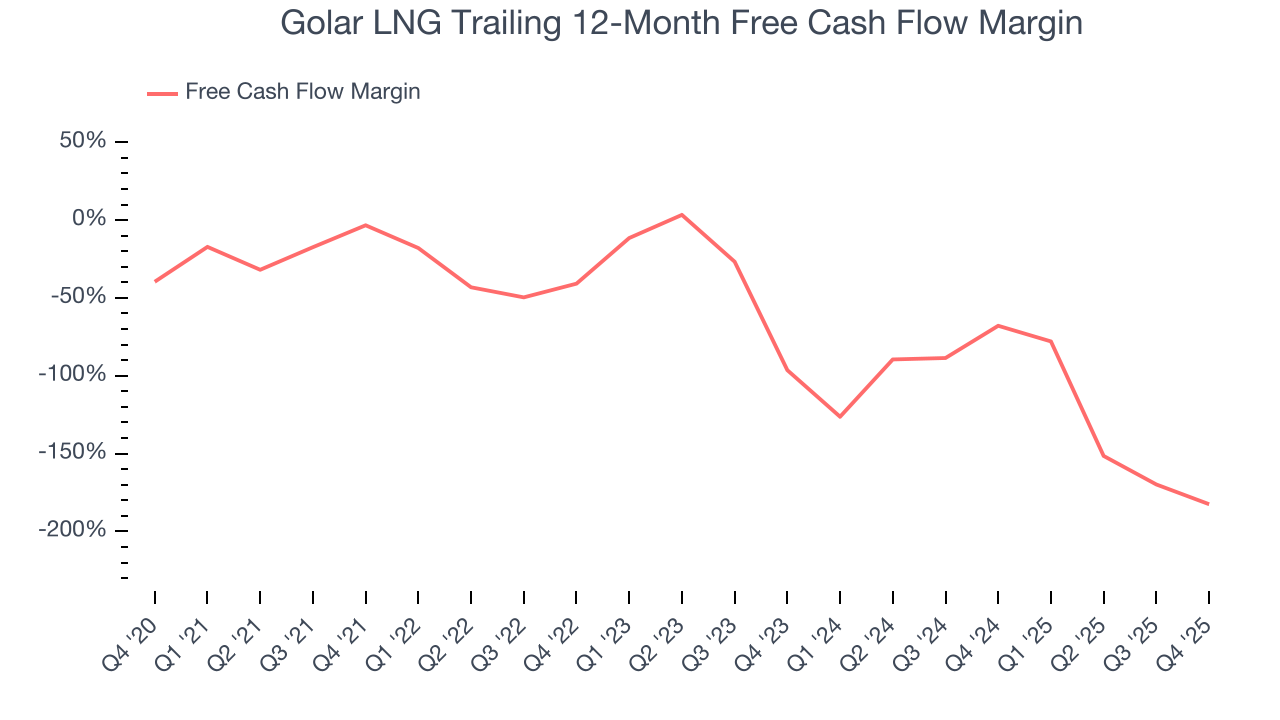
Golar LNG burned through $237.7 million of cash in Q4, equivalent to a negative 179% margin. The company’s cash burn increased from $73.53 million of lost cash in the same quarter last year.
10. Return on Invested Capital (ROIC)
Free cash flow shows how much money a producer generated, while ROIC shows how efficiently that money was earned. ROIC measures the operating profit produced for each dollar of capital invested, whether from debt or equity. Cash generation measures quantity while ROIC measures the quality of value creation.
We at StockStory like to look at ROIC over a ten-year period because energy investment cycles can involve up to five years of ramping production and another five years of harvesting. A decade view captures buying, extracting, and monetizing rather than just part of that picture. Golar LNG historically did a mediocre job investing in profitable growth initiatives. Its ten-year average ROIC was 5.7%, somewhat low compared to the best energy upstream and integrated energy companies that consistently pump out 25%+.
We like to invest in businesses with high returns, but the trend in a company’s ROIC is what often surprises the market and moves the stock price. Unfortunately, Golar LNG’s ROIC has decreased significantly over the last few years. Paired with its already low returns, these declines suggest its profitable growth opportunities are few and far between.
11. Balance Sheet Risk
As long-term investors, the risk we care about most is the permanent loss of capital, which can happen when a company goes bankrupt or raises money from a disadvantaged position. This is separate from short-term stock price volatility, something we are much less bothered by.
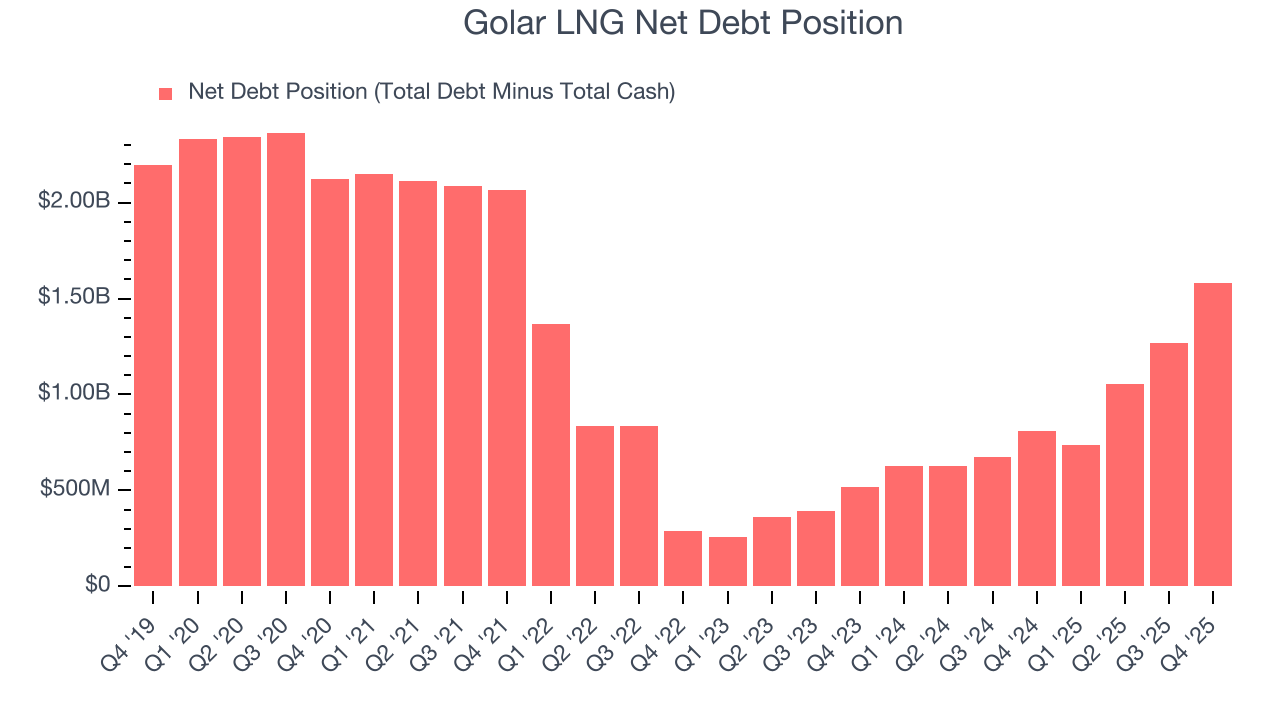
Golar LNG burned through $718.2 million of cash over the last year, and its $2.76 billion of debt exceeds the $1.18 billion of cash on its balance sheet. This is a deal breaker for us because indebted loss-making companies spell trouble.
Unless the Golar LNG’s fundamentals change quickly, it might find itself in a position where it must raise capital from investors to continue operating. Whether that would be favorable is unclear because dilution is a headwind for shareholder returns.
We remain cautious of Golar LNG until it generates consistent free cash flow or any of its announced financing plans materialize on its balance sheet.
12. Key Takeaways from Golar LNG’s Q4 Results
It was good to see Golar LNG narrowly top analysts’ revenue expectations this quarter. We were also happy its production narrowly outperformed Wall Street’s estimates. On the other hand, its EPS missed and its EBITDA fell short of Wall Street’s estimates. Overall, this was a weaker quarter. The stock traded down 1.4% to $44.94 immediately after reporting.
13. Is Now The Time To Buy Golar LNG?
Updated: March 13, 2026 at 1:06 AM EDT
We think that the latest earnings result is only one piece of the bigger puzzle. If you’re deciding whether to own Golar LNG, you should also grasp the company’s longer-term business quality and valuation.
Golar LNG isn’t a terrible business, but it doesn’t pass our quality test. For starters, its revenue has declined over the last five years. While its revenue growth over the last ten years was top-tier for the sector, the downside is its cash burn raises the question of whether it can sustainably maintain growth. On top of that, its subscale operations hasn't hit a level of diversification where investors can sleep easy at night.
Golar LNG’s P/E ratio based on the next 12 months is 64.7x. This multiple tells us a lot of good news is priced in - you can find more timely opportunities elsewhere.
Wall Street analysts have a consensus one-year price target of $52.06 on the company (compared to the current share price of $45.15).
Although the price target is bullish, readers should exercise caution because analysts tend to be overly optimistic. The firms they work for, often big banks, have relationships with companies that extend into fundraising, M&A advisory, and other rewarding business lines. As a result, they typically hesitate to say bad things for fear they will lose out. We at StockStory do not suffer from such conflicts of interest, so we’ll always tell it like it is.