
TechnipFMC (FTI)
We’re wary of TechnipFMC. Its falling revenue and negative returns on capital suggest it’s destroying value as demand fizzles out.― StockStory Analyst Team
1. News
2. Summary
Why We Think TechnipFMC Will Underperform
Operating a fleet of 16 specialized vessels that install equipment on the seafloor, TechnipFMC (NYSE:FTI) designs and manufactures subsea systems that control the flow of oil and natural gas from the ocean floor to processing facilities.
- Sales tumbled by 5.3% annually over the last five years, showing market trends are working against its favor during this cycle
- Costly operations and weak unit economics result in an inferior gross margin of 17.5% that must be offset through higher production volumes
- On the bright side, its unparalleled revenue scale of $9.93 billion gives it advantageous pricing and terms with suppliers


TechnipFMC doesn’t meet our quality standards. There are more promising prospects in the market.
Why There Are Better Opportunities Than TechnipFMC


TechnipFMC’s stock price of $65.68 implies a valuation ratio of 22.1x forward P/E. This multiple is high given its weaker fundamentals.
It’s better to pay up for high-quality businesses with strong long-term earnings potential rather than to buy lower-quality companies with open questions and big downside risks.
3. TechnipFMC (FTI) Research Report: Q4 CY2025 Update
Subsea energy systems provider TechnipFMC (NYSE:FTI) missed Wall Street’s revenue expectations in Q4 CY2025, but sales rose 6.3% year on year to $2.52 billion. Its non-GAAP profit of $0.70 per share was 35.5% above analysts’ consensus estimates.
TechnipFMC (FTI) Q4 CY2025 Highlights:
- Revenue: $2.52 billion vs analyst estimates of $2.55 billion (6.3% year-on-year growth, 1.2% miss)
- Adjusted EPS: $0.70 vs analyst estimates of $0.52 (35.5% beat)
- Adjusted EBITDA: $440.5 million vs analyst estimates of $436.7 million (17.5% margin, 0.9% beat)
- Operating Margin: 11.2%, up from 9.5% in the same quarter last year
- Free Cash Flow Margin: 14.3%, down from 19.1% in the same quarter last year
- Market Capitalization: $25.96 billion
Company Overview
Operating a fleet of 16 specialized vessels that install equipment on the seafloor, TechnipFMC (NYSE:FTI) designs and manufactures subsea systems that control the flow of oil and natural gas from the ocean floor to processing facilities.
The company's business is built around the Subsea segment, which provides the infrastructure that sits on the ocean floor in offshore oil and gas production. This includes subsea trees, which are large valve assemblies that control well flow; manifolds that collect production from multiple wells; and the umbilicals, risers, and flowlines that transport hydrocarbons and provide power and control signals. These systems must withstand extreme conditions, including deepwater pressures and internal pressures up to 20,000 pounds per square inch at temperatures reaching 400 degrees Fahrenheit.
TechnipFMC has pioneered an integrated project delivery model called iEPCI, which combines engineering, procurement, construction, and installation under a single contract. Rather than having separate companies design the production system, build the pipelines, and install everything, TechnipFMC handles the entire scope. For example, an oil company developing a deepwater field offshore Brazil might engage TechnipFMC to perform an integrated front-end engineering and design study, then award the full subsea infrastructure contract directly based on that work, allowing TechnipFMC to optimize the field layout and equipment specifications from the start.
The company also provides life-of-field services, including maintenance and production optimization using remotely operated vehicles from its Schilling Robotics division. Its Surface Technologies segment, a smaller part of the business, supplies wellhead systems, pressure control equipment, and hydraulic fracturing systems for onshore and shallow water production. TechnipFMC generates revenue from equipment sales and installation contracts with major integrated oil companies, national oil companies, and independent exploration and production firms worldwide.
4. Oilfield Services
Oilfield services companies provide equipment, technology, and services enabling exploration and production activities, including drilling, completion, well intervention, and reservoir evaluation. Their fortunes closely track upstream capital spending cycles. Tailwinds include increased drilling activity during favorable commodity environments, demand for efficiency-enhancing technologies, and growing offshore and unconventional resource development. Headwinds include significant revenue volatility tied to oil and gas price swings and producer spending discipline. Intense competition pressures pricing and margins, while the energy transition may structurally reduce long-term demand. Workforce availability and technological disruption require continuous adaptation.
TechnipFMC competes with Baker Hughes (NASDAQ:BKR), Schlumberger's OneSubsea joint venture with Subsea 7 (OB:SUBC), McDermott International, NOV (NYSE:NOV), and Oceaneering International (NYSE:OII).
5. Economies of Scale
The size of the revenue base is a way to assess topline, and it tells an investor whether an Energy producer has crossed the line between being a more vulnerable commodity taker and a durable operating platform. Scaled businesses tend to produce and generate revenue from many wells, pads, takeaway routes, and geographies, not just a single field or drilling program. TechnipFMC’s $9.93 billion of revenue in the last year is top-tier for the industry, suggesting the type of diversification that reduces operational risk.
6. Revenue Growth
Cyclical sectors like Energy often flatter weaker operators during favorable price environments, but a longer-term lens separates those from businesses that can consistently perform across market cycles. TechnipFMC’s demand was weak over the last five years as its sales fell at a 5.3% annual rate. This was below our standards and suggests it’s a lower quality business.
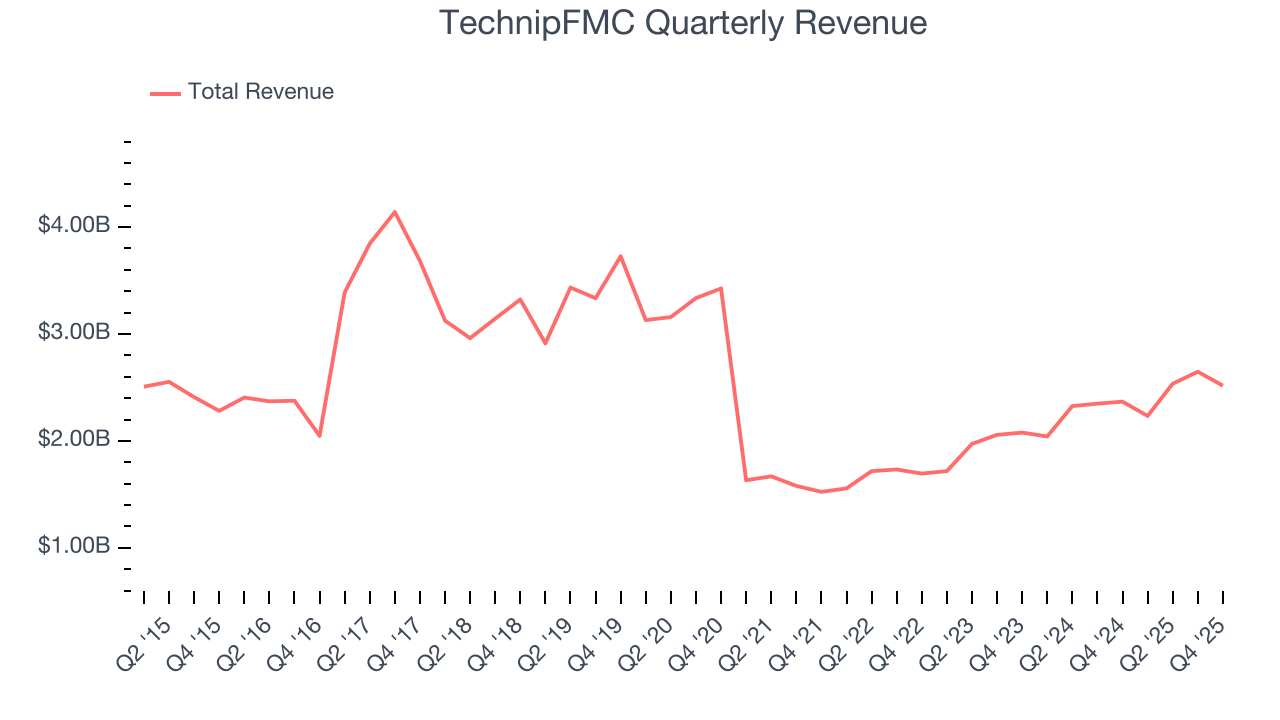
Even a long stretch in Energy can be shaped by a single commodity cycle, so extending the view to ten years adds another perspective and reveals which companies are built to grow regardless of the pricing regime. TechnipFMC’s annualized revenue growth of 0.2% over the last ten years is above its five-year trend, suggesting some bright spots.
This quarter, TechnipFMC’s revenue grew by 6.3% year on year to $2.52 billion, missing Wall Street’s estimates.
7. Gross Margin
While energy gross margins can be distorted by commodity prices, hedging, and short-term cost swings, sustained margins across a full cycle reflect a producer’s underlying asset quality, infrastructure position, and cost structure.
TechnipFMC, which averaged 17.5% gross margin over the last five years, exhibiting bottom-tier unit economics in the sector. It means the company will struggle at higher commodity prices than peers with better gross margins. 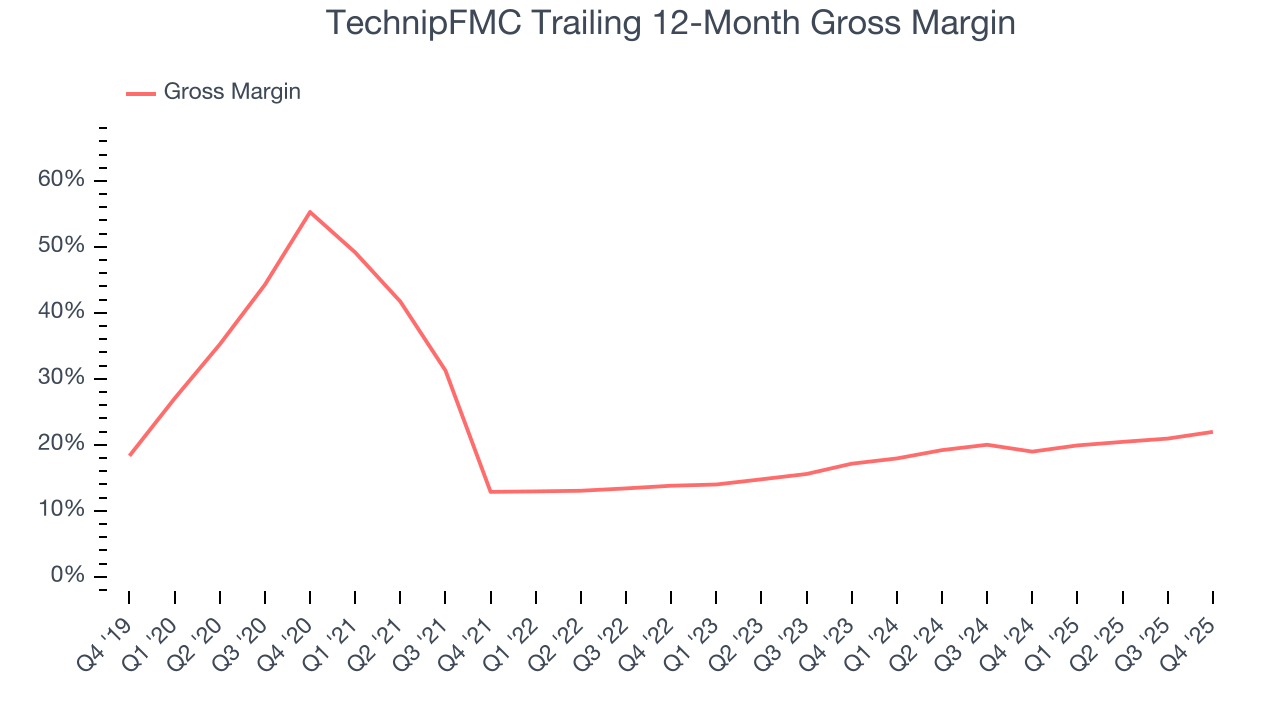
TechnipFMC’s gross profit margin came in at 20.6% this quarter , marking a 4.3 percentage point increase from 16.3% in the same quarter last year. Note that energy margins can be volatile due to commodity price changes.
8. Adjusted EBITDA Margin
Adjusted EBITDA margin is an important measure of profitability for the sector and accounts for the gross margins and operating costs mentioned previously. Unlike operating margin, it is not distorted by accounting conventions around reserves, drilling costs, and assumptions on commodity consumption from the well or basin. Adjusted EBITDA highlights the economic reality of how much cash the rock produces before the capital structure (debt service) and the drilling budget (capex) are considered.
TechnipFMC was profitable over the last five years but held back by its large cost base. Its average EBITDA margin of 13.1% was among the worst in the energy upstream and integrated energy sector.
On the plus side, TechnipFMC’s EBITDA margin rose by 9.3 percentage points over the last year.
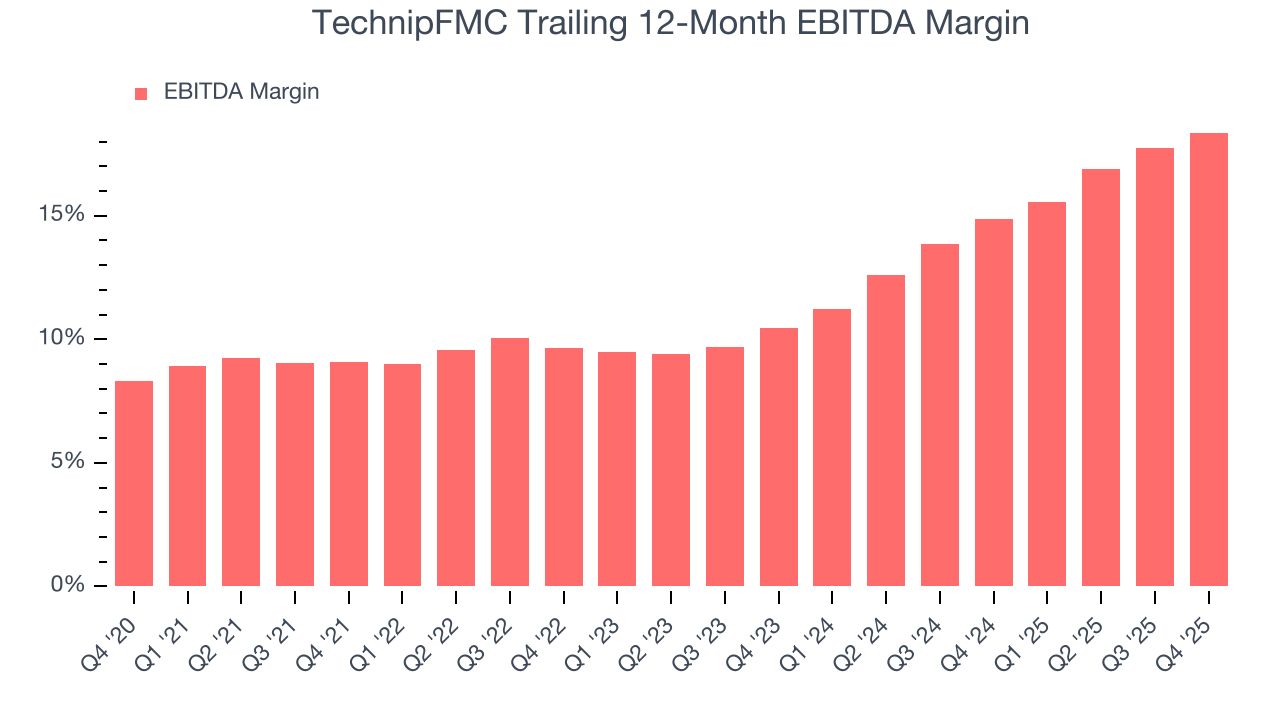
This quarter, TechnipFMC generated an EBITDA margin profit margin of 17.5%, up 2.7 percentage points year on year. This increase was a welcome development and shows it was more efficient. This adjusted EBITDA beat Wall Street’s estimates by 0.9%.
9. Cash Is King
Adjusted EBITDA shows how profitable a company’s existing “rock” is before financing and reinvestment, while free cash flow shows how much value remains after paying to replace those wells. Because production declines over time, strong EBITDA can coexist with weak FCF if drilling is expensive or declines are steep. FCF therefore captures both operating efficiency and the cost of sustaining production.
TechnipFMC has shown decent cash profitability, giving it some flexibility to reinvest or return capital to investors. The company’s free cash flow margin averaged 8.5% over the last five years, slightly better than the broader energy upstream and integrated energy sector.
Absolute FCF margin levels matter but so does stability of free cash flow. All else equal, we’d prefer a 25.0% average free cash flow margin that is quite steady no matter how commodity prices behave rather than extremely high margins when times are good and negative ones when they’re tough.
TechnipFMC’s ratio of quarterly free cash flow volatility to WTI crude price volatility over the past five years was 10.7 (lower is better), indicating that its cash generation is far more sensitive to commodity-price swings than most peers. This elevated volatility limits its access to capital in downturns and makes it unlikely to act as a consolidator when weaker competitors come under pressure.
You may be asking why we wait until the free cash flow line to perform this stability analysis versus commodity prices. Why not compare revenue or EBITDA to WTI in the case of TechnipFMC? Because what ultimately matters is not how much revenue or profit you earn when prices are high but how much cash you can generate when prices are low. Free cash flow is the superior metric because it includes everything from hedging prowess to growth and maintenance capex to management behavior during good times and bad.
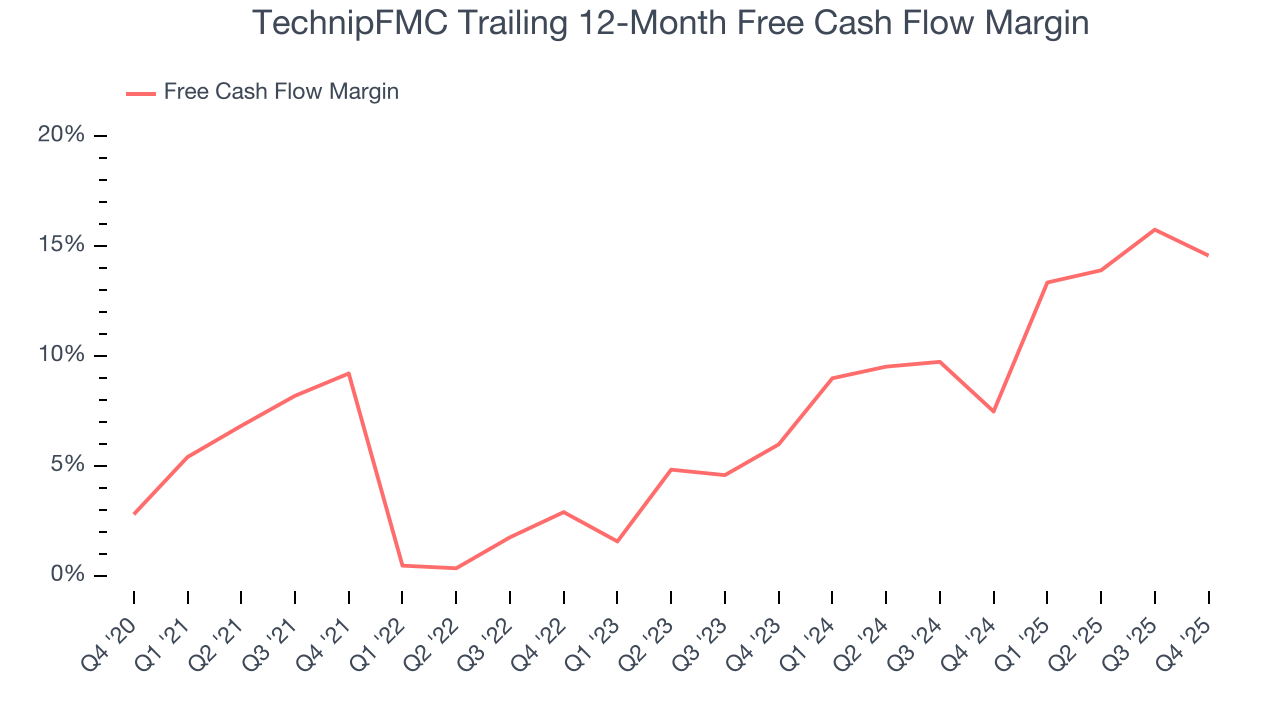
TechnipFMC’s free cash flow clocked in at $359.1 million in Q4, equivalent to a 14.3% margin. The company’s cash profitability regressed as it was 4.9 percentage points lower than in the same quarter last year, but it’s still above its five-year average. We wouldn’t read too much into this quarter’s decline because investment needs can be seasonal, leading to short-term swings. Long-term trends carry greater meaning.
10. Return on Invested Capital (ROIC)
Free cash flow shows how much money a producer generated, while ROIC shows how efficiently that money was earned. ROIC measures the operating profit produced for each dollar of capital invested, whether from debt or equity. Cash generation measures quantity while ROIC measures the quality of value creation.
We at StockStory like to look at ROIC over a ten-year period because energy investment cycles can involve up to five years of ramping production and another five years of harvesting. A decade view captures buying, extracting, and monetizing rather than just part of that picture. TechnipFMC’s ten-year average ROIC was negative 5.4%, meaning management lost money while trying to expand the business. Its returns were among the worst in the energy upstream and integrated energy sector.
We like to invest in businesses with high returns, but the trend in a company’s ROIC is what often surprises the market and moves the stock price. Fortunately, TechnipFMC’s ROIC has increased significantly over the last few years. This is a good sign, and we hope the company can continue improving.
11. Balance Sheet Assessment
One of the best ways to mitigate bankruptcy risk is to hold more cash than debt.
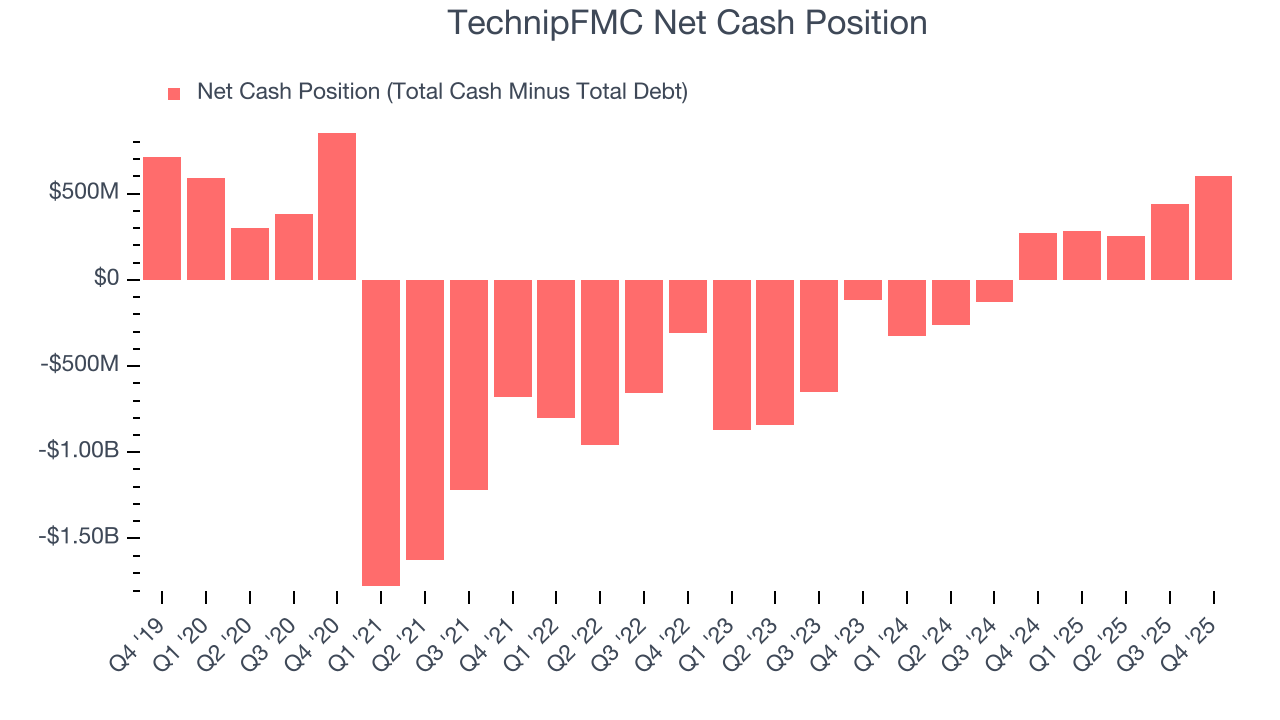
TechnipFMC is a profitable, well-capitalized company with $1.03 billion of cash and $430 million of debt on its balance sheet. This $601.9 million net cash position is 2.3% of its market cap and gives it the freedom to borrow money, return capital to shareholders, or invest in growth initiatives. Leverage is not an issue here.
12. Key Takeaways from TechnipFMC’s Q4 Results
It was good to see TechnipFMC beat analysts’ EPS expectations this quarter. On the other hand, its revenue slightly missed. Overall, this print had some key positives. The stock remained flat at $65.47 immediately after reporting.
13. Is Now The Time To Buy TechnipFMC?
Updated: March 20, 2026 at 12:46 AM EDT
Are you wondering whether to buy TechnipFMC or pass? We urge investors to not only consider the latest earnings results but also longer-term business quality and valuation as well.
TechnipFMC isn’t a terrible business, but it doesn’t pass our bar. To kick things off, its revenue has declined over the last five years. While its top-tier scale enables operational efficiencies, capital market access, and investment in advanced technologies, the downside is its relatively low ROIC suggests management has struggled to find compelling investment opportunities. On top of that, its EBITDA margins reveal bottom-tier profitability compared to other energy upstream and integrated energy companies.
TechnipFMC’s P/E ratio based on the next 12 months is 22.1x. At this valuation, there’s a lot of good news priced in - you can find more timely opportunities elsewhere.
Wall Street analysts have a consensus one-year price target of $62.62 on the company (compared to the current share price of $67.21), implying they don’t see much short-term potential in TechnipFMC.