Noble Corporation (NE)
Noble Corporation doesn’t excite us. Its negative returns on capital raise questions about its ability to allocate resources and generate profits.― StockStory Analyst Team
1. News
2. Summary
Why Noble Corporation Is Not Exciting
With origins dating back over a century to 1921, Noble Corporation (NYSE:NE) operates drilling rigs that oil and gas companies charter to drill wells in deep ocean waters and shallow seas.
- poor earning stability in the sector may keep investors up at night
- Negative returns on capital show management lost money while trying to expand the business
- A bright spot is that its market share has increased this cycle as its 27.8% annual revenue growth over the last five years was exceptional


Noble Corporation’s quality is inadequate. We see more favorable opportunities in the market.
Why There Are Better Opportunities Than Noble Corporation


Noble Corporation’s stock price of $49.03 implies a valuation ratio of 44x forward P/E. We consider this valuation aggressive considering the business fundamentals.
There are stocks out there featuring similar valuation multiples with better fundamentals. We prefer to invest in those.
3. Noble Corporation (NE) Research Report: Q4 CY2025 Update
Offshore drilling contractor Noble Corporation (NYSE:NE) announced better-than-expected revenue in Q4 CY2025, but sales fell by 17.6% year on year to $764.4 million. Its non-GAAP profit of $0.09 per share was 41.1% below analysts’ consensus estimates.
Noble Corporation (NE) Q4 CY2025 Highlights:
- Revenue: $764.4 million vs analyst estimates of $736.9 million (17.6% year-on-year decline, 3.7% beat)
- Adjusted EPS: $0.09 vs analyst expectations of $0.15 (41.1% miss)
- Adjusted EBITDA: $232.4 million vs analyst estimates of $233.2 million (30.4% margin, in line)
- Operating Margin: 5.6%, down from 18.4% in the same quarter last year
- Free Cash Flow was $35.38 million, up from -$4.45 million in the same quarter last year
- Market Capitalization: $7.63 billion
Company Overview
With origins dating back over a century to 1921, Noble Corporation (NYSE:NE) operates drilling rigs that oil and gas companies charter to drill wells in deep ocean waters and shallow seas.
The company's fleet of 40 mobile offshore drilling units consists of 27 floaters and 13 jackups, which are specialized vessels designed to drill in different water depths and conditions. Floaters include drillships—ship-shaped vessels that use dynamic positioning systems with multiple thrusters to stay precisely over a drilling site in waters up to 12,000 feet deep—and semisubmersibles, which have submerged pontoon hulls that provide exceptional stability in rough seas. Jackup rigs, in contrast, are towed to locations in shallower waters up to 500 feet deep, where their legs are lowered to the seabed and the hull is jacked up above the water to create a stable drilling platform.
Noble focuses primarily on the ultra-deepwater market and harsh environment jackup markets, which present more technical challenges than conventional drilling. The company operates globally across regions including Africa, the Middle East, the North Sea, South America, and the U.S. Gulf of Mexico, redeploying rigs to different areas based on customer demand.
When an oil and gas company like ExxonMobil or Shell identifies a promising offshore location, they charter a Noble rig under a contract that pays a daily rate for the duration of the drilling program. The company generates revenue from these dayrate contracts, with pricing influenced by the rig's technical specifications, water depth capabilities, and market conditions. Noble's customers are primarily large integrated oil companies, independent exploration firms, and government-owned energy enterprises that need specialized equipment and experienced crews to execute complex offshore drilling operations safely.
4. Oilfield Services
Oilfield services companies provide equipment, technology, and services enabling exploration and production activities, including drilling, completion, well intervention, and reservoir evaluation. Their fortunes closely track upstream capital spending cycles. Tailwinds include increased drilling activity during favorable commodity environments, demand for efficiency-enhancing technologies, and growing offshore and unconventional resource development. Headwinds include significant revenue volatility tied to oil and gas price swings and producer spending discipline. Intense competition pressures pricing and margins, while the energy transition may structurally reduce long-term demand. Workforce availability and technological disruption require continuous adaptation.
Noble Corporation's competitors in offshore drilling include Transocean (NYSE:RIG), Valaris (NYSE:VAL), Seadrill (NYSE:SDRL), Diamond Offshore Drilling (NYSE:DO), and Borr Drilling (NYSE:BORR).
5. Economies of Scale
In Energy, scale separates fragile single-asset producers from platform-style businesses that generate revenue across entire basins and infrastructure networks. Noble Corporation’s $3.29 billion of revenue in the last year lacks scale in an industry where it matters.
6. Revenue Growth
A company’s long-term performance can give signals about its business quality. Even a bad business, especially in a cyclical industry, can shine for a year or so, but a top-tier one should exhibit resilience through cycles. Luckily, Noble Corporation’s sales grew at an incredible 27.8% compounded annual growth rate over the last five years. Its growth beat the average energy upstream and integrated energy company and shows its offerings resonate with customers.
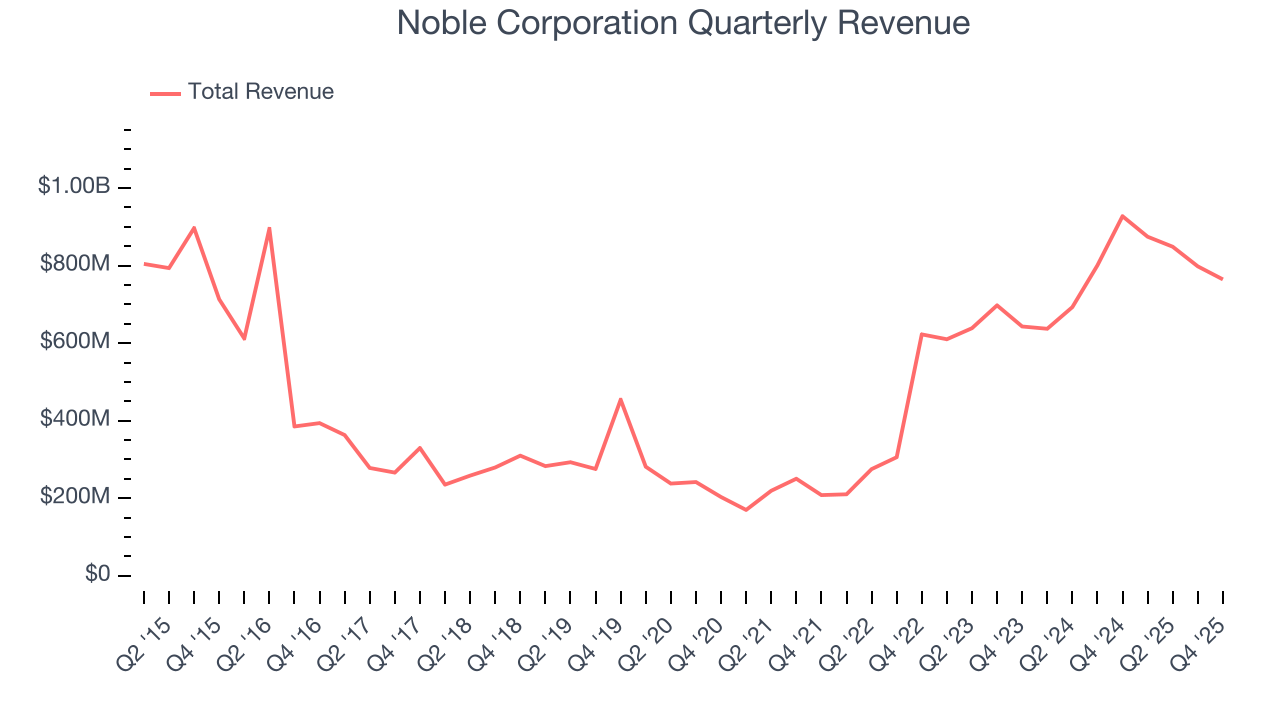
Energy cycles can be long enough that a single five-year period can still reflect one price environment, which is why an additional, decade-long view can help capture through-cycle performance. Noble Corporation’s annualized revenue growth of 0.2% over the last ten years is below its five-year trend, but we still think the results were respectable.
This quarter, Noble Corporation’s revenue fell by 17.6% year on year to $764.4 million but beat Wall Street’s estimates by 3.7%.
7. Gross Margin
In a single quarter or year, gross margins in the sector can swing wildly due to commodity prices, hedging, or changes in labor costs. Over a multi-year period across different points in the cycle, gross margin differences can signal whether a company is a structurally-advantaged producer (“rock” quality, takeaway, operating costs) or not.
Noble Corporation, which averaged 40.7% gross margin over the last five years, exhibits subpar unit economics in the sector. It means the company will struggle more at lower commodity prices than peers with better gross margins. 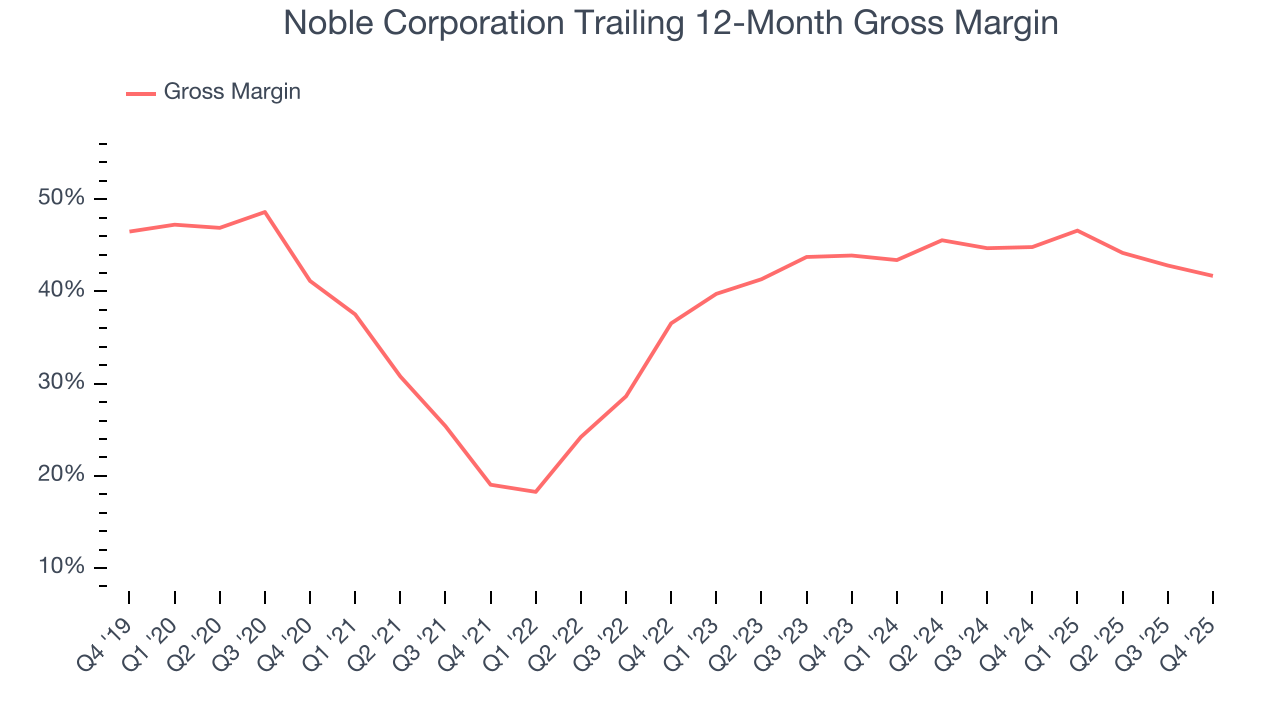
This quarter, Noble Corporation’s gross profit margin was 38.4%, down 4.8 percentage points year on year.
8. Adjusted EBITDA Margin
Adjusted EBITDA margin captures the true operating profitability of an energy producer by removing accounting noise around depletion and capitalized drilling costs. It reveals how much cash the asset base generates before capital structure and reinvestment requirements shape reported earnings.
Noble Corporation was profitable over the last five years but held back by its large cost base. Its average EBITDA margin of 30.3% was weak for an upstream and integrated energy business.
On the plus side, Noble Corporation’s EBITDA margin rose by 26.2 percentage points over the last year.
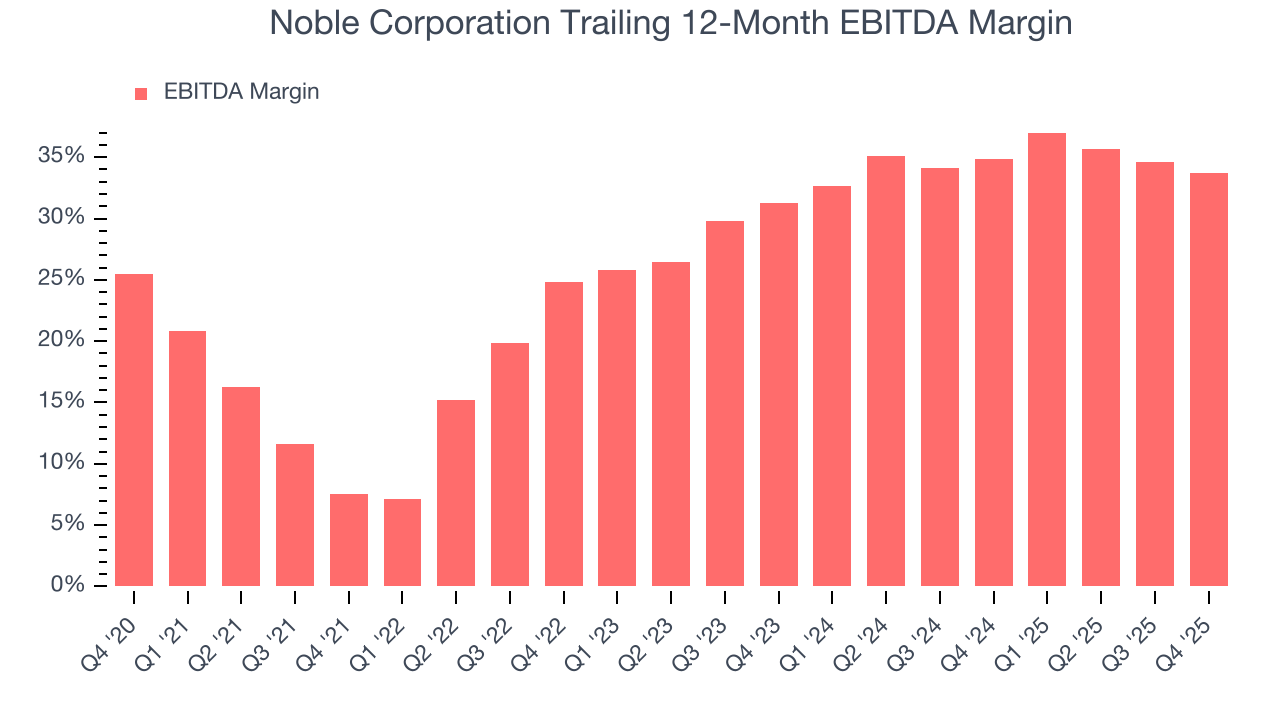
In Q4, Noble Corporation generated an EBITDA margin profit margin of 30.4%, down 4 percentage points year on year. This contraction shows it was less efficient because its expenses increased relative to its revenue. This adjusted EBITDA is in-line with Wall Street’s estimates.
9. Cash Is King
As mentioned above, adjusted EBITDA ignores capital structure and drilling expenditure decisions. These are two huge aspects of an Energy producer, so in order to understand a comprehensive picture of business quality, an investor needs to account for these. Said differently, adjusted EBITDA margins could be solid but free cash flow is abysmal because decline rates of the asset are extreme and the drilling is expensive. Free cash flow tells you about not only the economics of the production that has happened but how much it costs to stay in business as well (further drilling or extraction).
Noble Corporation has shown mediocre cash profitability relative to peers over the last five years, giving the company fewer opportunities to return capital to shareholders. Its free cash flow margin averaged 5.1%, below what we’d expect for an upstream and integrated energy business.
Absolute FCF margin levels matter but so does stability of free cash flow. All else equal, we’d prefer a 25.0% average free cash flow margin that is quite steady no matter how commodity prices behave rather than extremely high margins when times are good and negative ones when they’re tough.
Noble Corporation’s ratio of quarterly free cash flow volatility to WTI crude price volatility over the past five years was 19.7 (lower is better), indicating that its cash generation is far more sensitive to commodity-price swings than most peers. This elevated volatility limits its access to capital in downturns and makes it unlikely to act as a consolidator when weaker competitors come under pressure.
You may be asking why we wait until the free cash flow line to perform this stability analysis versus commodity prices. Why not compare revenue or EBITDA to WTI in the case of Noble Corporation? Because what ultimately matters is not how much revenue or profit you earn when prices are high but how much cash you can generate when prices are low. Free cash flow is the superior metric because it includes everything from hedging prowess to growth and maintenance capex to management behavior during good times and bad.
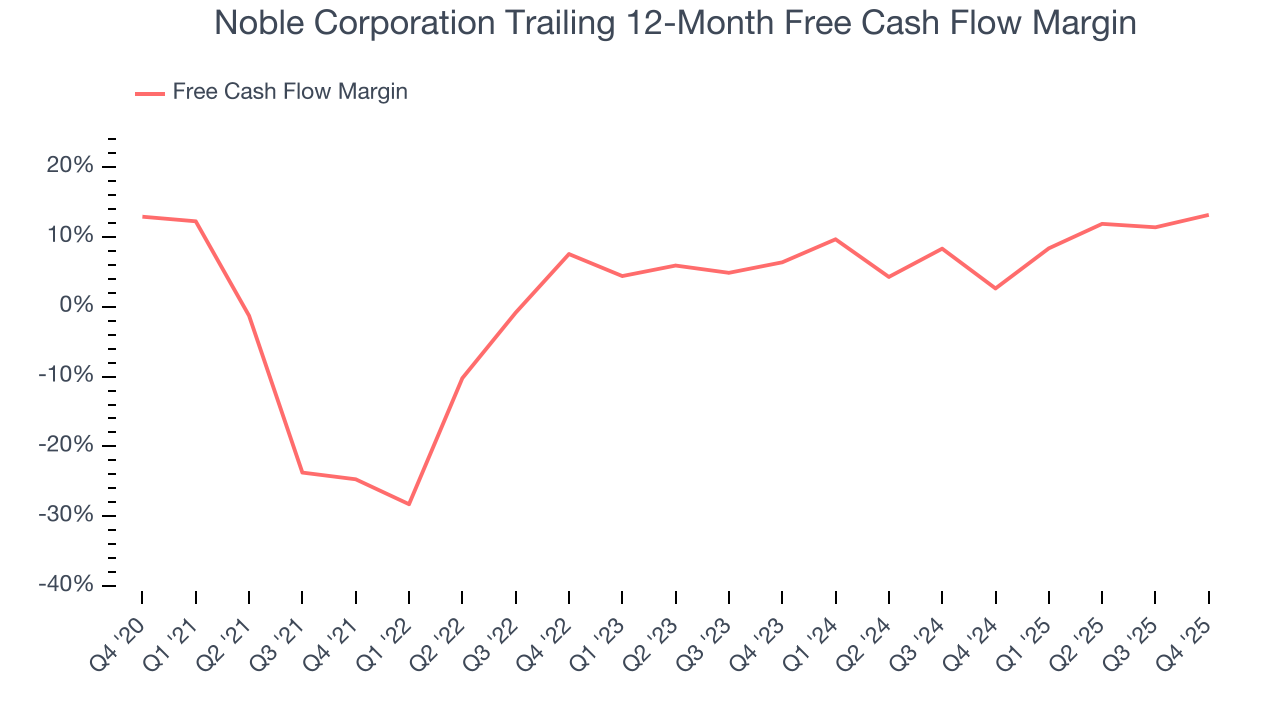
Noble Corporation’s free cash flow clocked in at $35.38 million in Q4, equivalent to a 4.6% margin. This result was good as its margin was 5.1 percentage points higher than in the same quarter last year, building on its favorable historical trend.
10. Return on Invested Capital (ROIC)
Free cash flow tells investors how much money an Energy producer made, and ROIC takes this one step further by telling investors how well and effectively the business made it. ROIC illustrates how much operating profit a producer generated relative to the money it has raised (debt and equity).
We at StockStory like to look at ROIC over a ten-year period because energy investment cycles can involve up to five years of ramping production and another five years of harvesting. A decade view captures buying, extracting, and monetizing rather than just part of that picture. Noble Corporation’s ten-year average ROIC was negative 8.2%, meaning management lost money while trying to expand the business. Its returns were among the worst in the energy upstream and integrated energy sector.
We like to invest in businesses with high returns, but the trend in a company’s ROIC is what often surprises the market and moves the stock price. Unfortunately, Noble Corporation’s ROIC averaged 1.2 percentage point decreases each year over the last few years. Paired with its already low returns, these declines suggest its profitable growth opportunities are few and far between.
11. Balance Sheet Assessment
Noble Corporation reported $471.4 million of cash and $2.08 billion of debt on its balance sheet in the most recent quarter. As investors in high-quality companies, we primarily focus on two things: 1) that a company’s debt level isn’t too high and 2) that its interest payments are not excessively burdening the business.
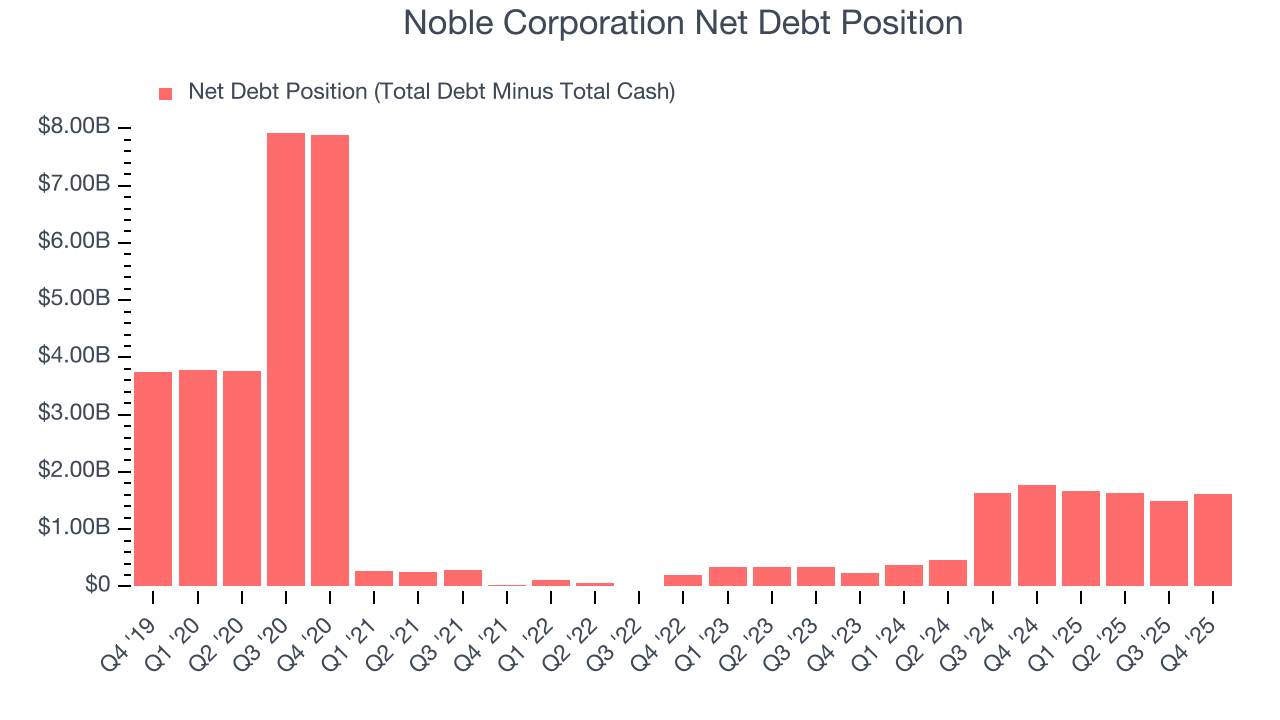
With $1.11 billion of EBITDA over the last 12 months, we view Noble Corporation’s 1.5× net-debt-to-EBITDA ratio as safe. We also see its $150.9 million of annual interest expenses as appropriate. The company’s profits give it plenty of breathing room, allowing it to continue investing in growth initiatives.
12. Key Takeaways from Noble Corporation’s Q4 Results
We enjoyed seeing Noble Corporation beat analysts’ revenue expectations this quarter. On the other hand, its EPS missed. Overall, this was a softer quarter. The stock traded up 5.7% to $50.62 immediately after reporting.
13. Is Now The Time To Buy Noble Corporation?
Updated: March 26, 2026 at 12:58 AM EDT
We think that the latest earnings result is only one piece of the bigger puzzle. If you’re deciding whether to own Noble Corporation, you should also grasp the company’s longer-term business quality and valuation.
Noble Corporation isn’t a bad business, but we’re not clamoring to buy it here and now. First off, its revenue growth over the last five years was top-tier for the sector. And while Noble Corporation’s relatively low ROIC suggests management has struggled to find compelling investment opportunities, its expanding EBITDA margin shows the business has become more efficient.
Noble Corporation’s P/E ratio based on the next 12 months is 44x. This valuation tells us a lot of optimism is priced in - you can find more timely opportunities elsewhere.
Wall Street analysts have a consensus one-year price target of $42.20 on the company (compared to the current share price of $49.03).