
Valaris (VAL)
We’re skeptical of Valaris. Its negative returns on capital suggest it eroded shareholder value by squandering business opportunities.― StockStory Analyst Team
1. News


2. Summary
Why We Think Valaris Will Underperform
Operating the world's largest fleet of offshore drilling rigs across six continents, Valaris (NYSE:VAL) provides offshore drilling rigs and crews to oil and gas companies exploring and producing in deep waters and shallow seas.
- Annual sales declines of 5.3% for the past ten years show its products and services struggled to connect with the market during this cycle
- High extraction costs and unfavorable asset economics are reflected in its low gross margin of 21%
- A positive is that its EBITDA margin expanded by 20.8 percentage points over the last five years as it scaled and became more efficient


Valaris doesn’t live up to our standards. There are more appealing investments to be made.
Why There Are Better Opportunities Than Valaris


Valaris is trading at $91.75 per share, or 29.1x forward P/E. This multiple is higher than that of energy upstream and integrated energy peers; it’s also rich for the top-line growth of the company. Not a great combination.
There are stocks out there featuring similar valuation multiples with better fundamentals. We prefer to invest in those.
3. Valaris (VAL) Research Report: Q4 CY2025 Update
Offshore drilling contractor Valaris (NYSE:VAL) announced better-than-expected revenue in Q4 CY2025, but sales fell by 8% year on year to $537.4 million. Its non-GAAP profit of $0.62 per share was 25.5% below analysts’ consensus estimates.
Valaris (VAL) Q4 CY2025 Highlights:
- Revenue: $537.4 million vs analyst estimates of $507.2 million (8% year-on-year decline, 5.9% beat)
- Adjusted EPS: $0.62 vs analyst expectations of $0.84 (25.5% miss)
- Adjusted EBITDA: $97 million vs analyst estimates of $79.28 million (18% margin, 22.4% beat)
- Operating Margin: 7.3%, down from 20.4% in the same quarter last year
- Free Cash Flow was -$34.1 million, down from $12.9 million in the same quarter last year
- Market Capitalization: $6.06 billion
Company Overview
Operating the world's largest fleet of offshore drilling rigs across six continents, Valaris (NYSE:VAL) provides offshore drilling rigs and crews to oil and gas companies exploring and producing in deep waters and shallow seas.
The company owns over 50 rigs spanning different types of offshore drilling equipment, each suited to specific water depths and conditions. Drillships and semisubmersible rigs, collectively called "floaters," are designed for ultra-deepwater drilling in environments like the Gulf of Mexico and offshore Brazil, where oil reserves lie miles beneath the ocean surface. Jackup rigs, which have retractable legs that extend to the seabed, operate in shallower waters such as the North Sea and Southeast Asia. Through a joint venture with Saudi Aramco called ARO, Valaris also operates rigs specifically for the Middle Eastern market.
Valaris works on a day rate contract basis, meaning customers pay a fixed daily fee for the rig and crew for the duration of a drilling project, which can last months or years. An oil company like BP might contract a Valaris drillship to drill an exploratory well in 7,000 feet of water off the coast of Angola, or a smaller independent operator might hire a jackup rig to complete production wells in the shallow waters of the Arabian Gulf. The company's crews handle the technical drilling operations while the oil company directs where and how to drill.
Beyond traditional drilling, Valaris rigs occasionally perform specialized work such as well maintenance, plugging and abandoning old wells, or decommissioning offshore infrastructure. With operations spanning the Americas, Europe, Africa, the Middle East, and Asia Pacific, the company serves major international oil companies, state-owned energy firms, and independent producers. In 2024, international operations outside the United States generated the vast majority of revenue, with BP as the single largest customer.
4. Oilfield Services
Oilfield services companies provide equipment, technology, and services enabling exploration and production activities, including drilling, completion, well intervention, and reservoir evaluation. Their fortunes closely track upstream capital spending cycles. Tailwinds include increased drilling activity during favorable commodity environments, demand for efficiency-enhancing technologies, and growing offshore and unconventional resource development. Headwinds include significant revenue volatility tied to oil and gas price swings and producer spending discipline. Intense competition pressures pricing and margins, while the energy transition may structurally reduce long-term demand. Workforce availability and technological disruption require continuous adaptation.
Valaris competes with other offshore drilling contractors including Transocean (NYSE:RIG), Noble Corporation (NYSE:NE), Seadrill (NYSE:SDRL), and Borr Drilling (NYSE:BORR), along with regional operators in specific markets.
5. Economies of Scale
In Energy, scale separates fragile single-asset producers from platform-style businesses that generate revenue across entire basins and infrastructure networks. Valaris’s $2.37 billion of revenue in the last year lacks scale in an industry where it matters.
6. Revenue Growth
Cyclical sectors like Energy often flatter weaker operators during favorable price environments, but a longer-term lens separates those from businesses that can consistently perform across market cycles. Luckily, Valaris’s sales grew at a decent 10.7% compounded annual growth rate over the last five years. Its growth was slightly above the average energy upstream and integrated energy company and shows its offerings resonate with customers.
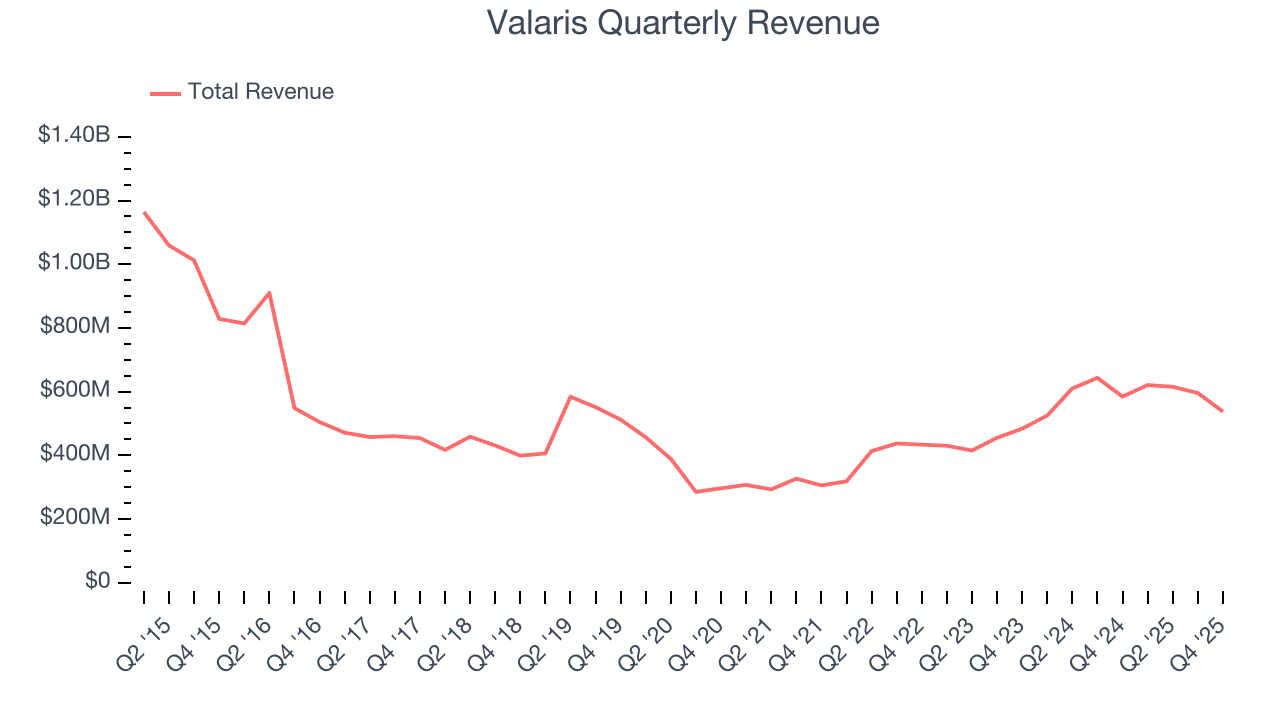
Even a long stretch in Energy can be shaped by a single commodity cycle, so extending the view to ten years adds another perspective and reveals which companies are built to grow regardless of the pricing regime. Valaris’s ten year performance marks a sharp pivot from its five-year trend as its revenue has shown annualized declines of 5.3% over the last ten years.
While looking at revenue is important, it can also introduce noise around commodity prices and M&A. Analyzing drivers of revenue, on the other hand, highlights what is happening inside the asset base and whether the economic footprint of a company is expanding. Over the last two years, Valaris’s total oil volume per day - Upstream averaged 1.3% year-on-year declines. while natural gas volume per day - Upstream averaged 7.4% year-on-year declines.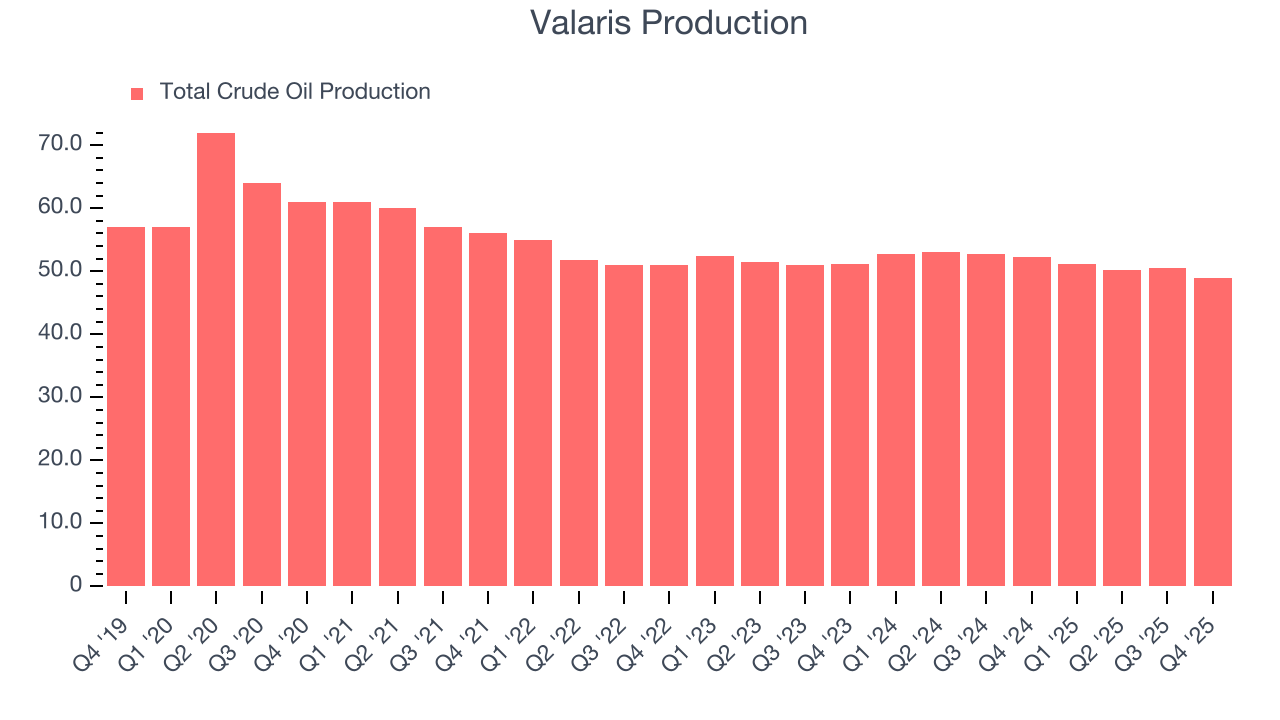
This quarter, Valaris’s revenue fell by 8% year on year to $537.4 million but beat Wall Street’s estimates by 5.9%.
7. Gross Margin
In a single quarter or year, gross margins in the sector can swing wildly due to commodity prices, hedging, or changes in labor costs. Over a multi-year period across different points in the cycle, gross margin differences can signal whether a company is a structurally-advantaged producer (“rock” quality, takeaway, operating costs) or not.
Valaris, which averaged 21% gross margin over the last five years, exhibiting bottom-tier unit economics in the sector. It means the company will struggle at higher commodity prices than peers with better gross margins. 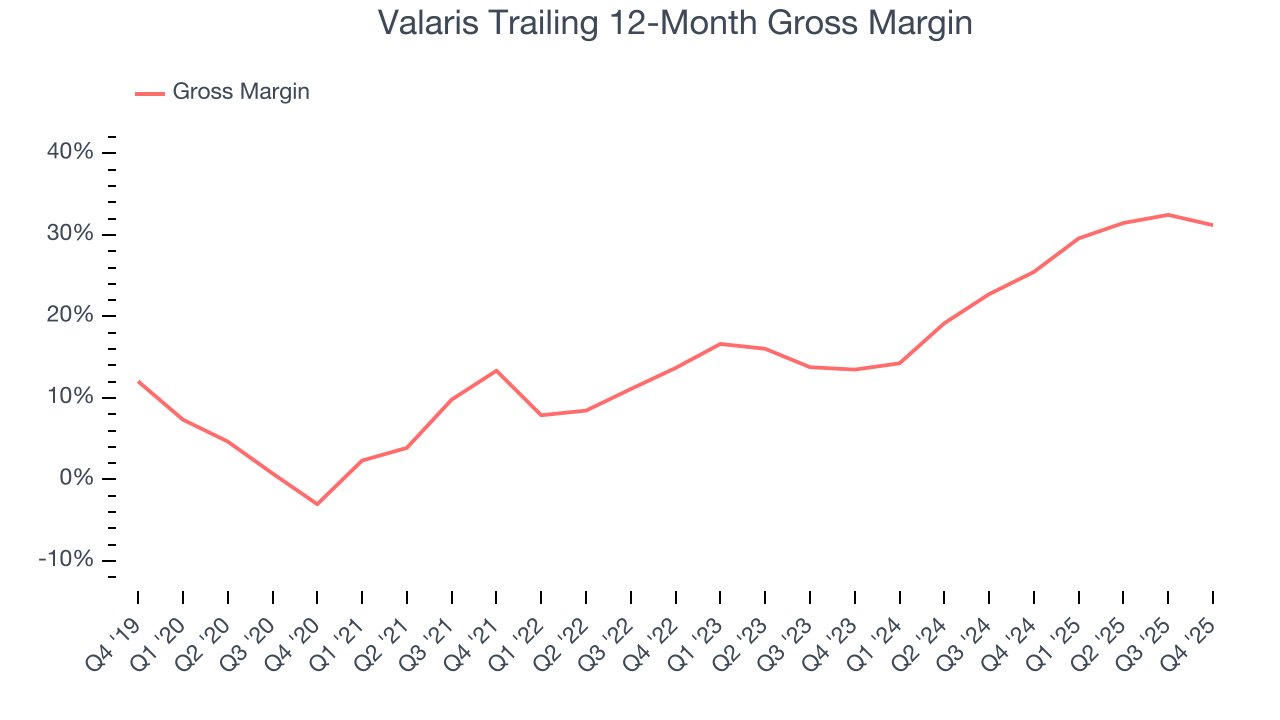
This quarter, Valaris’s gross profit margin was 23.1%, down 5.9 percentage points year on year.
8. Adjusted EBITDA Margin
Valaris was profitable over the last five years but held back by its large cost base. Its average EBITDA margin of 15.8% was among the worst in the energy upstream and integrated energy sector.
On the plus side, Valaris’s EBITDA margin rose by 20.8 percentage points over the last year.
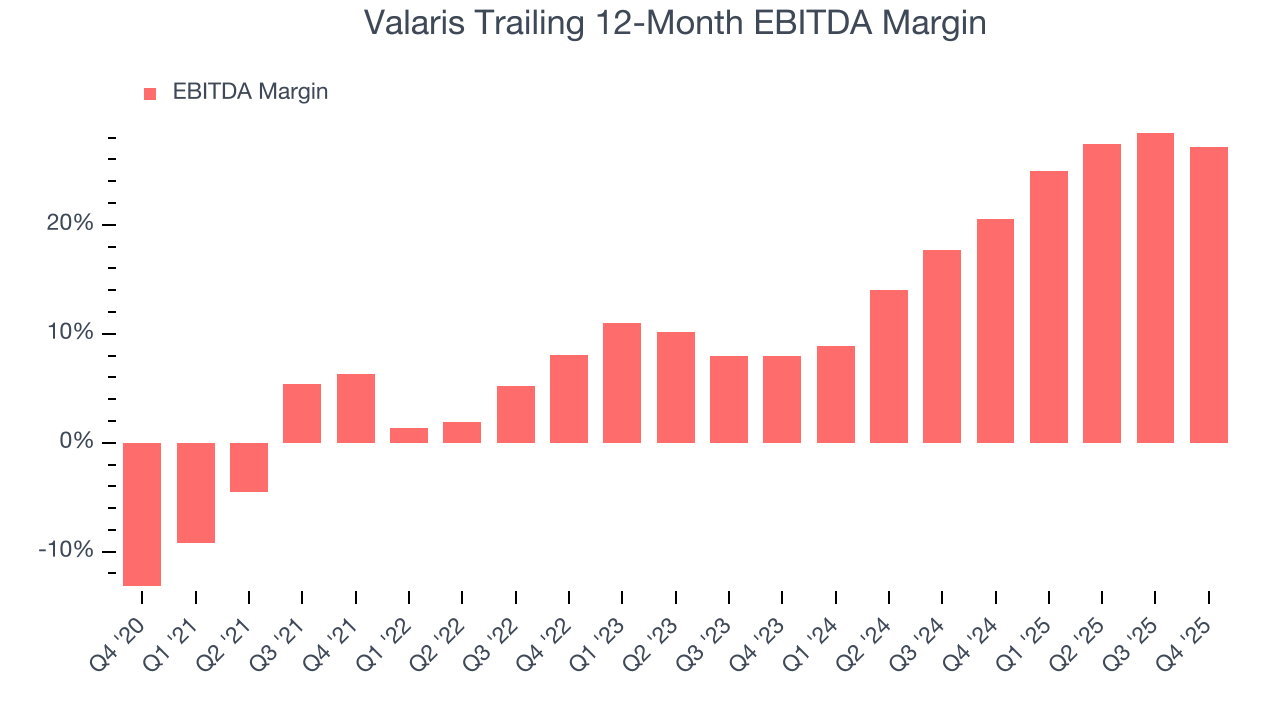
This quarter, Valaris generated an EBITDA margin profit margin of 18%, down 6.3 percentage points year on year. This contraction shows it was less efficient because its expenses increased relative to its revenue. This adjusted EBITDA beat Wall Street’s estimates by 22.4%.
9. Cash Is King
Adjusted EBITDA shows how profitable a company’s existing “rock” is before financing and reinvestment, while free cash flow shows how much value remains after paying to replace those wells. Because production declines over time, strong EBITDA can coexist with weak FCF if drilling is expensive or declines are steep. FCF therefore captures both operating efficiency and the cost of sustaining production.
Valaris’s demanding reinvestments have drained its resources over the last five years, putting it in a pinch and limiting its ability to return capital to investors. Its free cash flow margin averaged negative 5.7%, meaning it lit $5.68 of cash on fire for every $100 in revenue.
Absolute FCF margin levels matter but so does stability of free cash flow. All else equal, we’d prefer a 25.0% average free cash flow margin that is quite steady no matter how commodity prices behave rather than extremely high margins when times are good and negative ones when they’re tough.
Valaris’s ratio of quarterly free cash flow volatility to WTI crude price volatility over the past five years was 27.1 (lower is better), indicating that its cash generation is far more sensitive to commodity-price swings than most peers. This elevated volatility limits its access to capital in downturns and makes it unlikely to act as a consolidator when weaker competitors come under pressure.
You may be asking why we wait until the free cash flow line to perform this stability analysis versus commodity prices. Why not compare revenue or EBITDA to WTI Crude prices in the case of Valaris? Because what ultimately matters is not how much revenue or profit you earn when prices are high but how much cash you can generate when prices are low. Free cash flow is the superior metric because it includes everything from hedging prowess to growth and maintenance capex to management behavior during good times and bad.
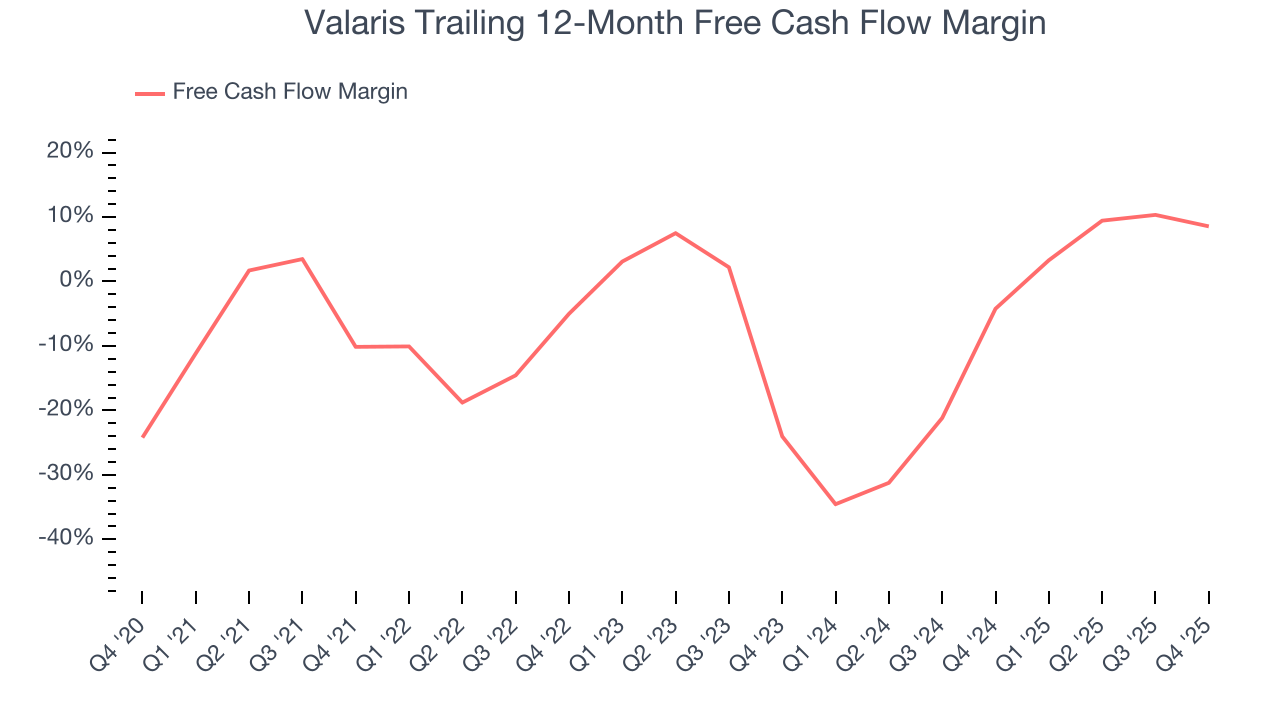
Valaris burned through $34.1 million of cash in Q4, equivalent to a negative 6.3% margin. The company’s cash flow turned negative after being positive in the same quarter last year, prompting us to pay closer attention. Short-term fluctuations typically aren’t a big deal because investment needs can be seasonal, but we’ll be watching to see if the trend extrapolates into future quarters.
10. Return on Invested Capital (ROIC)
Free cash flow tells investors how much money an Energy producer made, and ROIC takes this one step further by telling investors how well and effectively the business made it. ROIC illustrates how much operating profit a producer generated relative to the money it has raised (debt and equity).
We at StockStory like to look at ROIC over a ten-year period because energy investment cycles can involve up to five years of ramping production and another five years of harvesting. A decade view captures buying, extracting, and monetizing rather than just part of that picture. Valaris’s ten-year average ROIC was negative 5.3%, meaning management lost money while trying to expand the business. Its returns were among the worst in the energy upstream and integrated energy sector.
We like to invest in businesses with high returns, but the trend in a company’s ROIC is what often surprises the market and moves the stock price. Over the last few years, Valaris’s ROIC has increased significantly. This is a good sign, and we hope the company can continue improving.
11. Balance Sheet Assessment
Valaris reported $599.4 million of cash and $1.12 billion of debt on its balance sheet in the most recent quarter. As investors in high-quality companies, we primarily focus on two things: 1) that a company’s debt level isn’t too high and 2) that its interest payments are not excessively burdening the business.
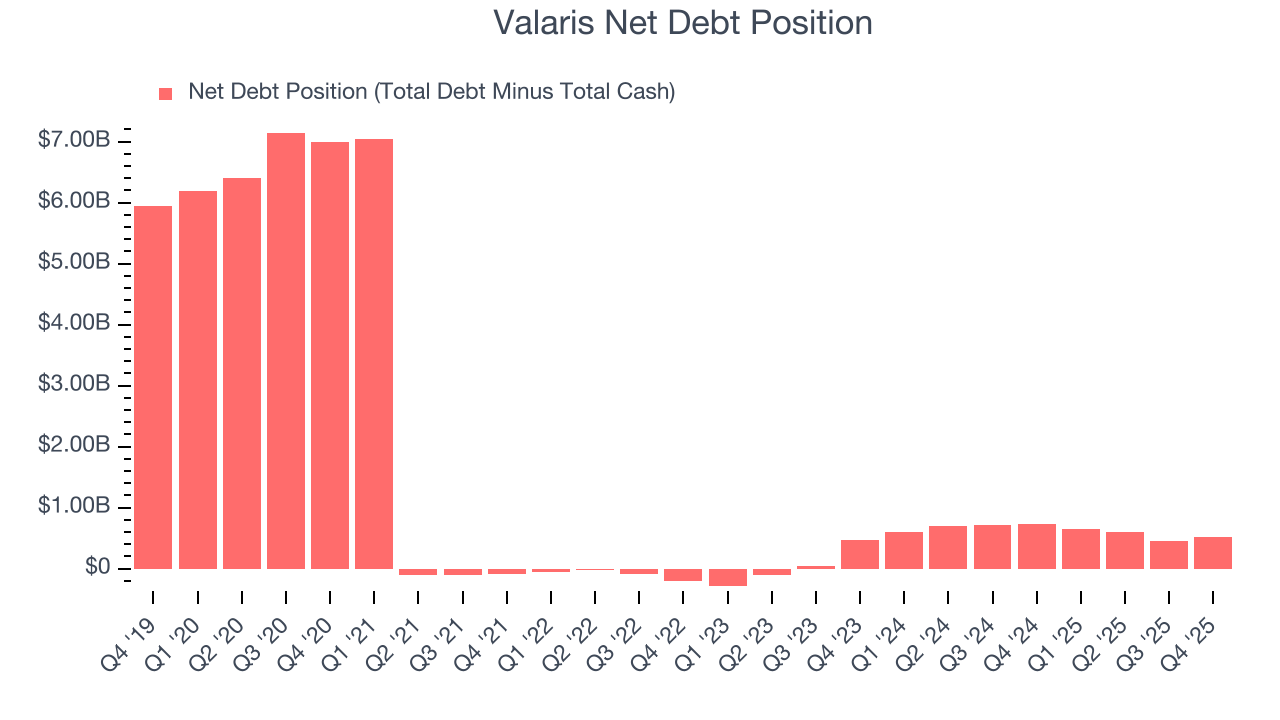
With $642.2 million of EBITDA over the last 12 months, we view Valaris’s 0.8× net-debt-to-EBITDA ratio as safe. We also see its $28 million of annual interest expenses as appropriate. The company’s profits give it plenty of breathing room, allowing it to continue investing in growth initiatives.
12. Key Takeaways from Valaris’s Q4 Results
We were impressed by how significantly Valaris blew past analysts’ EBITDA expectations this quarter. We were also excited its revenue outperformed Wall Street’s estimates by a wide margin. On the other hand, its EPS missed. Overall, we think this was a decent quarter with some key metrics above expectations. The stock traded up 3.2% to $90.33 immediately following the results.
13. Is Now The Time To Buy Valaris?
Updated: March 14, 2026 at 12:57 AM EDT
A common mistake we notice when investors are deciding whether to buy a stock or not is that they simply look at the latest earnings results. Business quality and valuation matter more, so we urge you to understand these dynamics as well.
Valaris isn’t a terrible business, but it isn’t one of our picks. Although its revenue growth over the last five years was average for the sector, it’s expected to deteriorate over the next 12 months and its relatively low ROIC suggests management has struggled to find compelling investment opportunities. And while the company’s expanding EBITDA margin shows the business has become more efficient, the downside is its free cash flow volatility compared to commodity price volatility is bottom-tier in the sector, leading to highly volatile free cash flow.
Valaris’s P/E ratio based on the next 12 months is 28.8x. This valuation tells us it’s a bit of a market darling with a lot of good news priced in - you can find more timely opportunities elsewhere.
Wall Street analysts have a consensus one-year price target of $65.93 on the company (compared to the current share price of $93.03), implying they don’t see much short-term potential in Valaris.