NOV (NOV)
NOV faces an uphill battle. Not only has its sales growth been weak but also its negative returns on capital show it destroyed value.― StockStory Analyst Team
1. News
2. Summary
Why We Think NOV Will Underperform
With roots stretching back to 1862 when it began making equipment for early oil fields, NOV (NYSE:NOV) manufactures drilling rigs, drill bits, pumps, and other equipment used to drill oil and gas wells.
- Customers postponed purchases of its products and services this cycle as its revenue declined by 5.1% annually over the last ten years
- Gross margin of 20.2% reflects its high production costs and unfavorable asset base
- EBITDA margin falls short of the industry average, and the smaller profit dollars make it harder to react to unexpected market developments


NOV is in the doghouse. Better businesses are for sale in the market.
Why There Are Better Opportunities Than NOV


NOV’s stock price of $18.24 implies a valuation ratio of 18.2x forward P/E. This multiple is cheaper than most energy upstream and integrated energy peers, but we think this is justified.
We’d rather pay up for companies with elite fundamentals than get a bargain on weak ones. Cheap stocks can be value traps, and as their performance deteriorates, they will stay cheap or get even cheaper.
3. NOV (NOV) Research Report: Q4 CY2025 Update
Oilfield equipment manufacturer NOV (NYSE:NOV) reported Q4 CY2025 results exceeding the market’s revenue expectations, but sales fell by 1.3% year on year to $2.28 billion. Its non-GAAP loss of $0.52 per share was significantly below analysts’ consensus estimates.
NOV (NOV) Q4 CY2025 Highlights:
- Revenue: $2.28 billion vs analyst estimates of $2.17 billion (1.3% year-on-year decline, 4.8% beat)
- Adjusted EPS: -$0.52 vs analyst estimates of $0.25 (significant miss)
- Adjusted EBITDA: $267 million vs analyst estimates of $247.2 million (11.7% margin, 8% beat)
- Operating Margin: 4%, down from 9% in the same quarter last year
- Free Cash Flow Margin: 20.7%, similar to the same quarter last year
- Market Capitalization: $6.69 billion
Company Overview
With roots stretching back to 1862 when it began making equipment for early oil fields, NOV (NYSE:NOV) manufactures drilling rigs, drill bits, pumps, and other equipment used to drill oil and gas wells.
The company organizes its offerings into two segments. The Energy Products and Services segment provides consumable products and shorter-cycle equipment, including drill bits that break rock during drilling, downhole motors that enable directional drilling for horizontal wells, completion tools like dissolvable frac plugs used in hydraulic fracturing, and electric submersible pumps that lift oil to the surface. This segment also offers tubular inspection and coating services to protect drill pipe, solids control equipment that separates drill cuttings from drilling fluids for reuse, and digital solutions that deliver real-time data from downhole sensors to optimize drilling operations.
The Energy Equipment segment focuses on longer-lead capital equipment. This includes complete land drilling rigs and offshore drilling packages with automated systems like top drives and robotic pipe handlers, high-pressure hydraulic fracturing pumps and associated process equipment, heavy-lift cranes and deck machinery for offshore platforms, and flexible subsea pipe systems that transport oil from seafloor wellheads to production facilities. For example, an offshore drilling contractor might purchase a NOV drilling package including the derrick, drawworks, top drive, and control systems to construct a new deepwater rig, while an onshore operator might rent NOV's managed pressure drilling equipment to maintain precise wellbore pressure control in a challenging formation.
The company generates revenue through equipment sales, consumable products, rentals, aftermarket parts, repair services, and increasingly through subscription-based digital monitoring and analytics services. Customers include oilfield service companies like Schlumberger and Halliburton, national oil companies, independent exploration and production firms, and offshore drilling contractors. With operations in 59 countries, approximately two-thirds of NOV's revenue comes from outside the United States. The company is also developing equipment for offshore wind installation vessels, carbon capture systems, and geothermal drilling applications.
4. Oilfield Services
Oilfield services companies provide equipment, technology, and services enabling exploration and production activities, including drilling, completion, well intervention, and reservoir evaluation. Their fortunes closely track upstream capital spending cycles. Tailwinds include increased drilling activity during favorable commodity environments, demand for efficiency-enhancing technologies, and growing offshore and unconventional resource development. Headwinds include significant revenue volatility tied to oil and gas price swings and producer spending discipline. Intense competition pressures pricing and margins, while the energy transition may structurally reduce long-term demand. Workforce availability and technological disruption require continuous adaptation.
NOV competes with Baker Hughes (NASDAQ:BKR), Schlumberger (NYSE:SLB), and Halliburton (NYSE:HAL) in various equipment categories, along with specialized competitors like Tenaris (NYSE:TS) in tubular products and TechnipFMC (NYSE:FTI) in subsea systems.
5. Economies of Scale
The scale of a company’s revenue base is an important lens through which to view the topline, as it signals whether a producer has gone from a vulnerable commodity taker into a durable operating platform. Larger producers generate revenue across many wells, pads, takeaway routes, and geographies rather than relying on a single field or drilling program. NOV’s $8.74 billion of revenue in the last year is top-tier for the industry, suggesting the company has hit a level of diversification where investors can sleep easy at night.
6. Revenue Growth
Cyclical sectors like Energy often flatter weaker operators during favorable price environments, but a longer-term lens separates those from businesses that can consistently perform across market cycles. Unfortunately, NOV’s 7.5% annualized revenue growth over the last five years was tepid. This was below our standard for the energy upstream and integrated energy sector and is a tough starting point for our analysis.
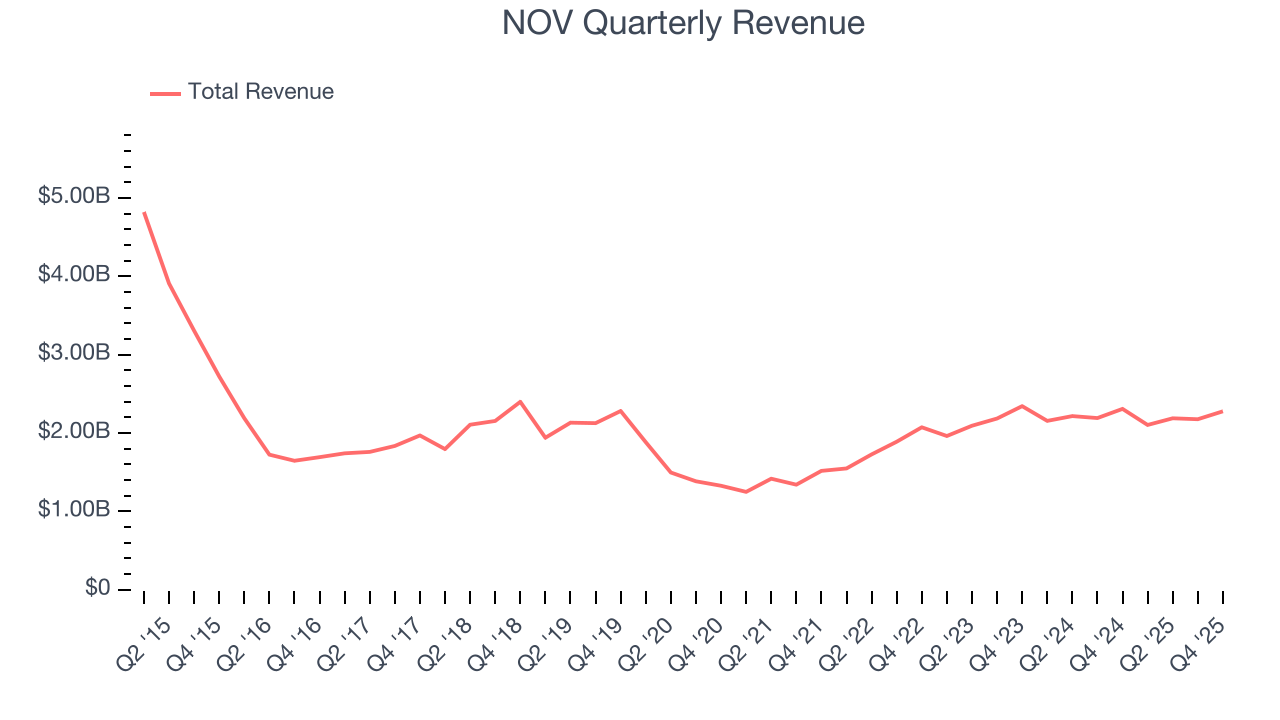
Within Energy, a singular timeframe, even if it’s quite long-term, only sheds light on how well a company rode the last commodity cycle. To better assess whether a company compounds through cycles, we validate our view with an even longer, ten-year view. NOV’s performance shows it grew in the past five-year but relinquished its gains over the last ten years, as its revenue fell by 5.1% annually.
Revenue provides useful context, but it is heavily influenced by commodity prices and acquisitions. Production volumes, by contrast, reveal whether the underlying asset base is actually growing. Over the last two years, NOV’s total oil volume per day - Upstream averaged 7.5% year-on-year growth while natural gas volume per day - Upstream averaged 5.6% year-on-year growth, which was good. 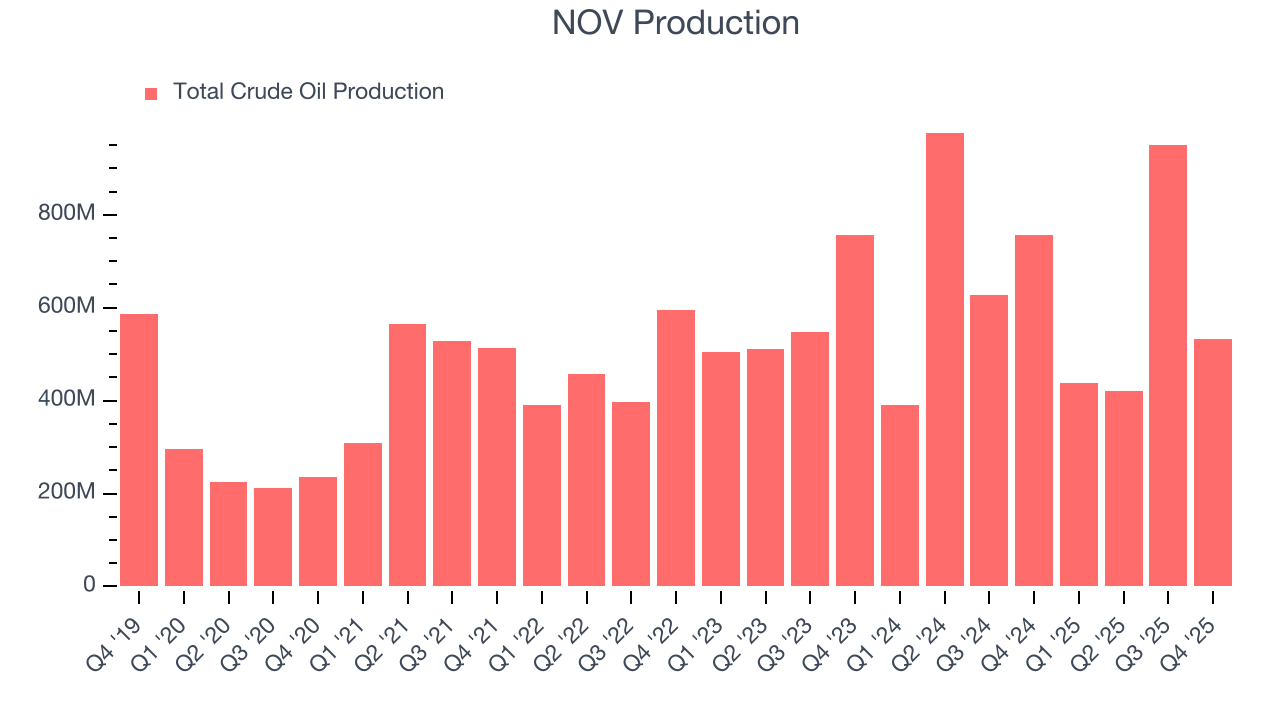
This quarter, NOV’s revenue fell by 1.3% year on year to $2.28 billion but beat Wall Street’s estimates by 4.8%. This quarter, NOV missed Wall Street’s estimates and reported a rather uninspiring 29.7% year-on-year production decline, generating 532,000 Mboe of production.
7. Gross Margin
While energy gross margins can be distorted by commodity prices, hedging, and short-term cost swings, sustained margins across a full cycle reflect a producer’s underlying asset quality, infrastructure position, and cost structure.
NOV, which averaged 20.2% gross margin over the last five years, exhibiting bottom-tier unit economics in the sector. It means the company will struggle at higher commodity prices than peers with better gross margins. 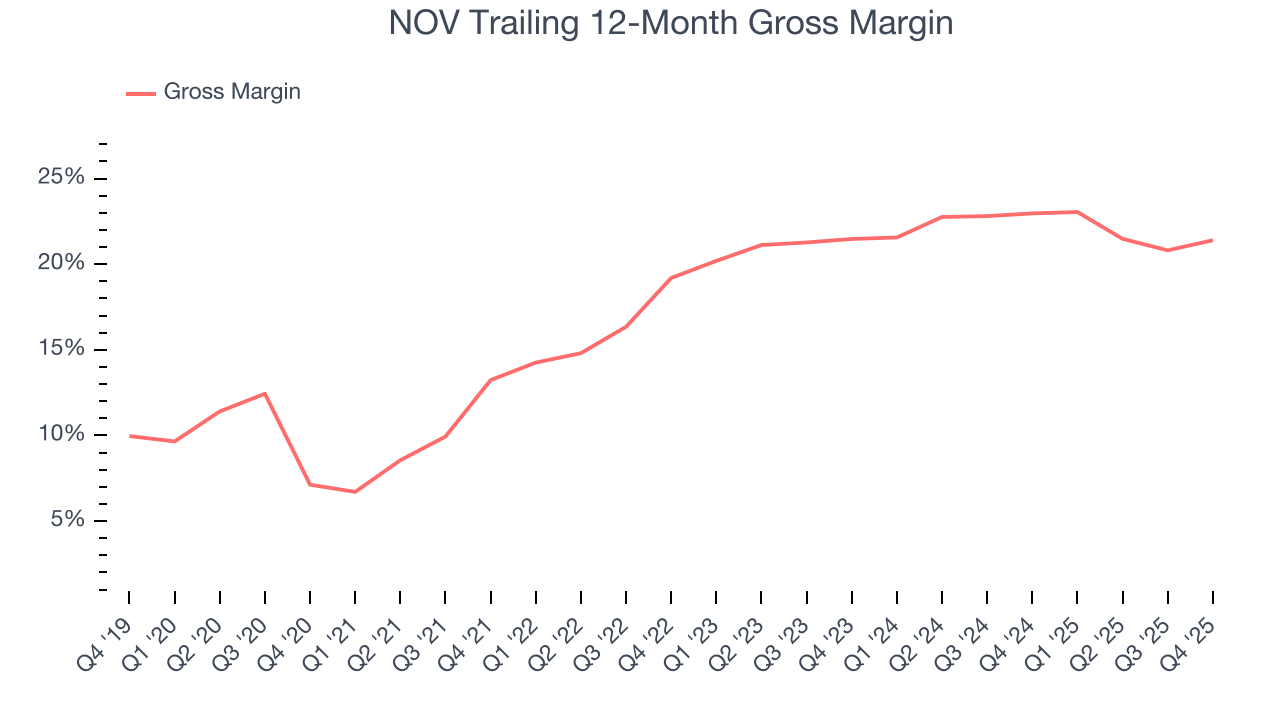
In Q4, NOV produced a 24.5% gross profit margin, up 2.3 percentage points year on year.
8. Adjusted EBITDA Margin
Adjusted EBITDA margin captures the true operating profitability of an energy producer by removing accounting noise around depletion and capitalized drilling costs. It reveals how much cash the asset base generates before capital structure and reinvestment requirements shape reported earnings.
NOV was profitable over the last five years but held back by its large cost base. Its average EBITDA margin of 10.4% was among the worst in the energy upstream and integrated energy sector.
On the plus side, NOV’s EBITDA margin rose by 7.9 percentage points over the last year.
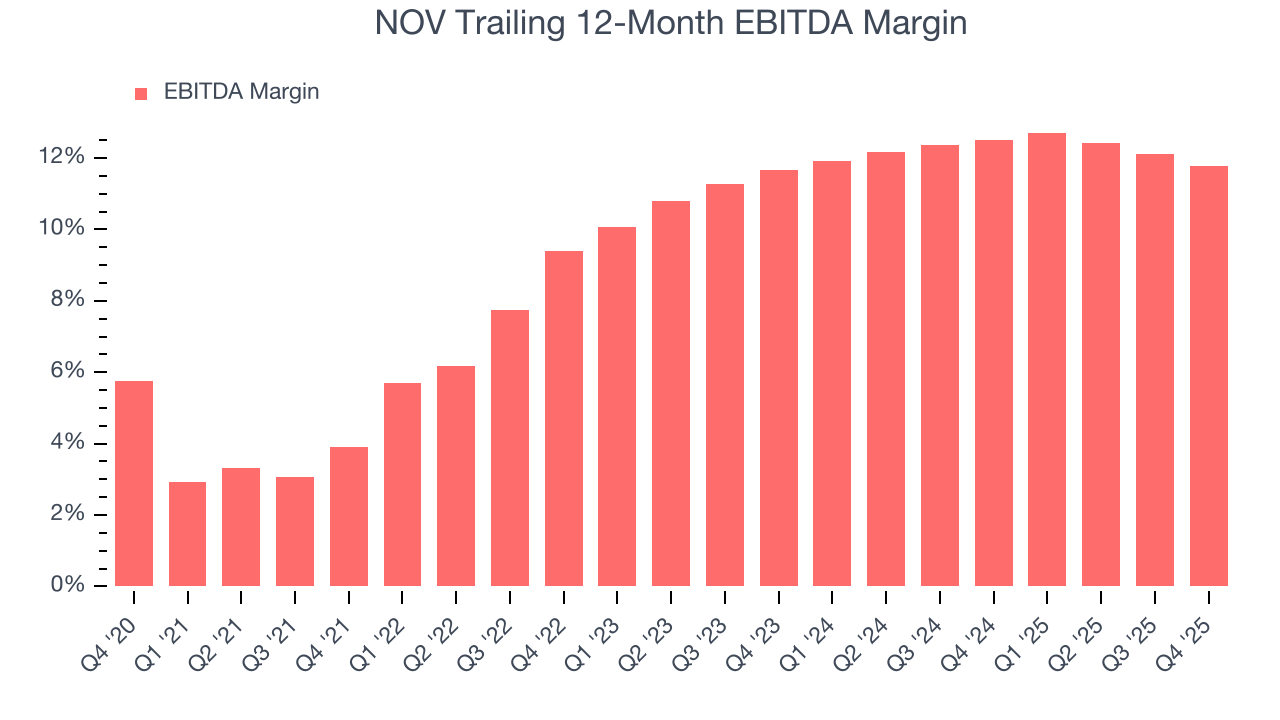
This quarter, NOV generated an EBITDA margin profit margin of 11.7%, down 1.4 percentage points year on year. This reduction is quite minuscule and indicates the company’s overall cost structure has been relatively stable. This adjusted EBITDA beat Wall Street’s estimates by 8%.
9. Cash Is King
As mentioned above, adjusted EBITDA ignores capital structure and drilling expenditure decisions. These are two huge aspects of an Energy producer, so in order to understand a comprehensive picture of business quality, an investor needs to account for these. Said differently, adjusted EBITDA margins could be solid but free cash flow is abysmal because decline rates of the asset are extreme and the drilling is expensive. Free cash flow tells you about not only the economics of the production that has happened but how much it costs to stay in business as well (further drilling or extraction).
NOV has shown weak cash profitability relative to peers over the last five years, giving the company fewer opportunities to return capital to shareholders. Its free cash flow margin averaged 3.6%, below what we’d expect for an upstream and integrated energy business.
The level of free cash flow is important, but its durability across cycles is just as critical. Consistent margins are far more valuable than volatile swings driven by commodity prices.
NOV’s ratio of quarterly free cash flow volatility to WTI crude price volatility over the past five years was 20 (lower is better), indicating that its cash generation is far more sensitive to commodity-price swings than most peers. This elevated volatility limits its access to capital in downturns and makes it unlikely to act as a consolidator when weaker competitors come under pressure.
You may be asking why we wait until the free cash flow line to perform this stability analysis versus commodity prices. Why not compare revenue or EBITDA to WTI Crude prices in the case of NOV? Because what ultimately matters is not how much revenue or profit you earn when prices are high but how much cash you can generate when prices are low. Free cash flow is the superior metric because it includes everything from hedging prowess to growth and maintenance capex to management behavior during good times and bad.
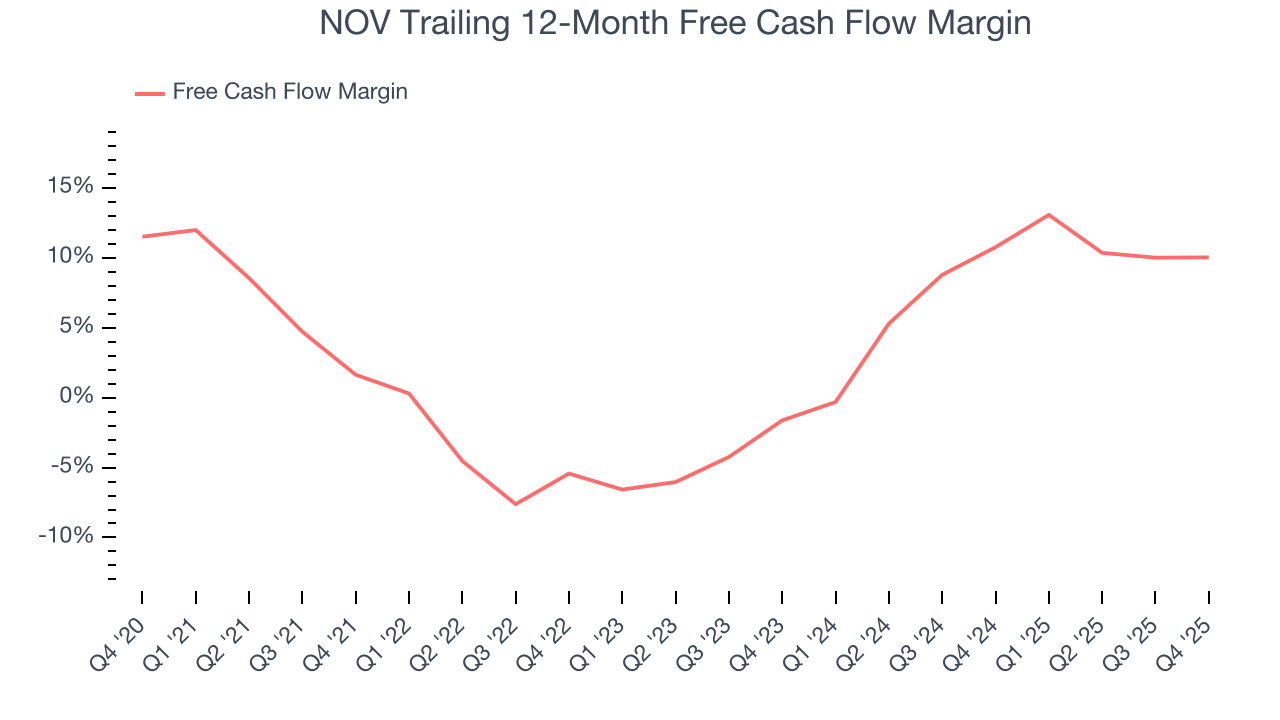
NOV’s free cash flow clocked in at $472 million in Q4, equivalent to a 20.7% margin. This cash profitability was in line with the comparable period last year and above its five-year average.
10. Return on Invested Capital (ROIC)
Free cash flow shows how much money a producer generated, while ROIC shows how efficiently that money was earned. ROIC measures the operating profit produced for each dollar of capital invested, whether from debt or equity. Cash generation measures quantity while ROIC measures the quality of value creation.
We at StockStory like to look at ROIC over a ten-year period because energy investment cycles can involve up to five years of ramping production and another five years of harvesting. A decade view captures buying, extracting, and monetizing rather than just part of that picture. NOV’s ten-year average ROIC was negative 8.2%, meaning management lost money while trying to expand the business. Its returns were among the worst in the energy upstream and integrated energy sector.
We like to invest in businesses with high returns, but the trend in a company’s ROIC is what often surprises the market and moves the stock price. Fortunately, NOV’s has increased over the last few years. This is a good sign, and we hope the company can continue improving.
11. Balance Sheet Assessment
NOV reported $1.55 billion of cash and $1.72 billion of debt on its balance sheet in the most recent quarter. As investors in high-quality companies, we primarily focus on two things: 1) that a company’s debt level isn’t too high and 2) that its interest payments are not excessively burdening the business.
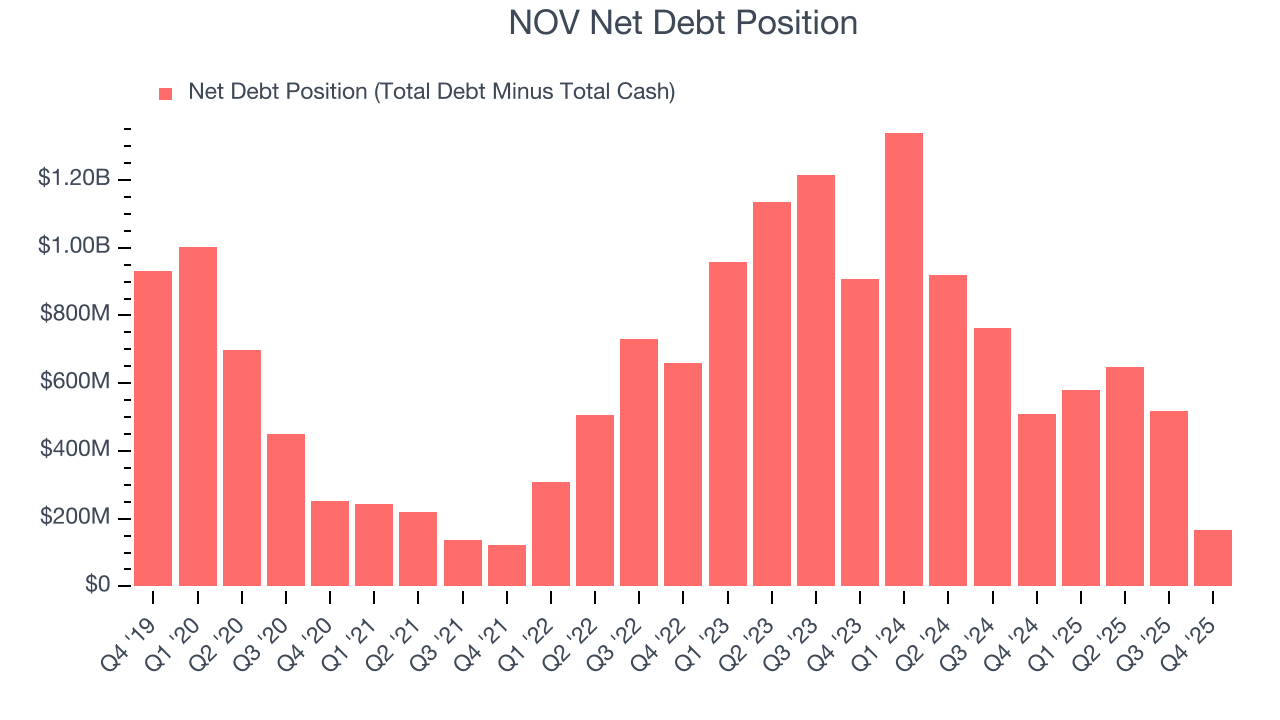
With $1.03 billion of EBITDA over the last 12 months, we view NOV’s 0.2× net-debt-to-EBITDA ratio as safe. We also see its $37 million of annual interest expenses as appropriate. The company’s profits give it plenty of breathing room, allowing it to continue investing in growth initiatives.
12. Key Takeaways from NOV’s Q4 Results
We were impressed by how significantly NOV blew past analysts’ revenue expectations this quarter. We were also glad its EBITDA outperformed Wall Street’s estimates. On the other hand, its EPS missed and its production fell short of Wall Street’s estimates. Overall, this quarter could have been better. The stock remained flat at $18.67 immediately after reporting.
13. Is Now The Time To Buy NOV?
Updated: March 14, 2026 at 1:11 AM EDT
We think that the latest earnings result is only one piece of the bigger puzzle. If you’re deciding whether to own NOV, you should also grasp the company’s longer-term business quality and valuation.
NOV falls short of our quality standards. First off, its revenue growth was quite poor over the last five years, and analysts expect its demand to deteriorate over the next 12 months. While its top-tier scale enables operational efficiencies, capital market access, and investment in advanced technologies, the downside is its relatively low ROIC suggests management has struggled to find compelling investment opportunities. On top of that, its free cash flow volatility compared to commodity price volatility is bottom-tier in the sector, leading to highly volatile free cash flow.
NOV’s P/E ratio based on the next 12 months is 18.4x. This valuation tells us it’s a bit of a market darling with a lot of good news priced in - we think there are better stocks to buy right now.
Wall Street analysts have a consensus one-year price target of $19.90 on the company (compared to the current share price of $18.47).