
Halliburton (HAL)
Halliburton doesn’t impress us. Its sales have underperformed and its low returns on capital show it has few growth opportunities.― StockStory Analyst Team
1. News
2. Summary
Why Halliburton Is Not Exciting
Behind nearly every oil and gas well drilled worldwide, Halliburton (NYSE:HAL) provides drilling, completion, and production services that help oil and gas companies extract hydrocarbons from underground reservoirs.
- Gross margin of 16.8% is below its competitors, leaving less money to invest in exploration and production
- Responsiveness to unforeseen market trends is restricted due to its substandard EBITDA margin profitability
- A bright spot is that its massive revenue base of $22.18 billion makes it a household name that influences purchasing decisions


Halliburton doesn’t meet our quality criteria. There are more appealing investments to be made.
Why There Are Better Opportunities Than Halliburton


At $38.70 per share, Halliburton trades at 17.3x forward P/E. This multiple is cheaper than most energy upstream and integrated energy peers, but we think this is justified.
Cheap stocks can look like a great deal at first glance, but they can be value traps. They often have less earnings power, meaning there is more reliance on a re-rating to generate good returns - an unlikely scenario for low-quality companies.
3. Halliburton (HAL) Research Report: Q4 CY2025 Update
Oilfield services company Halliburton (NYSE:HAL) reported Q4 CY2025 results beating Wall Street’s revenue expectations, but sales were flat year on year at $5.66 billion. Its non-GAAP profit of $0.69 per share was 26.6% above analysts’ consensus estimates.
Halliburton (HAL) Q4 CY2025 Highlights:
- Revenue: $5.66 billion vs analyst estimates of $5.43 billion (flat year on year, 4.3% beat)
- Adjusted EPS: $0.69 vs analyst estimates of $0.55 (26.6% beat)
- Adjusted EBITDA: $1.12 billion vs analyst estimates of $1.01 billion (19.8% margin, 10.6% beat)
- Operating Margin: 13.2%, down from 16.6% in the same quarter last year
- Free Cash Flow Margin: 14.6%, down from 18.4% in the same quarter last year
- Market Capitalization: $28.52 billion
Company Overview
Behind nearly every oil and gas well drilled worldwide, Halliburton (NYSE:HAL) provides drilling, completion, and production services that help oil and gas companies extract hydrocarbons from underground reservoirs.
The company's work spans the entire lifecycle of an oil or gas well, from initial exploration to final production. In the drilling phase, Halliburton supplies the specialized fluids that lubricate drill bits and carry rock cuttings to the surface, along with the directional drilling technology that allows operators to steer wells horizontally to reach pockets of oil and gas thousands of feet underground. Its software helps energy companies map underground formations and plan optimal well paths before drilling begins.
Once a well is drilled, Halliburton's completion services prepare it for production. This includes cementing the well casing to prevent leaks, hydraulic fracturing (commonly called fracking) to create cracks in rock formations that allow oil and gas to flow more freely, and installing downhole equipment like pumps and valves. For example, an operator drilling a horizontal well in the Permian Basin of Texas might use Halliburton's pressure pumping equipment to fracture shale rock in multiple zones along a two-mile lateral wellbore, significantly increasing the well's output.
Throughout a well's producing life, the company provides artificial lift systems like electrical submersible pumps that bring fluids to the surface, specialty chemicals that optimize flow and prevent corrosion, and intervention services using coiled tubing to maintain or enhance production. Halliburton serves major integrated oil companies, independent exploration and production firms, and national oil companies across more than 70 countries, with North America representing a significant portion of its business.
4. Oilfield Services
Oilfield services companies provide equipment, technology, and services enabling exploration and production activities, including drilling, completion, well intervention, and reservoir evaluation. Their fortunes closely track upstream capital spending cycles. Tailwinds include increased drilling activity during favorable commodity environments, demand for efficiency-enhancing technologies, and growing offshore and unconventional resource development. Headwinds include significant revenue volatility tied to oil and gas price swings and producer spending discipline. Intense competition pressures pricing and margins, while the energy transition may structurally reduce long-term demand. Workforce availability and technological disruption require continuous adaptation.
Halliburton's primary competitors include Schlumberger (NYSE:SLB), Baker Hughes (NASDAQ:BKR), Weatherford International (NASDAQ:WFRD), and Liberty Energy (NYSE:LBRT) in the pressure pumping segment.
5. Economies of Scale
The size of the revenue base is a way to assess topline, and it tells an investor whether an Energy producer has crossed the line between being a more vulnerable commodity taker and a durable operating platform. Scaled businesses tend to produce and generate revenue from many wells, pads, takeaway routes, and geographies, not just a single field or drilling program. Halliburton’s $22.18 billion of revenue in the last year is top-tier for the industry, suggesting the type of diversification that reduces operational risk.
6. Revenue Growth
Cyclical sectors like Energy often flatter weaker operators during favorable price environments, but a longer-term lens separates those from businesses that can consistently perform across market cycles. Regrettably, Halliburton’s sales grew at a mediocre 9% compounded annual growth rate over the last five years. This fell short of our benchmark for the energy upstream and integrated energy sector and is a rough starting point for our analysis.
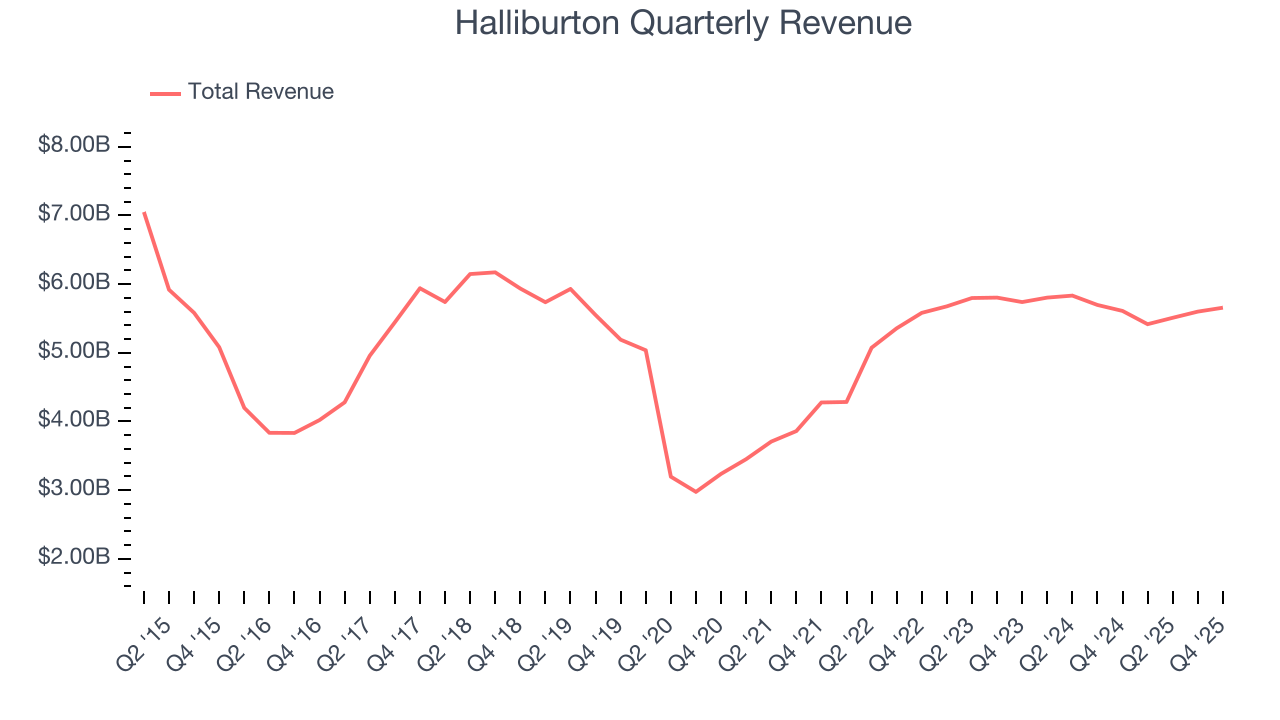
Energy cycles can be long enough that a single five-year period can still reflect one price environment, which is why an additional, decade-long view can help capture through-cycle performance. Halliburton’s recent performance shows its demand has accelerated as its revenue was flat over the last ten years.
Revenue provides useful context, but it is heavily influenced by commodity prices and acquisitions. Production volumes, by contrast, reveal whether the underlying asset base is actually growing. Over the last two years, Halliburton’s total oil volume per day - Upstream averaged 2.6% year-on-year declines. while natural gas volume per day - Upstream averaged 1.2% year-on-year declines.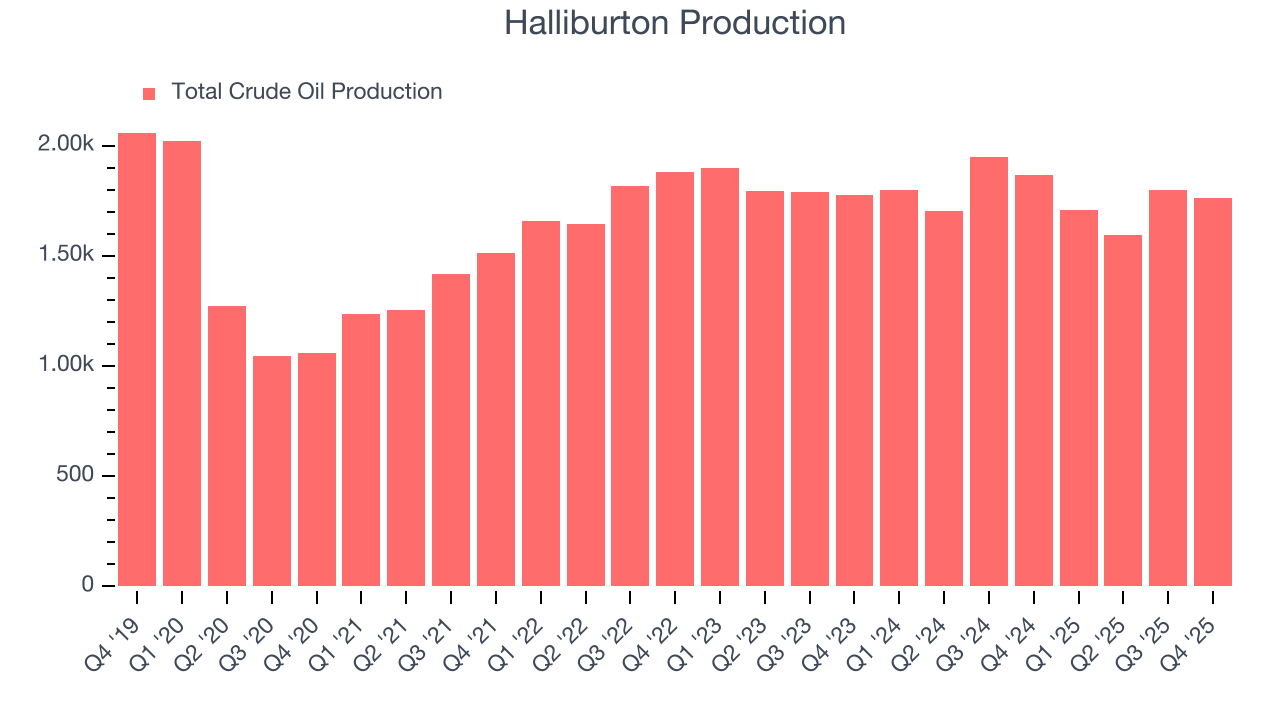
This quarter, Halliburton’s $5.66 billion of revenue was flat year on year but beat Wall Street’s estimates by 4.3%. This quarter, Halliburton missed Wall Street’s estimates and reported a rather uninspiring 5.8% year-on-year production decline, generating 1.8 Mboe of production.
7. Gross Margin
In any given year, energy gross margins are heavily influenced by prices, hedging, and cost inflation, but over a full cycle these gross margins reveal which producers are structurally advantaged through superior “rock” quality, infrastructure access, and cost position.
Halliburton, which averaged 16.8% gross margin over the last five years, exhibiting bottom-tier unit economics in the sector. It means the company will struggle at higher commodity prices than peers with better gross margins. 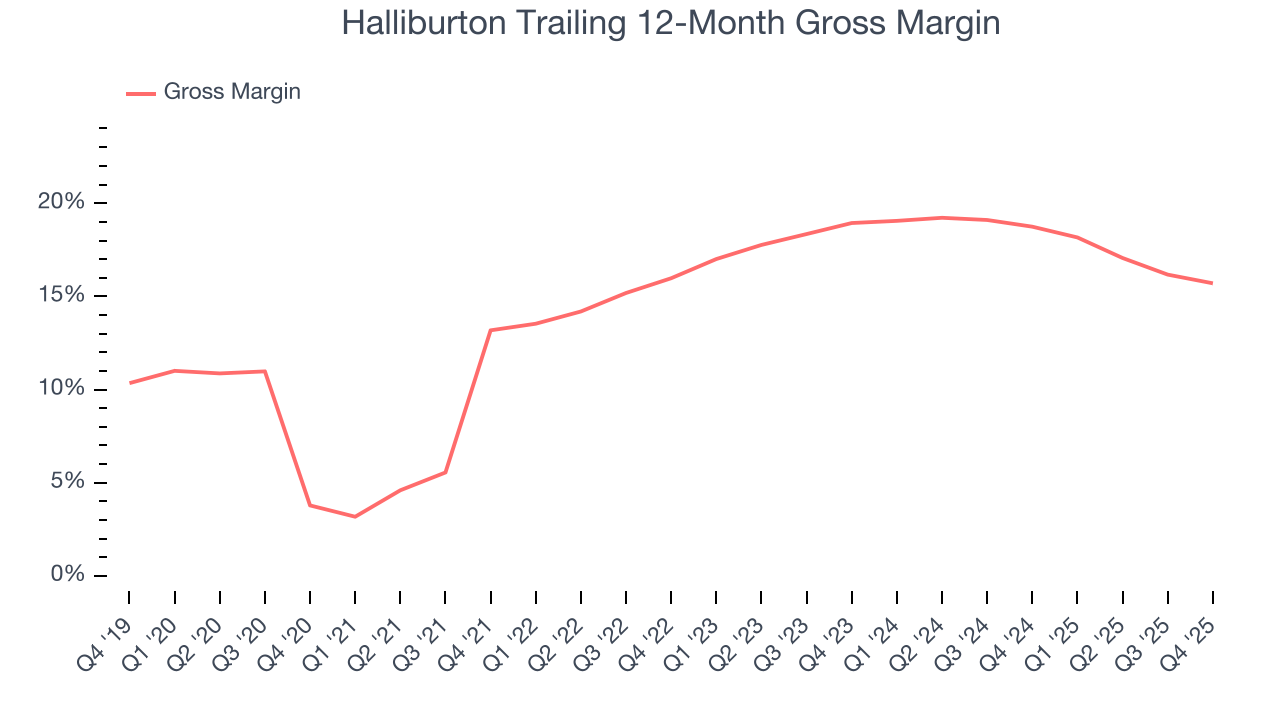
Halliburton produced a 16.4% gross profit margin in Q4 , marking a 1.8 percentage point decrease from 18.3% in the same quarter last year. Note that energy margins can be volatile due to commodity price changes.
8. Adjusted EBITDA Margin
Halliburton was profitable over the last five years but held back by its large cost base. Its average EBITDA margin of 20.3% was weak for an upstream and integrated energy business.
On the plus side, Halliburton’s EBITDA margin rose by 1.3 percentage points over the last year.
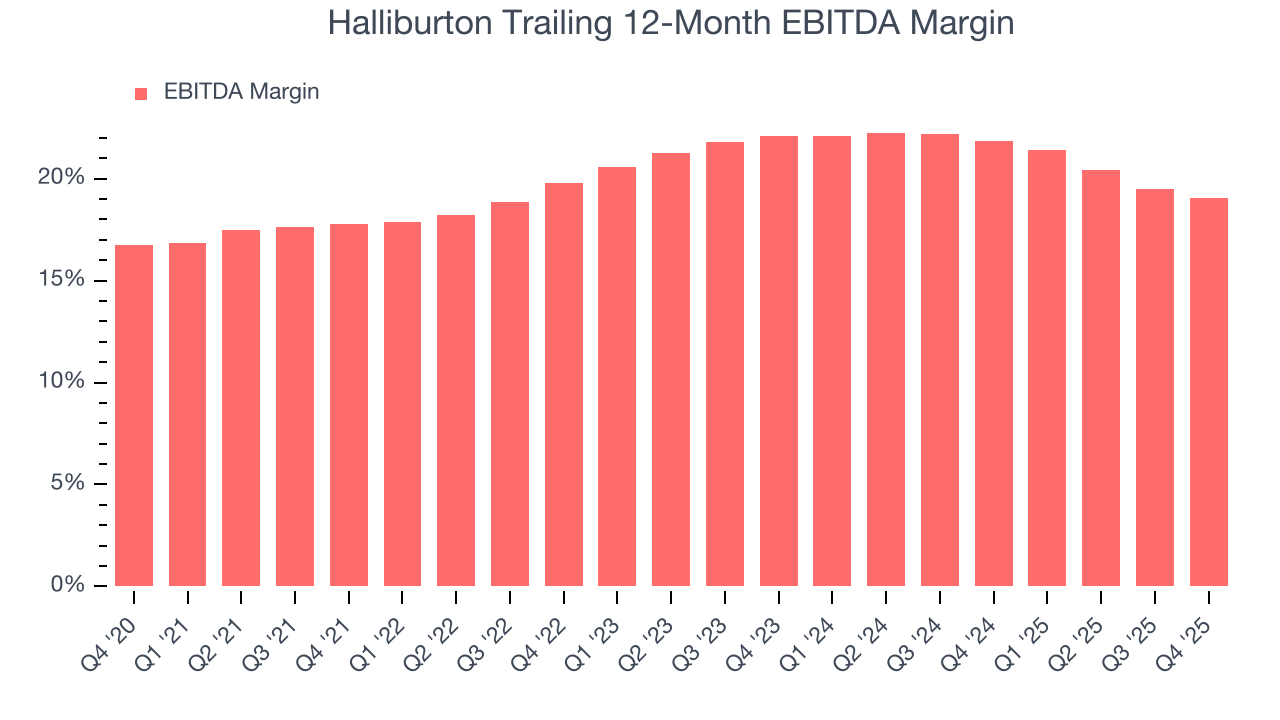
In Q4, Halliburton generated an EBITDA margin profit margin of 19.8%, down 1.7 percentage points year on year. This reduction is quite minuscule and indicates the company’s overall cost structure has been relatively stable. This adjusted EBITDA beat Wall Street’s estimates by 10.6%.
9. Cash Is King
As mentioned above, adjusted EBITDA ignores capital structure and drilling expenditure decisions. These are two huge aspects of an Energy producer, so in order to understand a comprehensive picture of business quality, an investor needs to account for these. Said differently, adjusted EBITDA margins could be solid but free cash flow is abysmal because decline rates of the asset are extreme and the drilling is expensive. Free cash flow tells you about not only the economics of the production that has happened but how much it costs to stay in business as well (further drilling or extraction).
Halliburton has shown decent cash profitability, giving it some flexibility to reinvest or return capital to investors. The company’s free cash flow margin averaged 8.2% over the last five years, slightly better than the broader energy upstream and integrated energy sector.
While the level of free cash flow margins is important, their consistency matters just as much.
Halliburton’s ratio of quarterly free cash flow volatility to WTI crude price volatility over the past five years was 5.3 (lower is better), indicating excellent insulation from commodity swings. This stability supports capital access in downturns and positions Halliburton to act as a consolidator when weaker peers are forced to retrench.
You may be asking why we wait until the free cash flow line to perform this stability analysis versus commodity prices. Why not compare revenue or EBITDA to WTI in the case of Halliburton? Because what ultimately matters is not how much revenue or profit you earn when prices are high but how much cash you can generate when prices are low. Free cash flow is the superior metric because it includes everything from hedging prowess to growth and maintenance capex to management behavior during good times and bad.
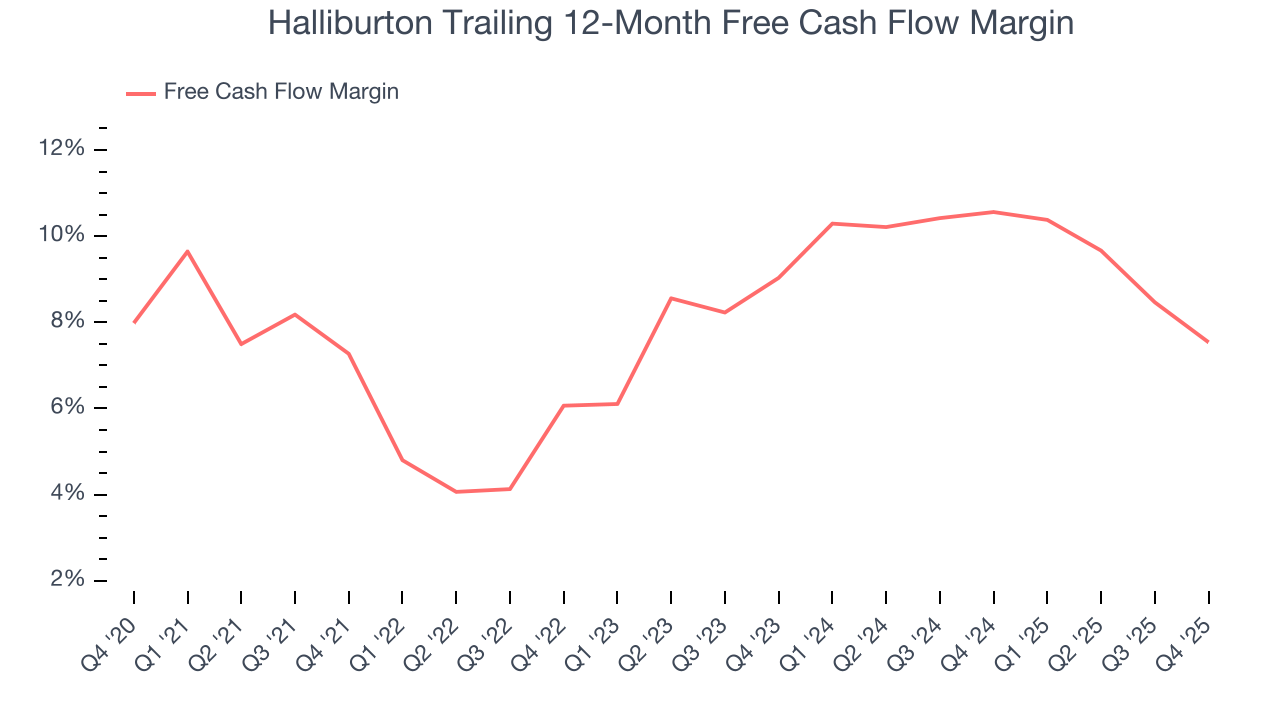
Halliburton’s free cash flow clocked in at $828 million in Q4, equivalent to a 14.6% margin. The company’s cash profitability regressed as it was 3.7 percentage points lower than in the same quarter last year, but it’s still above its five-year average. We wouldn’t read too much into this quarter’s decline because investment needs can be seasonal, causing short-term swings. Long-term trends trump temporary fluctuations.
10. Return on Invested Capital (ROIC)
Free cash flow tells investors how much money an Energy producer made, and ROIC takes this one step further by telling investors how well and effectively the business made it. ROIC illustrates how much operating profit a producer generated relative to the money it has raised (debt and equity).
We at StockStory like to look at ROIC over a ten-year period because energy investment cycles can involve up to five years of ramping production and another five years of harvesting. A decade view captures buying, extracting, and monetizing rather than just part of that picture. Halliburton historically did a mediocre job investing in profitable growth initiatives. Its ten-year average ROIC was 3.7%, lower than the typical cost of capital (how much it costs to raise money) for energy upstream and integrated energy companies.
We like to invest in businesses with high returns, but the trend in a company’s ROIC is what often surprises the market and moves the stock price. Over the last few years, Halliburton’s ROIC averaged 1.1 percentage point increases each year. This is a good sign, and we hope the company can continue improving.
11. Balance Sheet Assessment
Halliburton reported $2.21 billion of cash and $8.13 billion of debt on its balance sheet in the most recent quarter. As investors in high-quality companies, we primarily focus on two things: 1) that a company’s debt level isn’t too high and 2) that its interest payments are not excessively burdening the business.
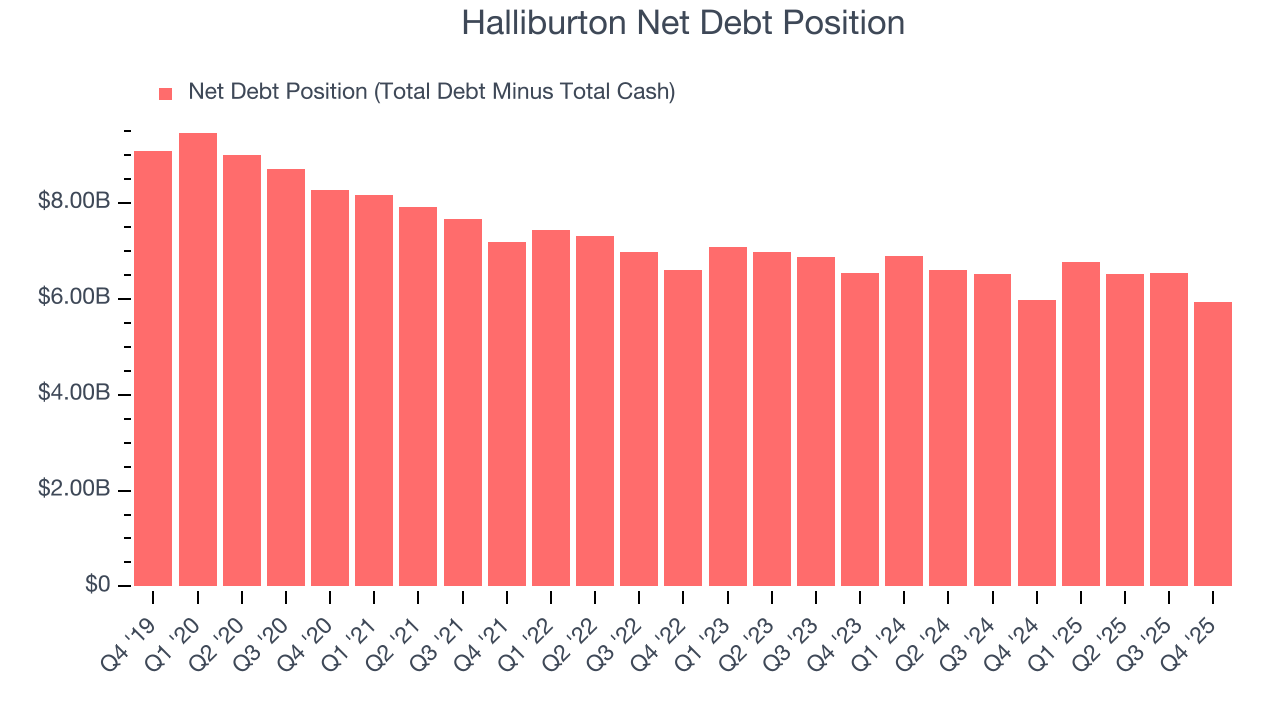
With $4.23 billion of EBITDA over the last 12 months, we view Halliburton’s 1.4× net-debt-to-EBITDA ratio as safe. We also see its $352 million of annual interest expenses as appropriate. The company’s profits give it plenty of breathing room, allowing it to continue investing in growth initiatives.
12. Key Takeaways from Halliburton’s Q4 Results
It was good to see Halliburton beat analysts’ EPS expectations this quarter. We were also excited its revenue outperformed Wall Street’s estimates by a wide margin. On the other hand, its production missed. Overall, we think this was a solid quarter with some key areas of upside. The stock remained flat at $34.38 immediately after reporting.
13. Is Now The Time To Buy Halliburton?
Updated: March 26, 2026 at 1:10 AM EDT
We think that the latest earnings result is only one piece of the bigger puzzle. If you’re deciding whether to own Halliburton, you should also grasp the company’s longer-term business quality and valuation.
Halliburton has some positive attributes, but it isn’t one of our picks. Although its revenue growth over the last five years was subpar for the sector and analysts expect growth to slow over the next 12 months, its top-tier scale enables operational efficiencies, capital market access, and investment in advanced technologies. We advise investors to be cautious with this one, however, as its gross margins show its business model is much less lucrative than other companies.
Halliburton’s P/E ratio based on the next 12 months is 17.3x. While this valuation is reasonable, we don’t really see a big opportunity at the moment. We're pretty confident there are superior stocks to buy right now.
Wall Street analysts have a consensus one-year price target of $37.06 on the company (compared to the current share price of $38.70).