
Helix Energy Solutions (HLX)
We’re cautious of Helix Energy Solutions. Its underwhelming returns on capital show it struggled to generate meaningful profits for shareholders.― StockStory Analyst Team
1. News
2. Summary
Why We Think Helix Energy Solutions Will Underperform
Playing a pivotal role in the 2010 Macondo oil spill response with its Q4000 vessel, Helix Energy Solutions (NYSE:HLX) provides specialized services to extend the life of offshore oil and gas wells and decommission aging infrastructure.
- Gross margin of 11.8% reflects its high production costs and unfavorable asset base
- Underwhelming 0.9% return on capital reflects management’s difficulties in finding profitable growth opportunities
- A consolation is that its EBITDA margin improvement of 6.8 percentage points over the last five years demonstrates its ability to scale efficiently


Helix Energy Solutions is skating on thin ice. We’d search for superior opportunities elsewhere.
Why There Are Better Opportunities Than Helix Energy Solutions


Helix Energy Solutions’s stock price of $9.59 implies a valuation ratio of 36.4x forward P/E. This multiple is higher than that of energy upstream and integrated energy peers; it’s also rich for the business quality. Not a great combination.
There are stocks out there similarly priced with better business quality. We prefer owning these.
3. Helix Energy Solutions (HLX) Research Report: Q4 CY2025 Update
Offshore energy services company Helix Energy Solutions (NYSE:HLX) beat Wall Street’s revenue expectations in Q4 CY2025, but sales fell by 5.9% year on year to $334.2 million. Its non-GAAP profit of $0.05 per share was significantly above analysts’ consensus estimates.
Helix Energy Solutions (HLX) Q4 CY2025 Highlights:
- Revenue: $334.2 million vs analyst estimates of $299.6 million (5.9% year-on-year decline, 11.6% beat)
- Adjusted EPS: $0.05 vs analyst estimates of $0.02 (significant beat)
- Adjusted EBITDA: $73.87 million vs analyst estimates of $58.86 million (22.1% margin, 25.5% beat)
- Operating Margin: 3.7%, down from 8.7% in the same quarter last year
- Free Cash Flow Margin: 32.2%, up from 18.4% in the same quarter last year
- Market Capitalization: $1.33 billion
Company Overview
Playing a pivotal role in the 2010 Macondo oil spill response with its Q4000 vessel, Helix Energy Solutions (NYSE:HLX) provides specialized services to extend the life of offshore oil and gas wells and decommission aging infrastructure.
Helix operates through four main business segments. Its Well Intervention segment uses specialized vessels like the Q4000, Q5000, and Q7000 to access subsea wells in water depths ranging from 100 to 10,000 feet. These operations allow energy companies to enhance production from existing wells or safely plug and abandon them at the end of their productive life. For example, an oil producer in the Gulf of Mexico might hire Helix to perform maintenance on a deepwater well that's experiencing declining output, potentially avoiding the significant expense of drilling a new well. The company operates globally, with vessels working in the Gulf of Mexico, Brazil, the North Sea, West Africa, and Asia Pacific regions.
The Robotics segment deploys remotely operated vehicles, or ROVs, and trenching equipment to support both oil and gas operations and offshore wind developments. These underwater robots perform tasks like burying subsea power cables, clearing boulders from construction sites, and inspecting pipelines and underwater structures. This segment generated 42% of its revenue from renewable energy projects in 2023, illustrating the company's expanding role beyond traditional oil and gas.
The Shallow Water Abandonment segment, acquired in 2022 through the Alliance purchase, focuses on decommissioning platforms and wells in the Gulf of Mexico's shallower waters using liftboats, diving vessels, and specialized plugging equipment. Meanwhile, the Production Facilities segment operates the Helix Producer I, a floating vessel that processes oil and gas from offshore fields, along with maintaining a fast response system for well control emergencies. Helix serves major and independent energy producers, pipeline companies, renewable energy developers, and offshore construction firms.
4. Oilfield Services
Oilfield services companies provide equipment, technology, and services enabling exploration and production activities, including drilling, completion, well intervention, and reservoir evaluation. Their fortunes closely track upstream capital spending cycles. Tailwinds include increased drilling activity during favorable commodity environments, demand for efficiency-enhancing technologies, and growing offshore and unconventional resource development. Headwinds include significant revenue volatility tied to oil and gas price swings and producer spending discipline. Intense competition pressures pricing and margins, while the energy transition may structurally reduce long-term demand. Workforce availability and technological disruption require continuous adaptation.
Helix Energy Solutions faces competition from AKOFS Offshore, Baker Hughes (NASDAQ:BKR), Oceaneering (NYSE:OII), TechnipFMC (NYSE:FTI), Well-Safe Solutions, and drilling contractors across its well intervention business, along with companies like Fugro, DOF Subsea, and Atlantic Marine in robotics.
5. Revenue Scale
The size of the revenue base is a way to assess topline, and it tells an investor whether an Energy producer has crossed the line between being a more vulnerable commodity taker and a durable operating platform. Scaled businesses tend to produce and generate revenue from many wells, pads, takeaway routes, and geographies, not just a single field or drilling program. Helix Energy Solutions’s $1.29 billion of revenue in the last year is pretty small for the industry, suggesting the type of diversification that reduces operational risk.
6. Revenue Growth
Cyclical industries such as Energy can make mediocre companies look great for a time, but a long-term view reveals which businesses can actually withstand and adapt to changing conditions. Over the last five years, Helix Energy Solutions grew its sales at a decent 12% compounded annual growth rate. Its growth was slightly above the average energy upstream and integrated energy company and shows its offerings resonate with customers.
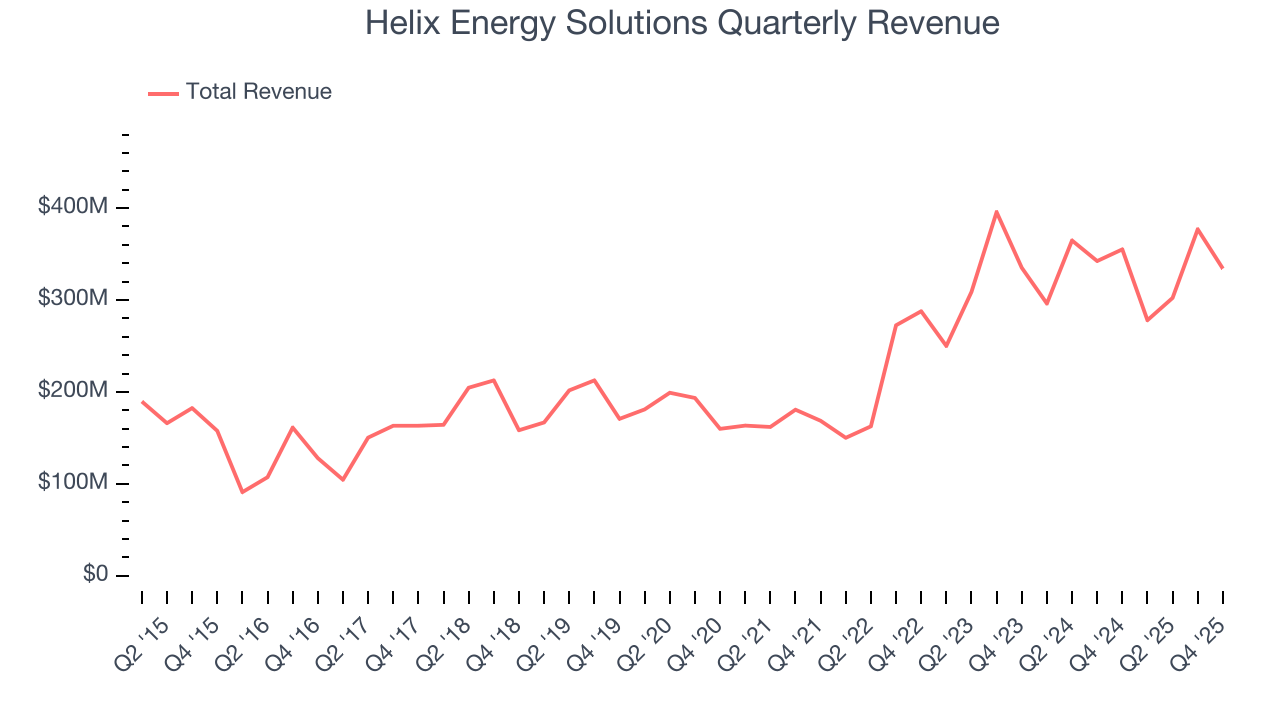
Within Energy, a singular timeframe, even if it’s quite long-term, only sheds light on how well a company rode the last commodity cycle. To better assess whether a company compounds through cycles, we validate our view with an even longer, ten-year view. Helix Energy Solutions’s annualized revenue growth of 6.4% over the last ten years is below its five-year trend, but we still think the results were good.
This quarter, Helix Energy Solutions’s revenue fell by 5.9% year on year to $334.2 million but beat Wall Street’s estimates by 11.6%.
7. Gross Margin
In any given year, energy gross margins are heavily influenced by prices, hedging, and cost inflation, but over a full cycle these gross margins reveal which producers are structurally advantaged through superior “rock” quality, infrastructure access, and cost position.
Helix Energy Solutions, which averaged 11.8% gross margin over the last five years, exhibiting bottom-tier unit economics in the sector. It means the company will struggle at higher commodity prices than peers with better gross margins. 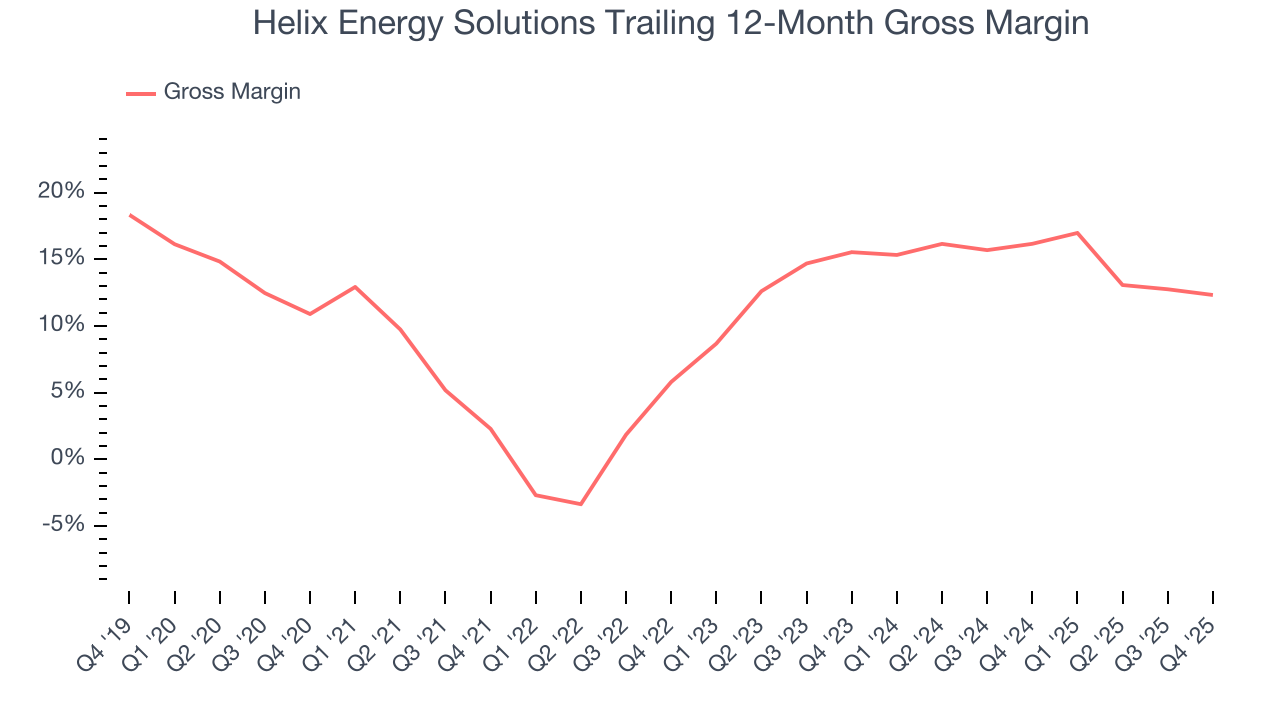
In Q4, Helix Energy Solutions produced a 15.2% gross profit margin , marking a 1.4 percentage point decrease from 16.6% in the same quarter last year. Note that energy margins can be volatile due to commodity price changes.
8. Adjusted EBITDA Margin
Helix Energy Solutions was profitable over the last five years but held back by its large cost base. Its average EBITDA margin of 19.4% was weak for an upstream and integrated energy business.
On the plus side, Helix Energy Solutions’s EBITDA margin rose by 6.8 percentage points over the last year, as its sales growth gave it operating leverage.
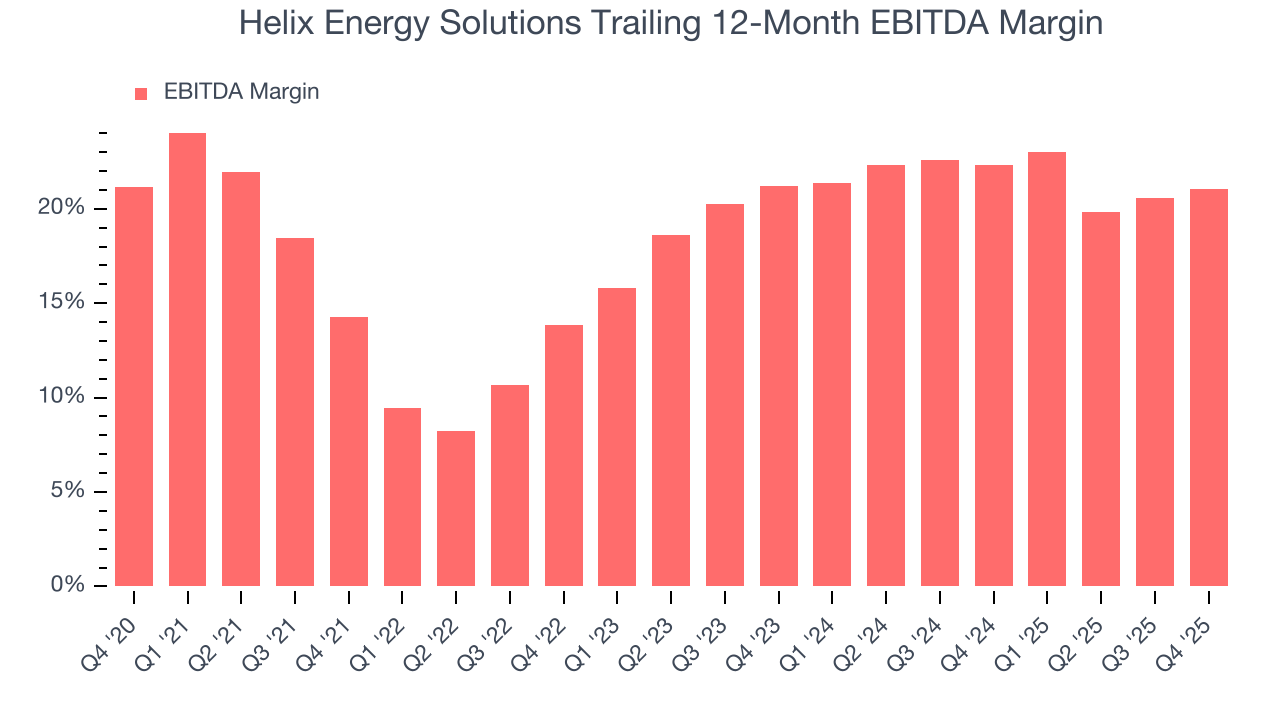
In Q4, Helix Energy Solutions generated an EBITDA margin profit margin of 22.1%, up 1.9 percentage points year on year. This increase was a welcome development, especially since its revenue fell, showing it was more efficient because it scaled down its expenses. This adjusted EBITDA beat Wall Street’s estimates by 25.5%.
9. Cash Is King
Adjusted EBITDA shows how profitable a company’s existing “rock” is before financing and reinvestment, while free cash flow shows how much value remains after paying to replace those wells. Because production declines over time, strong EBITDA can coexist with weak FCF if drilling is expensive or declines are steep. FCF therefore captures both operating efficiency and the cost of sustaining production.
Helix Energy Solutions has shown decent cash profitability, giving it some flexibility to reinvest or return capital to investors. The company’s free cash flow margin averaged 9.8% over the last five years, slightly better than the broader energy upstream and integrated energy sector.
While the level of free cash flow margins is important, their consistency matters just as much.
Helix Energy Solutions’s ratio of quarterly free cash flow volatility to WTI crude price volatility over the past five years was 8.4 (lower is better), indicating reasonable insulation from commodity swings.
You may be asking why we wait until the free cash flow line to perform this stability analysis versus commodity prices. Why not compare revenue or EBITDA to WTI Crude prices in the case of Helix Energy Solutions? Because what ultimately matters is not how much revenue or profit you earn when prices are high but how much cash you can generate when prices are low. Free cash flow is the superior metric because it includes everything from hedging prowess to growth and maintenance capex to management behavior during good times and bad.
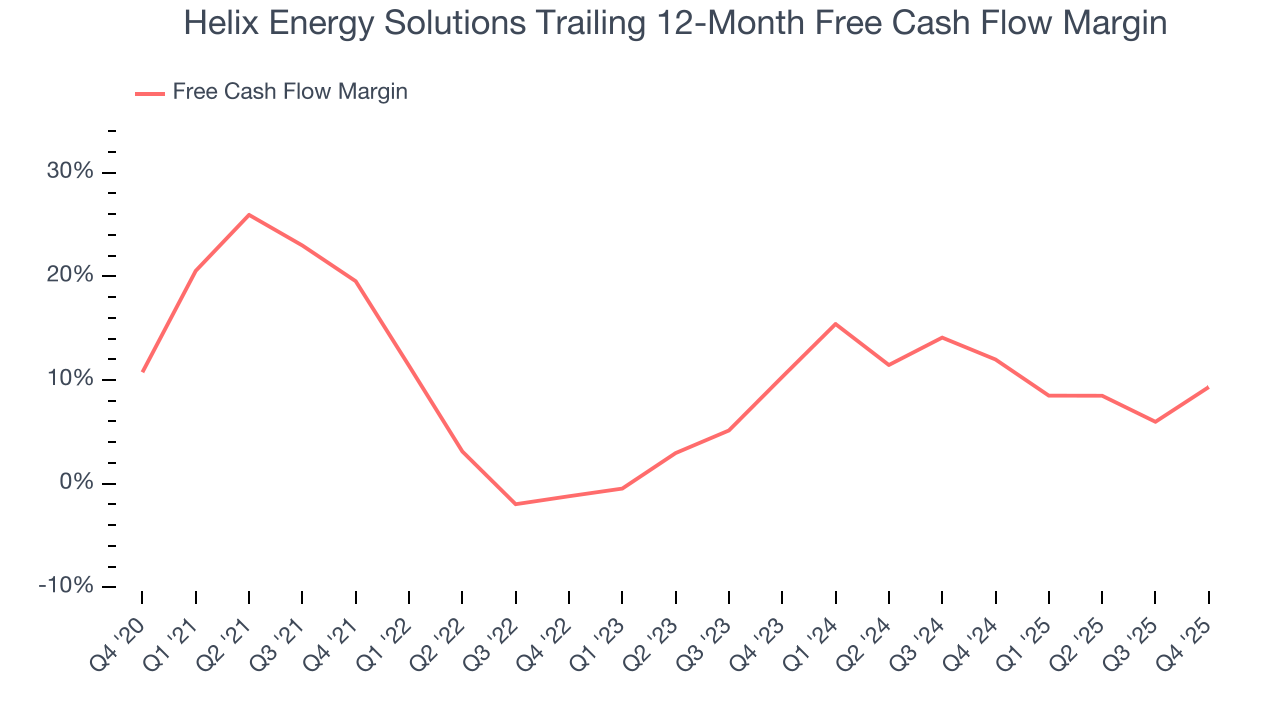
Helix Energy Solutions’s free cash flow clocked in at $107.5 million in Q4, equivalent to a 32.2% margin. This result was good as its margin was 13.7 percentage points higher than in the same quarter last year, but we wouldn’t put too much weight on the short term because investment needs can be seasonal, causing temporary swings. Long-term trends trump fluctuations.
10. Return on Invested Capital (ROIC)
Free cash flow tells investors how much money an Energy producer made, and ROIC takes this one step further by telling investors how well and effectively the business made it. ROIC illustrates how much operating profit a producer generated relative to the money it has raised (debt and equity).
We at StockStory like to look at ROIC over a ten-year period because energy investment cycles can involve up to five years of ramping production and another five years of harvesting. A decade view captures buying, extracting, and monetizing rather than just part of that picture. Helix Energy Solutions historically did a mediocre job investing in profitable growth initiatives. Its ten-year average ROIC was 0.9%, lower than the typical cost of capital (how much it costs to raise money) for energy upstream and integrated energy companies.
We like to invest in businesses with high returns, but the trend in a company’s ROIC is what often surprises the market and moves the stock price. Helix Energy Solutions’s ROIC has increased over the last few years. This is a good sign, and we hope the company can continue improving.
11. Balance Sheet Assessment
Helix Energy Solutions reported $445.2 million of cash and $629.8 million of debt on its balance sheet in the most recent quarter. As investors in high-quality companies, we primarily focus on two things: 1) that a company’s debt level isn’t too high and 2) that its interest payments are not excessively burdening the business.
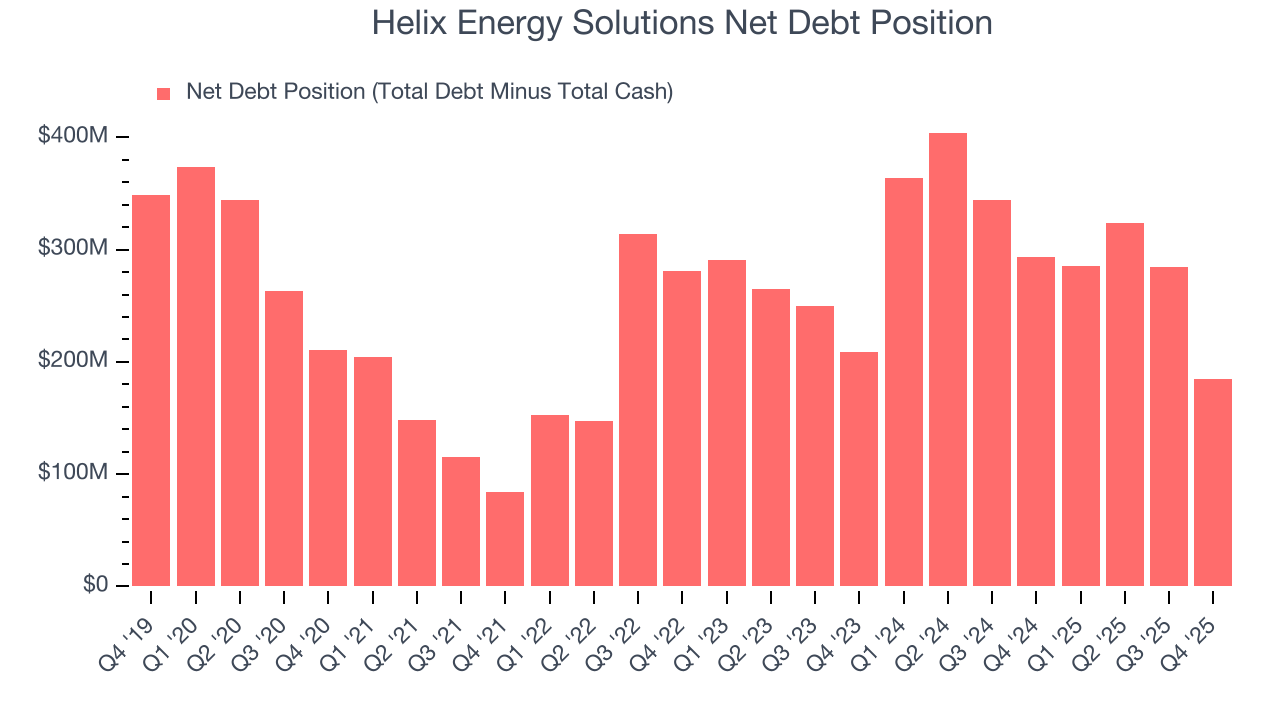
With $272 million of EBITDA over the last 12 months, we view Helix Energy Solutions’s 0.7× net-debt-to-EBITDA ratio as safe. We also see its $22.78 million of annual interest expenses as appropriate. The company’s profits give it plenty of breathing room, allowing it to continue investing in growth initiatives.
12. Key Takeaways from Helix Energy Solutions’s Q4 Results
It was good to see Helix Energy Solutions beat analysts’ EPS expectations this quarter. We were also excited its EBITDA outperformed Wall Street’s estimates by a wide margin. Zooming out, we think this quarter featured some important positives. The stock remained flat at $9.09 immediately after reporting.
13. Is Now The Time To Buy Helix Energy Solutions?
Updated: March 22, 2026 at 1:14 AM EDT
The latest quarterly earnings matters, sure, but we actually think longer-term fundamentals and valuation matter more. Investors should consider all these pieces before deciding whether or not to invest in Helix Energy Solutions.
Helix Energy Solutions isn’t a terrible business, but it doesn’t pass our bar. Although its revenue growth over the last five years was average for the sector, it’s expected to deteriorate over the next 12 months and its relatively low ROIC suggests management has struggled to find compelling investment opportunities. And while the company’s expanding EBITDA margin shows the business has become more efficient, the downside is its gross margins show its business model is much less lucrative than other companies.
Helix Energy Solutions’s P/E ratio based on the next 12 months is 36.4x. This multiple tells us a lot of good news is priced in - we think other companies feature superior fundamentals at the moment.
Wall Street analysts have a consensus one-year price target of $11.50 on the company (compared to the current share price of $9.59).
Although the price target is bullish, readers should exercise caution because analysts tend to be overly optimistic. The firms they work for, often big banks, have relationships with companies that extend into fundraising, M&A advisory, and other rewarding business lines. As a result, they typically hesitate to say bad things for fear they will lose out. We at StockStory do not suffer from such conflicts of interest, so we’ll always tell it like it is.