
Nabors Industries (NBR)
Nabors Industries doesn’t excite us. Its sales have underperformed and its low returns on capital show it has few growth opportunities.― StockStory Analyst Team
1. News


2. Summary
Why We Think Nabors Industries Will Underperform
Operating one of the largest land-based drilling rig fleets in the world with over 285 rigs across more than 15 countries, Nabors Industries (NYSE:NBR) operates drilling rigs and provides related services to help oil and gas companies drill wells on land and offshore platforms.
- Below-average returns on capital indicate management struggled to find compelling investment opportunities
- poor earning stability in the sector may keep investors up at night
- One positive is that its EBITDA profits increased over the last five years as the company gained some leverage on its fixed costs and became more efficient


Nabors Industries falls short of our expectations. We’ve identified better opportunities elsewhere.
Why There Are Better Opportunities Than Nabors Industries


At $76.55 per share, Nabors Industries trades at 2.9x forward EV-to-EBITDA. This sure is a cheap multiple, but you get what you pay for.
Cheap stocks can look like great bargains at first glance, but you often get what you pay for. These mediocre businesses often have less earnings power, meaning there is more reliance on a re-rating to generate good returns - an unlikely scenario for low-quality companies.
3. Nabors Industries (NBR) Research Report: Q4 CY2025 Update
Drilling services company Nabors Industries (NYSE:NBR) beat Wall Street’s revenue expectations in Q4 CY2025, with sales up 9.3% year on year to $797.5 million. Its non-GAAP profit of $0.95 per share was significantly above analysts’ consensus estimates.
Nabors Industries (NBR) Q4 CY2025 Highlights:
- Revenue: $797.5 million vs analyst estimates of $791.4 million (9.3% year-on-year growth, 0.8% beat)
- Adjusted EPS: $0.95 vs analyst estimates of -$1.39 (significant beat)
- Adjusted EBITDA: $221.6 million vs analyst estimates of $217.5 million (27.8% margin, 1.9% beat)
- Operating Margin: 7.8%, in line with the same quarter last year
- Free Cash Flow was $83.78 million, up from -$59.13 million in the same quarter last year
- Market Capitalization: $1.16 billion
Company Overview
Operating one of the largest land-based drilling rig fleets in the world with over 285 rigs across more than 15 countries, Nabors Industries (NYSE:NBR) operates drilling rigs and provides related services to help oil and gas companies drill wells on land and offshore platforms.
The company's business centers on providing the physical rigs and crews that drill wells for oil and gas producers who don't want to own this equipment themselves. When an oil company like Saudi Aramco needs to drill a new well in the desert or an independent producer needs to tap a shale formation in Texas, they contract with Nabors to bring in a rig, drill the well to the specified depth, and then move on to the next location. Most of these arrangements are daywork contracts where Nabors charges a daily rate for the rig and crew, though some are based on footage drilled or a fixed price for the entire well.
Nabors organizes its operations into four segments. U.S. Drilling operates roughly 180 land rigs across the Lower 48 states, Alaska, and offshore platform rigs in the Gulf of Mexico. International Drilling runs about 130 rigs primarily in Saudi Arabia, Argentina, Colombia, and Mexico. The company has developed specialized rigs like its PACE-X800, equipped with a walking system that allows it to move efficiently between multiple wells on the same pad without being fully disassembled—a significant time-saver for drilling multiple wells in tight formations.
Beyond just providing rigs, Nabors has expanded into complementary services through its Drilling Solutions segment, which offers directional steering systems like ROCKit that help drillers navigate to precise locations underground, as well as software platforms that provide real-time operational data. Its Rig Technologies segment manufactures and sells drilling equipment such as top drives and drawworks to both its own fleet and third-party operators. The company generates revenue through daily rig rates, equipment sales, and fees for its specialized drilling technologies and services. Saudi Aramco represents approximately 31% of its total revenue, primarily through a joint venture called SANAD.
4. Oilfield Services
Oilfield services companies provide equipment, technology, and services enabling exploration and production activities, including drilling, completion, well intervention, and reservoir evaluation. Their fortunes closely track upstream capital spending cycles. Tailwinds include increased drilling activity during favorable commodity environments, demand for efficiency-enhancing technologies, and growing offshore and unconventional resource development. Headwinds include significant revenue volatility tied to oil and gas price swings and producer spending discipline. Intense competition pressures pricing and margins, while the energy transition may structurally reduce long-term demand. Workforce availability and technological disruption require continuous adaptation.
Nabors competes with Helmerich & Payne (NYSE:HP), Patterson-UTI Energy (NASDAQ:PTEN), Precision Drilling (NYSE:PDS), and Ensign Energy Services (NYSE:ESI) in drilling services. In equipment and technology, it faces competition from NOV (NYSE:NOV), Baker Hughes (NASDAQ:BKR), Halliburton (NYSE:HAL), and Schlumberger (NYSE:SLB).
5. Economies of Scale
The size of the revenue base is a way to assess topline, and it tells an investor whether an Energy producer has crossed the line between being a more vulnerable commodity taker and a durable operating platform. Scaled businesses tend to produce and generate revenue from many wells, pads, takeaway routes, and geographies, not just a single field or drilling program. Nabors Industries’s $3.18 billion of revenue in the last year lacks scale in an industry where it matters.
6. Revenue Growth
Cyclical sectors like Energy often flatter weaker operators during favorable price environments, but a longer-term lens separates those from businesses that can consistently perform across market cycles. Over the last five years, Nabors Industries grew its sales at a tepid 8.3% compounded annual growth rate. This was below our standard for the energy upstream and integrated energy sector and is a rough starting point for our analysis.
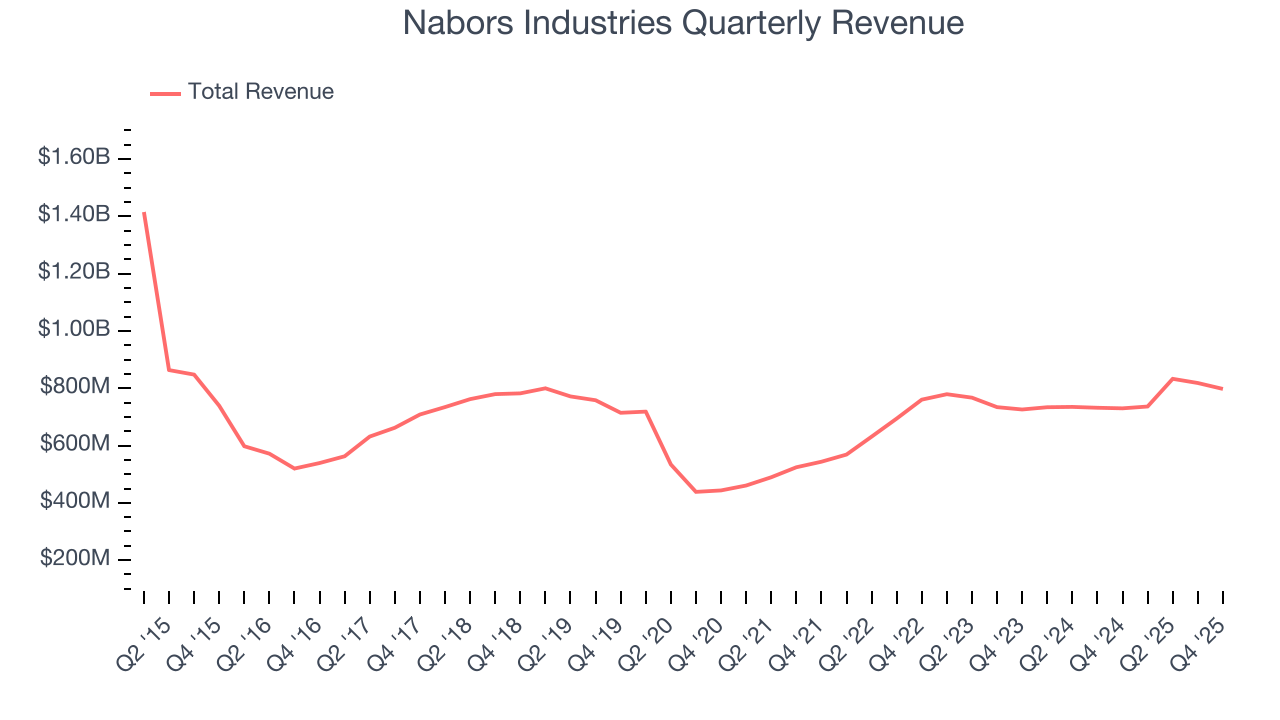
Even a long stretch in Energy can be shaped by a single commodity cycle, so extending the view to ten years adds another perspective and reveals which companies are built to grow regardless of the pricing regime. Nabors Industries’s performance shows it grew in the past five-year but relinquished its gains over the last ten years, as its revenue fell by 1.9% annually.
This quarter, Nabors Industries reported year-on-year revenue growth of 9.3%, and its $797.5 million of revenue exceeded Wall Street’s estimates by 0.8%.
7. Gross Margin
In a single quarter or year, gross margins in the sector can swing wildly due to commodity prices, hedging, or changes in labor costs. Over a multi-year period across different points in the cycle, gross margin differences can signal whether a company is a structurally-advantaged producer (“rock” quality, takeaway, operating costs) or not.
Nabors Industries, which averaged 39.1% gross margin over the last five years, exhibits poor unit economics in the sector. It means the company will struggle more at lower commodity prices than peers with better gross margins. 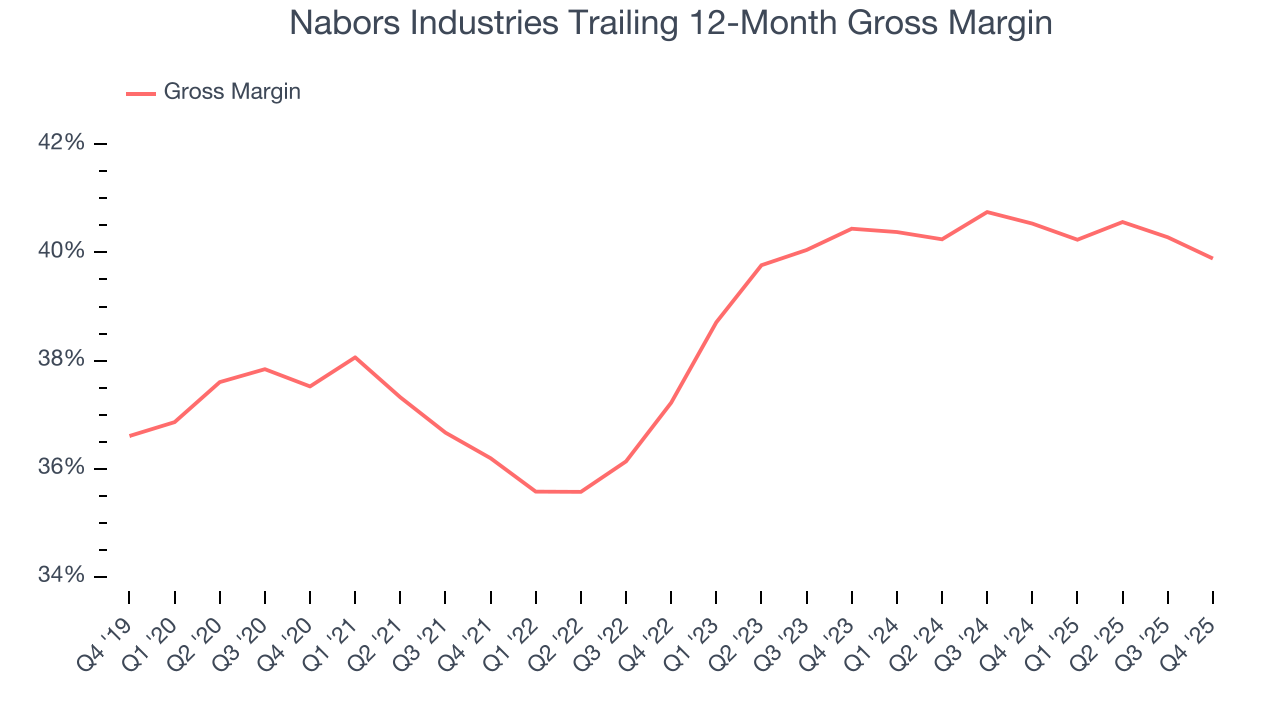
In Q4, Nabors Industries produced a 39% gross profit margin, down 1.6 percentage points year on year.
8. Adjusted EBITDA Margin
Adjusted EBITDA margin captures the true operating profitability of an energy producer by removing accounting noise around depletion and capitalized drilling costs. It reveals how much cash the asset base generates before capital structure and reinvestment requirements shape reported earnings.
Nabors Industries was profitable over the last five years but held back by its large cost base. Its average EBITDA margin of 28.3% was weak for an upstream and integrated energy business.
On the plus side, Nabors Industries’s EBITDA margin rose by 4.8 percentage points over the last year.
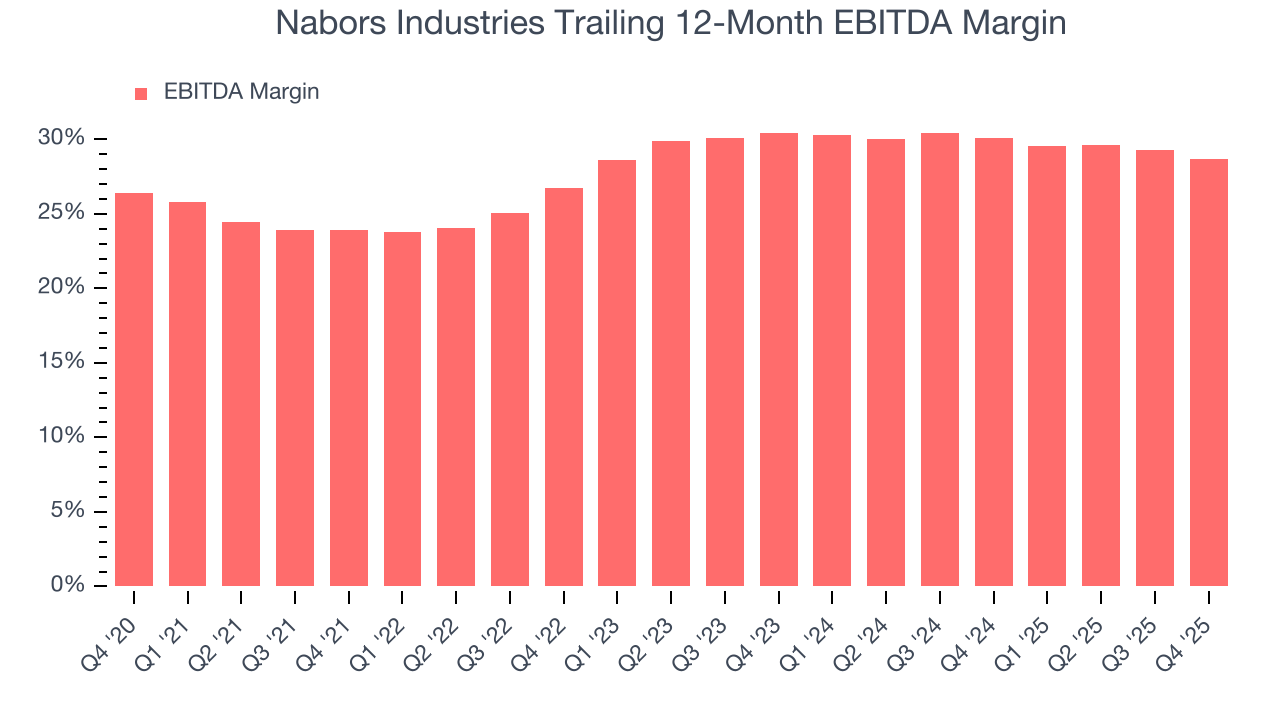
This quarter, Nabors Industries generated an EBITDA margin profit margin of 27.8%, down 2.4 percentage points year on year. This contraction shows it was less efficient because its expenses grew faster than its revenue. This adjusted EBITDA beat Wall Street’s estimates by 1.9%.
9. Cash Is King
Adjusted EBITDA shows how profitable a company’s existing wells are before financing and reinvestment decisions, but free cash flow shows how much value remains after paying the cost of replacing those wells. In upstream energy, production naturally declines over time, so companies must continuously reinvest just to stand still. A producer can report strong EBITDA margins yet generate little or no free cash flow if its wells decline quickly or if new drilling is expensive. Free cash flow therefore captures not only how efficiently a company produces hydrocarbons today, but also how costly it is to sustain that production into the future.
Nabors Industries has shown weak cash profitability relative to peers over the last five years, giving the company fewer opportunities to return capital to shareholders. Its free cash flow margin averaged 3%, below what we’d expect for an upstream and integrated energy business.
While the level of free cash flow margins is important, their consistency matters just as much.
Nabors Industries’s ratio of quarterly free cash flow volatility to WTI crude price volatility over the past five years was 14 (lower is better), indicating that its cash generation is far more sensitive to commodity-price swings than most peers. This elevated volatility limits its access to capital in downturns and makes it unlikely to act as a consolidator when weaker competitors come under pressure.
You may be asking why we wait until the free cash flow line to perform this stability analysis versus commodity prices. Why not compare revenue or EBITDA to WTI in the case of Nabors Industries? Because what ultimately matters is not how much revenue or profit you earn when prices are high but how much cash you can generate when prices are low. Free cash flow is the superior metric because it includes everything from hedging prowess to growth and maintenance capex to management behavior during good times and bad.
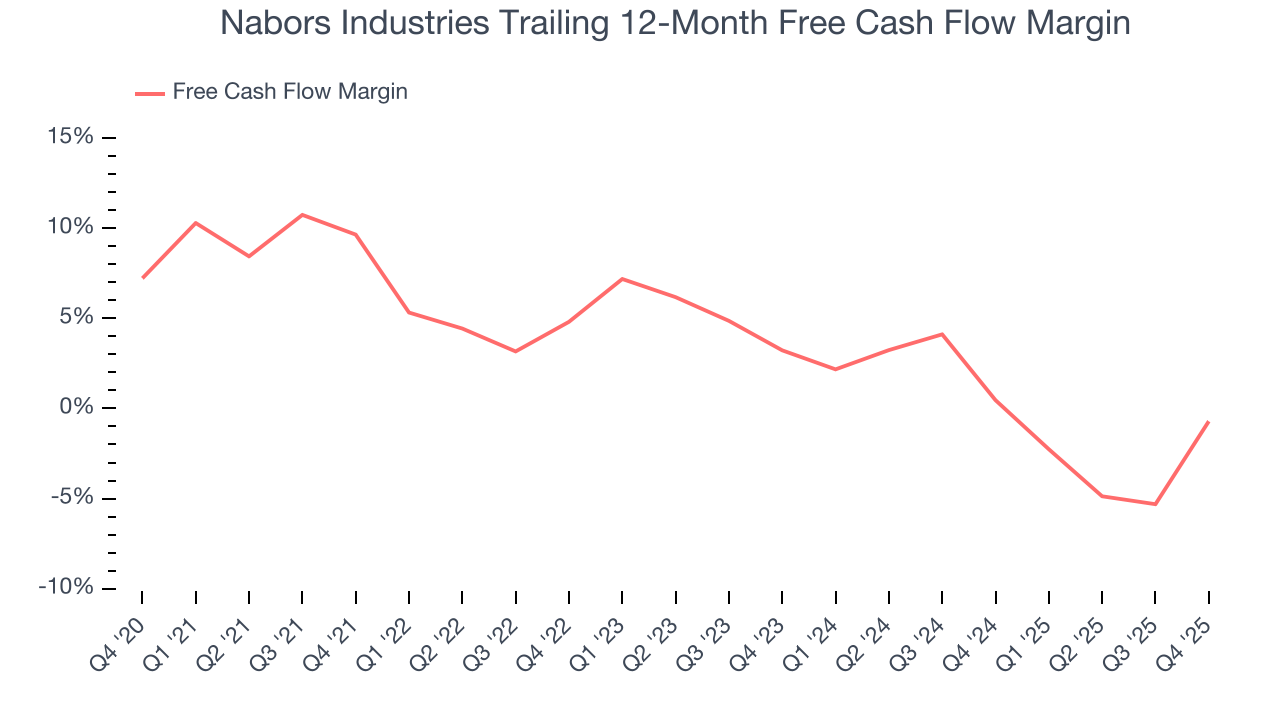
Nabors Industries’s free cash flow clocked in at $83.78 million in Q4, equivalent to a 10.5% margin. Its cash flow turned positive after being negative in the same quarter last year, but we wouldn’t put too much weight on the short term because investment needs can be seasonal, causing temporary swings. Long-term trends trump fluctuations.
10. Return on Invested Capital (ROIC)
Free cash flow shows how much money a producer generated, while ROIC shows how efficiently that money was earned. ROIC measures the operating profit produced for each dollar of capital invested, whether from debt or equity. Cash generation measures quantity while ROIC measures the quality of value creation.
We at StockStory like to look at ROIC over a ten-year period because energy investment cycles can involve up to five years of ramping production and another five years of harvesting. A decade view captures buying, extracting, and monetizing rather than just part of that picture. Nabors Industries’s ten-year average ROIC was negative 0.7%, meaning management lost money while trying to expand the business. Its returns were among the worst in the energy upstream and integrated energy sector.
We like to invest in businesses with high returns, but the trend in a company’s ROIC is what often surprises the market and moves the stock price. Nabors Industries’s ROIC has increased significantly over the last few years. This is a good sign, and we hope the company can continue improving.
11. Balance Sheet Assessment
Nabors Industries reported $940.7 million of cash and $2.49 billion of debt on its balance sheet in the most recent quarter. As investors in high-quality companies, we primarily focus on two things: 1) that a company’s debt level isn’t too high and 2) that its interest payments are not excessively burdening the business.
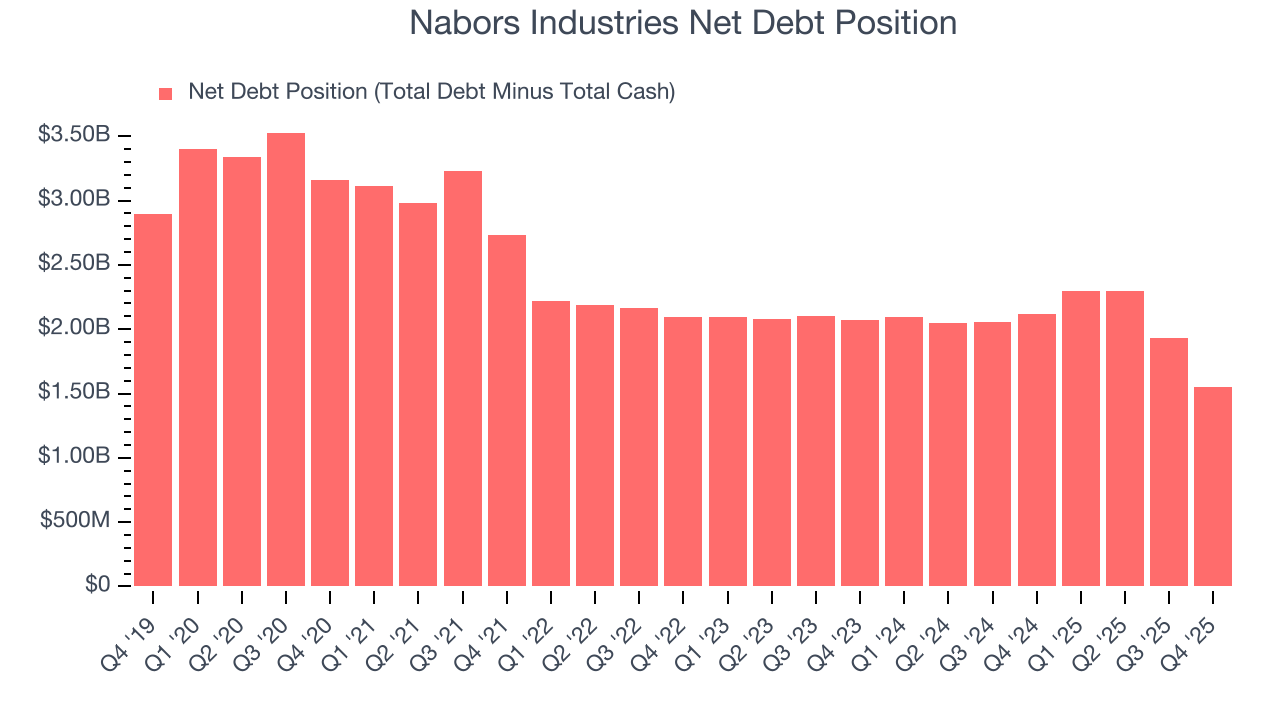
With $912.7 million of EBITDA over the last 12 months, we view Nabors Industries’s 1.7× net-debt-to-EBITDA ratio as safe. We also see its $187.7 million of annual interest expenses as appropriate. The company’s profits give it plenty of breathing room, allowing it to continue investing in growth initiatives.
12. Key Takeaways from Nabors Industries’s Q4 Results
It was good to see Nabors Industries beat analysts’ EPS expectations this quarter. We were also happy its revenue narrowly outperformed Wall Street’s estimates. Overall, we think this was a solid quarter with some key areas of upside. The stock traded up 3.1% to $81.20 immediately after reporting.
13. Is Now The Time To Buy Nabors Industries?
Updated: March 16, 2026 at 1:18 AM EDT
Before making an investment decision, investors should account for Nabors Industries’s business fundamentals and valuation in addition to what happened in the latest quarter.
Nabors Industries isn’t a terrible business, but it doesn’t pass our bar. First off, its revenue growth over the last five years was subpar for the sector, and analysts expect its demand to deteriorate over the next 12 months. While its expanding EBITDA margin shows the business has become more efficient, the downside is its relatively low ROIC suggests management has struggled to find compelling investment opportunities. On top of that, its free cash flow volatility compared to commodity price volatility is bottom-tier in the sector, leading to highly volatile free cash flow.
Nabors Industries’s EV-to-EBITDA ratio based on the next 12 months is 2.9x. While this valuation is optically cheap, the potential downside is big given its shaky fundamentals. We're pretty confident there are superior stocks to buy right now.
Wall Street analysts have a consensus one-year price target of $71.25 on the company (compared to the current share price of $76.55).