
Liberty Energy (LBRT)
Liberty Energy catches our eye. Its elite revenue growth and returns on capital demonstrate it can grow rapidly and profitably.― StockStory Analyst Team
1. News


2. Summary
Why Liberty Energy Is Interesting
Operating approximately 40 active fleets across North America's most productive shale basins, Liberty Energy (NYSE:LBRT) provides hydraulic fracturing services that help oil and gas companies extract resources from shale formations.
- Annual revenue growth of 30.1% over the past nine years was outstanding, reflecting market share gains this cycle
- Annual revenue growth of 32.9% over the last five years was superb and indicates its market share increased during this cycle
- A downside is its gross margin of 23.2% is below its competitors, leaving less money to invest in exploration and production


Liberty Energy shows some potential. If you like the story, the price looks fair.
Why Is Now The Time To Buy Liberty Energy?


Liberty Energy is trading at $30.23 per share, or 11.4x forward EV-to-EBITDA. While Liberty Energy’s valuation is higher than that of many in the energy upstream and integrated energy space, we still think the valuation is fair given the top-line growth.
If you think the market is undervaluing the company, now could be a good time to build a position.
3. Liberty Energy (LBRT) Research Report: Q4 CY2025 Update
Hydraulic fracturing services company Liberty Energy (NYSE:LBRT) beat Wall Street’s revenue expectations in Q4 CY2025, with sales up 10.1% year on year to $1.04 billion. Its non-GAAP profit of $0.05 per share was significantly above analysts’ consensus estimates.
Liberty Energy (LBRT) Q4 CY2025 Highlights:
- Revenue: $1.04 billion vs analyst estimates of $893.5 million (10.1% year-on-year growth, 16.3% beat)
- Adjusted EPS: $0.05 vs analyst estimates of -$0.17 (significant beat)
- Adjusted EBITDA: $157.5 million vs analyst estimates of $105.1 million (15.2% margin, 49.8% beat)
- Operating Margin: 1.9%, in line with the same quarter last year
- Free Cash Flow was $11.13 million, up from -$26.2 million in the same quarter last year
- Market Capitalization: $4.59 billion
Company Overview
Operating approximately 40 active fleets across North America's most productive shale basins, Liberty Energy (NYSE:LBRT) provides hydraulic fracturing services that help oil and gas companies extract resources from shale formations.
Hydraulic fracturing, commonly known as fracking, involves pumping a mixture of water, sand, and chemicals at high pressure into underground rock formations to create fractures that allow trapped oil and gas to flow more freely to the wellbore. Liberty Energy's fleets consist of mobile units with high-pressure pumps, engines, transmissions, blenders, and other specialized equipment mounted on trailers, along with crews that operate them. Each fleet is configured based on the specific requirements of the job and the characteristics of the formation being completed.
The company operates across major North American shale basins, including the Permian Basin in Texas and New Mexico, the Williston Basin in North Dakota, the Haynesville Shale in Louisiana, and several others. An exploration and production company drilling a well in the Permian Basin, for example, might contract Liberty Energy to fracture multiple stages along a horizontal wellbore, creating the pathways needed to bring oil to the surface economically.
Beyond core fracturing services, Liberty Energy offers complementary capabilities that support well completion operations. Its wireline services use specialized trucks to lower perforating guns into wells, creating the initial openings in the wellbore casing that connect to the formation. The company operates two sand mines in the Permian Basin, supplying the proppant (typically sand) that holds fractures open after pressure is released. It also provides proppant delivery and handling equipment, field gas processing, compressed natural gas delivery for powering equipment, and data analytics services.
Liberty Energy has developed technologies aimed at reducing emissions from completion operations, including electric and hybrid fracturing pumps called digiFleets and dual-fuel fleets that can run on natural gas instead of solely diesel. Through its Liberty Power Innovations subsidiary, the company provides compressed natural gas supply, processing, and delivery services that enable these lower-emission technologies. Revenue comes primarily from contracts with exploration and production companies who pay for fracturing services based on stages completed, equipment time, and volumes of materials used.
4. Oilfield Services
Oilfield services companies provide equipment, technology, and services enabling exploration and production activities, including drilling, completion, well intervention, and reservoir evaluation. Their fortunes closely track upstream capital spending cycles. Tailwinds include increased drilling activity during favorable commodity environments, demand for efficiency-enhancing technologies, and growing offshore and unconventional resource development. Headwinds include significant revenue volatility tied to oil and gas price swings and producer spending discipline. Intense competition pressures pricing and margins, while the energy transition may structurally reduce long-term demand. Workforce availability and technological disruption require continuous adaptation.
Liberty Energy's competitors include large integrated oilfield services companies like Halliburton (NYSE:HAL) and Patterson-UTI Energy (NASDAQ:PTEN), as well as focused hydraulic fracturing providers such as ProFrac (NASDAQ:ACDC) and ProPetro Services (NYSE:PUMP).
5. Economies of Scale
The scale of a company’s revenue base is an important lens through which to view the topline, as it signals whether a producer has gone from a vulnerable commodity taker into a durable operating platform. Larger producers generate revenue across many wells, pads, takeaway routes, and geographies rather than relying on a single field or drilling program. Liberty Energy’s $4.01 billion of revenue in the last year is mid-sized for the industry.
6. Revenue Growth
Cyclical sectors like Energy often flatter weaker operators during favorable price environments, but a longer-term lens separates those from businesses that can consistently perform across market cycles. Luckily, Liberty Energy’s sales grew at an incredible 32.9% compounded annual growth rate over the last five years. Its growth beat the average energy upstream and integrated energy company and shows its offerings resonate with customers, a helpful starting point for our analysis.
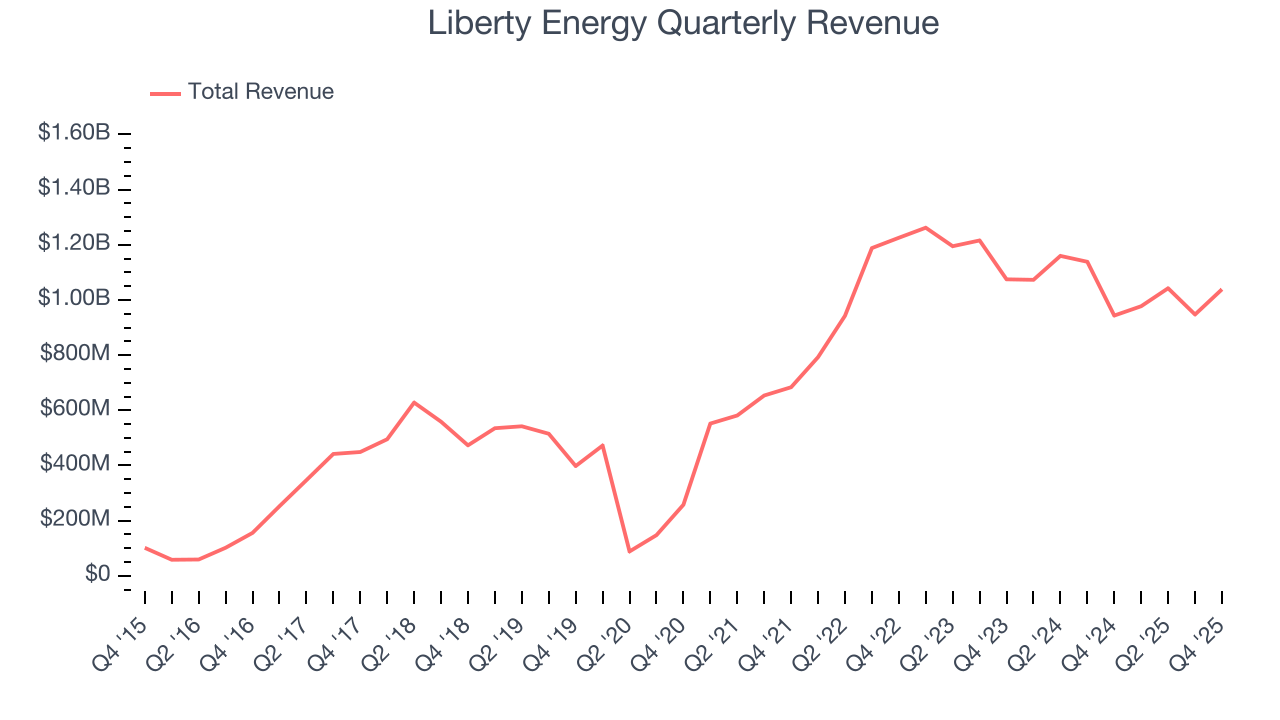
Within Energy, a singular timeframe, even if it’s quite long-term, only sheds light on how well a company rode the last commodity cycle. To better assess whether a company compounds through cycles, we validate our view with an even longer, ten-year view. Liberty Energy’s annualized revenue growth of 30.1% over the last nine years is below its five-year trend, but we still think the results suggest decent demand.
This quarter, Liberty Energy reported year-on-year revenue growth of 10.1%, and its $1.04 billion of revenue exceeded Wall Street’s estimates by 16.3%.
7. Gross Margin
In a single quarter or year, gross margins in the sector can swing wildly due to commodity prices, hedging, or changes in labor costs. Over a multi-year period across different points in the cycle, gross margin differences can signal whether a company is a structurally-advantaged producer (“rock” quality, takeaway, operating costs) or not.
Liberty Energy, which averaged 23.2% gross margin over the last five years, exhibiting bottom-tier unit economics in the sector. It means the company will struggle at higher commodity prices than peers with better gross margins. 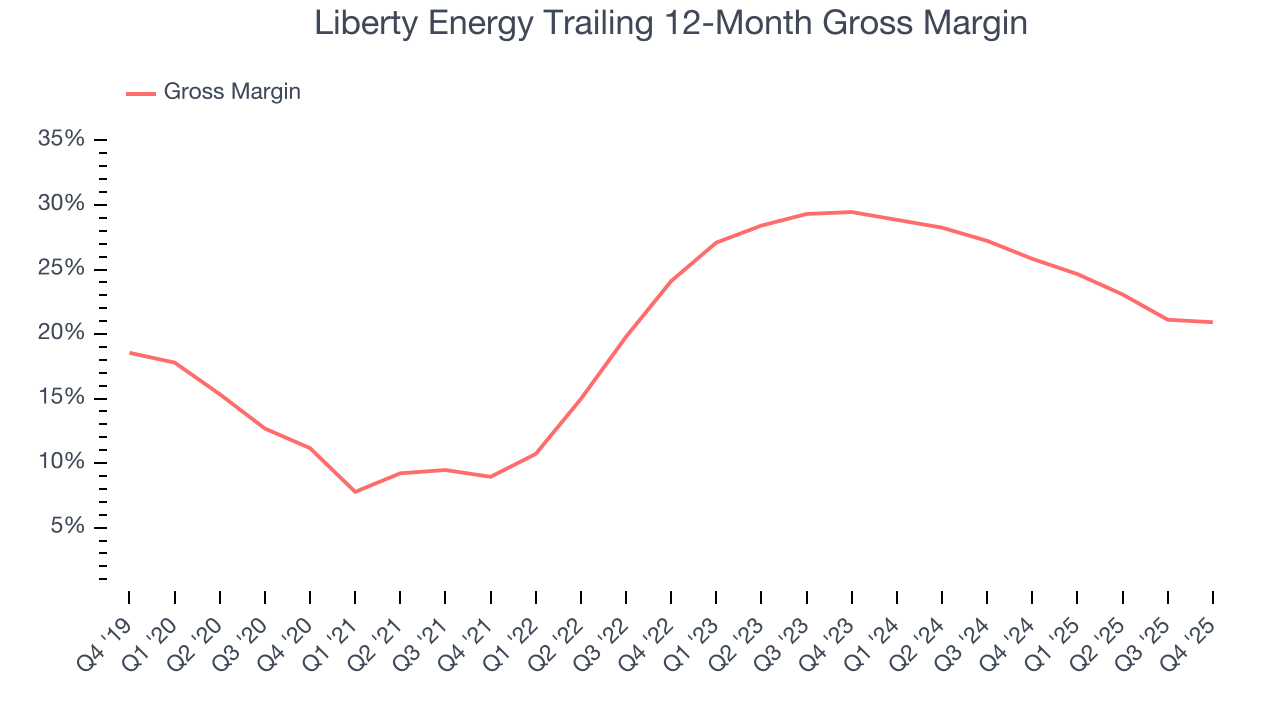
In Q4, Liberty Energy produced a 20.6% gross profit margin, in line with the same quarter last year.
8. Adjusted EBITDA Margin
Liberty Energy was profitable over the last five years but held back by its large cost base. Its average EBITDA margin of 19% was weak for an upstream and integrated energy business.
On the plus side, Liberty Energy’s EBITDA margin rose by 10.9 percentage points over the last year, as its sales growth gave it immense operating leverage.
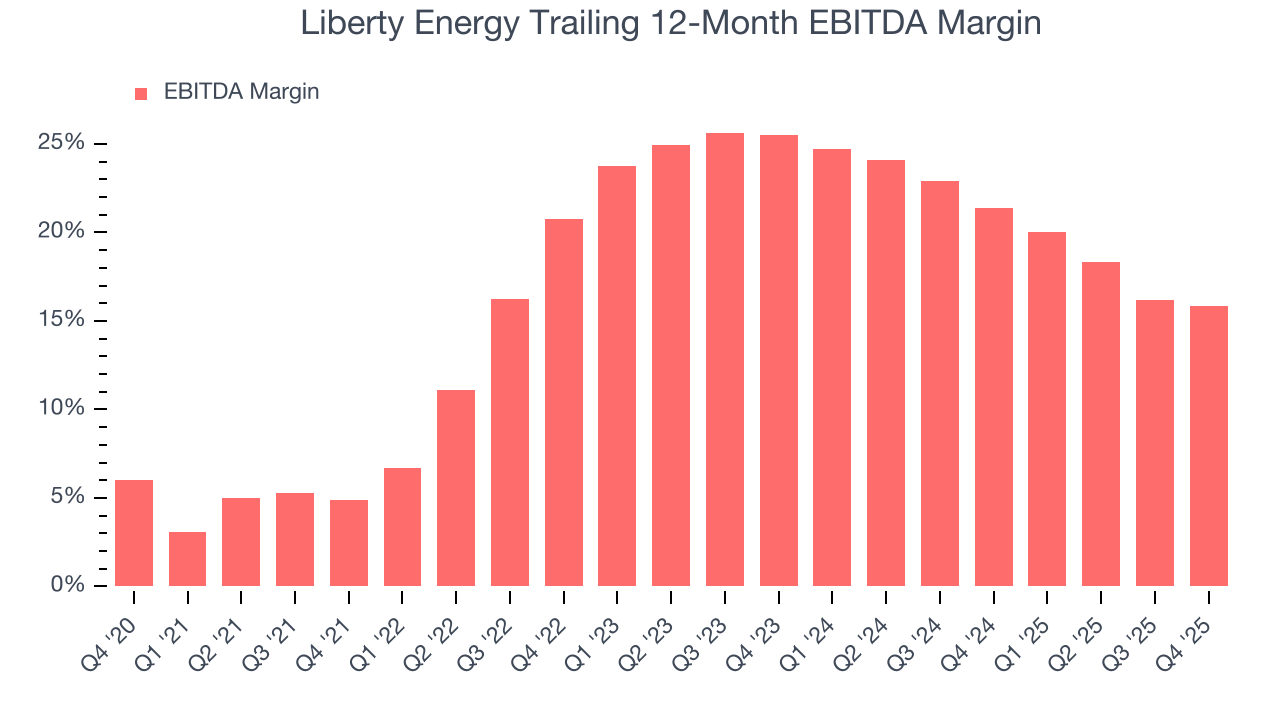
In Q4, Liberty Energy generated an EBITDA margin profit margin of 15.2%, down 1.3 percentage points year on year. This reduction is quite minuscule and indicates the company’s overall cost structure has been relatively stable. This adjusted EBITDA beat Wall Street’s estimates by 48.7%.
9. Cash Is King
Adjusted EBITDA shows how profitable a company’s existing wells are before financing and reinvestment decisions, but free cash flow shows how much value remains after paying the cost of replacing those wells. In upstream energy, production naturally declines over time, so companies must continuously reinvest just to stand still. A producer can report strong EBITDA margins yet generate little or no free cash flow if its wells decline quickly or if new drilling is expensive. Free cash flow therefore captures not only how efficiently a company produces hydrocarbons today, but also how costly it is to sustain that production into the future.
Liberty Energy has shown weak cash profitability relative to peers over the last five years, giving the company fewer opportunities to return capital to shareholders. Its free cash flow margin averaged 3.2%, below what we’d expect for an upstream and integrated energy business.
While the level of free cash flow margins is important, their consistency matters just as much.
Liberty Energy’s ratio of quarterly free cash flow volatility to WTI crude price volatility over the past five years was 12.7 (lower is better), indicating that its cash generation is far more sensitive to commodity-price swings than most peers. This elevated volatility limits its access to capital in downturns and makes it unlikely to act as a consolidator when weaker competitors come under pressure.
You may be asking why we wait until the free cash flow line to perform this stability analysis versus commodity prices. Why not compare revenue or EBITDA to WTI Crude prices in the case of Liberty Energy? Because what ultimately matters is not how much revenue or profit you earn when prices are high but how much cash you can generate when prices are low. Free cash flow is the superior metric because it includes everything from hedging prowess to growth and maintenance capex to management behavior during good times and bad.
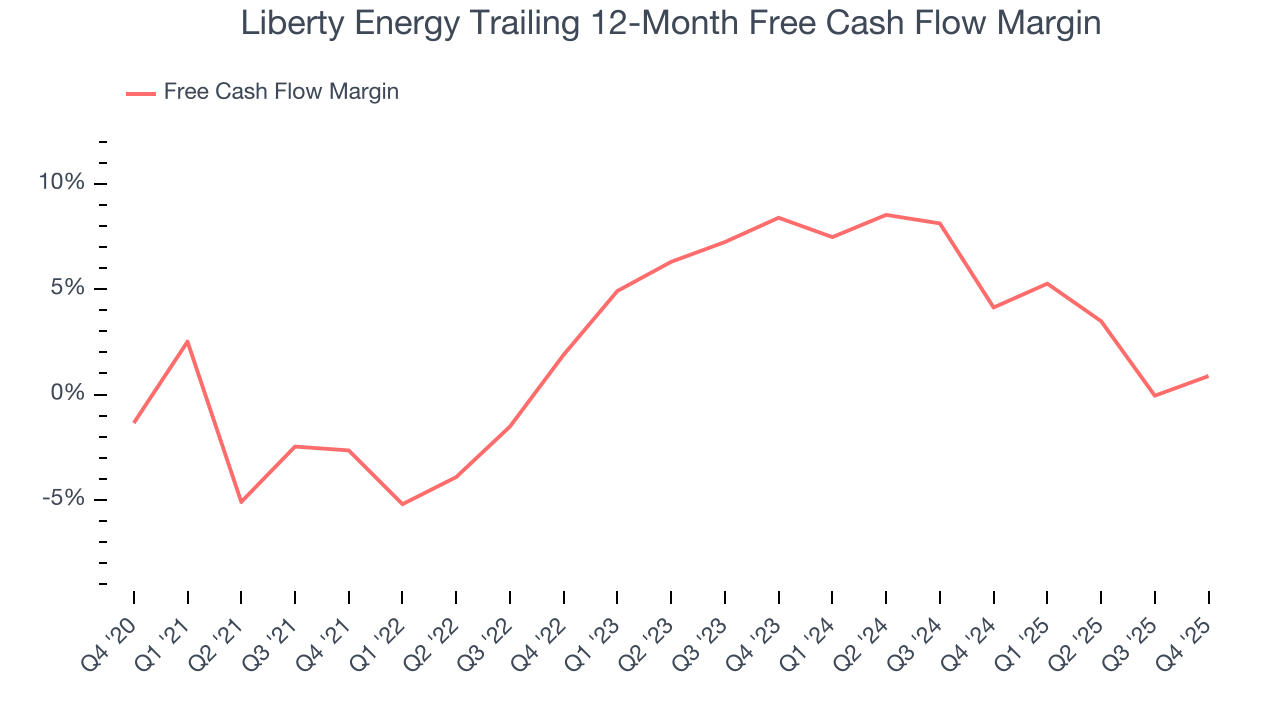
Liberty Energy’s free cash flow clocked in at $11.13 million in Q4, equivalent to a 1.1% margin. Its cash flow turned positive after being negative in the same quarter last year, building on its favorable historical trend.
10. Return on Invested Capital (ROIC)
Free cash flow shows how much money a producer generated, while ROIC shows how efficiently that money was earned. ROIC measures the operating profit produced for each dollar of capital invested, whether from debt or equity. Cash generation measures quantity while ROIC measures the quality of value creation.
We at StockStory like to look at ROIC over a ten-year period because energy investment cycles can involve up to five years of ramping production and another five years of harvesting. A decade view captures buying, extracting, and monetizing rather than just part of that picture. Liberty Energy’s eight-year average ROIC was 15.2%, beating other energy upstream and integrated energy companies by a wide margin. This illustrates its management team’s ability to invest in attractive growth opportunities and produce tangible results for shareholders.
11. Balance Sheet Assessment
Liberty Energy reported $27.55 million of cash and $613.2 million of debt on its balance sheet in the most recent quarter. As investors in high-quality companies, we primarily focus on two things: 1) that a company’s debt level isn’t too high and 2) that its interest payments are not excessively burdening the business.
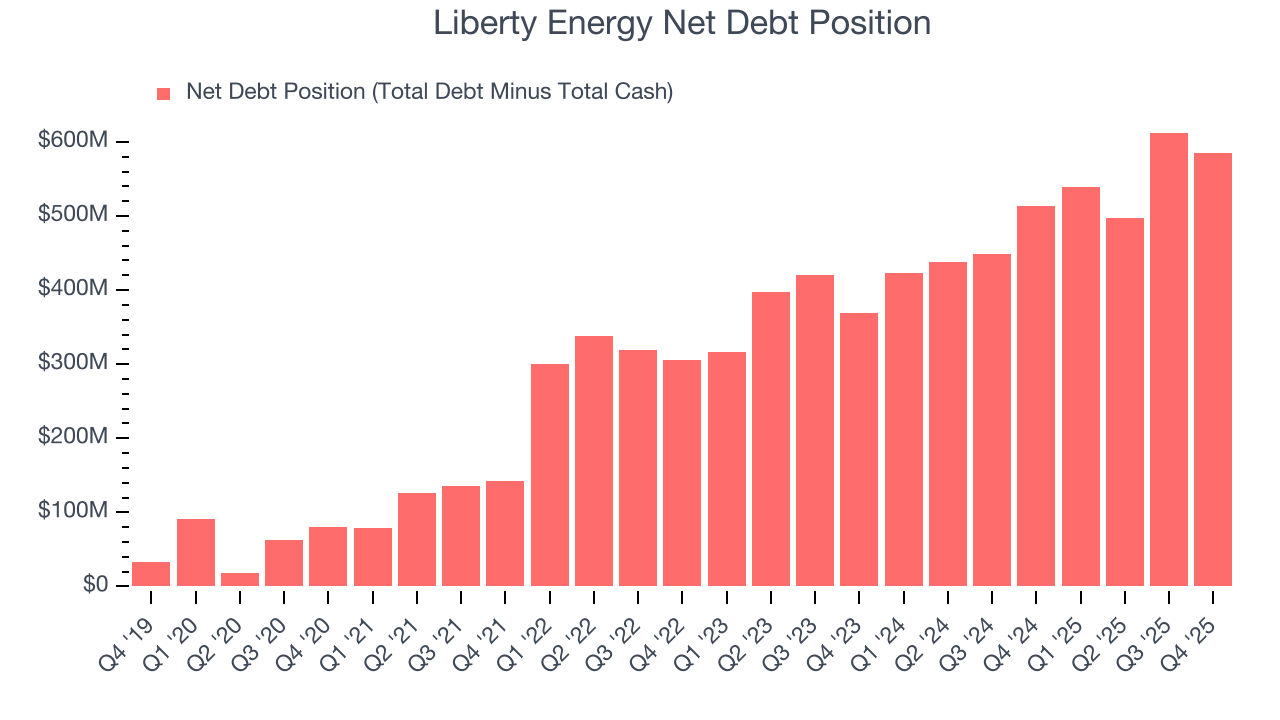
With $634.1 million of EBITDA over the last 12 months, we view Liberty Energy’s 0.9× net-debt-to-EBITDA ratio as safe. We also see its $40.31 million of annual interest expenses as appropriate. The company’s profits give it plenty of breathing room, allowing it to continue investing in growth initiatives.
12. Key Takeaways from Liberty Energy’s Q4 Results
It was good to see Liberty Energy beat analysts’ EPS expectations this quarter. We were also excited its EBITDA outperformed Wall Street’s estimates by a wide margin. Zooming out, we think this quarter featured some important positives. The stock traded up 2.7% to $29.08 immediately following the results.
13. Is Now The Time To Buy Liberty Energy?
Updated: March 17, 2026 at 1:07 AM EDT
Before making an investment decision, investors should account for Liberty Energy’s business fundamentals and valuation in addition to what happened in the latest quarter.
There are a lot of things to like about Liberty Energy. To kick things off, its revenue growth over the last five years was top-tier for the sector. And while its gross margins show its business model is much less lucrative than other companies, its revenue growth over the last nine years was top-tier for the sector. On top of that, its expanding EBITDA margin shows the business has become more efficient.
Liberty Energy’s EV-to-EBITDA ratio based on the next 12 months is 11.4x. Looking at the energy upstream and integrated energy space right now, Liberty Energy trades at a compelling valuation. For those confident in the business and its management team, this is a good time to invest.
Wall Street analysts have a consensus one-year price target of $28.38 on the company (compared to the current share price of $30.23).