
Transocean (RIG)
Transocean is up against the odds. Not only has its sales growth been weak but also its negative returns on capital show it destroyed value.― StockStory Analyst Team
1. News


2. Summary
Why We Think Transocean Will Underperform
Operating one of the world's most capable fleets of ultra-deepwater drillships and harsh environment rigs, Transocean (NYSE:RIG) operates drilling rigs that energy companies rent to drill oil and gas wells in deep ocean waters.
- Customers postponed purchases of its products and services this cycle as its revenue declined by 6% annually over the last ten years
- poor earning stability in the sector may keep investors up at night
- Push for growth has led to negative returns on capital, signaling value destruction, and its falling returns suggest its earlier profit pools are drying up


Transocean’s quality is inadequate. There are more appealing investments to be made.
Why There Are Better Opportunities Than Transocean


Transocean is trading at $6.68 per share, or 32.4x forward P/E. Not only does Transocean trade at a premium to companies in the energy upstream and integrated energy space, but this multiple is also high for its top-line growth.
There are stocks out there similarly priced with better business quality. We prefer owning these.
3. Transocean (RIG) Research Report: Q4 CY2025 Update
Offshore drilling contractor Transocean (NYSE:RIG) reported Q4 CY2025 results topping the market’s revenue expectations, with sales up 9.6% year on year to $1.04 billion. Its non-GAAP profit of $0.02 per share was 72.9% below analysts’ consensus estimates.
Transocean (RIG) Q4 CY2025 Highlights:
- Revenue: $1.04 billion vs analyst estimates of $1.03 billion (9.6% year-on-year growth, 0.9% beat)
- Adjusted EPS: $0.02 vs analyst expectations of $0.07 (72.9% miss)
- Adjusted EBITDA: $385 million vs analyst estimates of $391.6 million (36.9% margin, 1.7% miss)
- Operating Margin: 23%, up from 13.7% in the same quarter last year
- Free Cash Flow Margin: 30.8%, up from 18.6% in the same quarter last year
- Market Capitalization: $7.12 billion
Company Overview
Operating one of the world's most capable fleets of ultra-deepwater drillships and harsh environment rigs, Transocean (NYSE:RIG) operates drilling rigs that energy companies rent to drill oil and gas wells in deep ocean waters.
Transocean owns and operates a fleet of 34 mobile offshore drilling units, consisting primarily of ultra-deepwater floaters—drilling rigs designed to operate in water depths of 4,500 feet or greater, reaching up to 12,000 feet. These rigs come in two main types: drillships, which are ship-shaped vessels that offer large storage capacity and mobility in calmer seas, and semisubmersibles, which can be partially submerged for stability in rough conditions. The company specializes in technically demanding environments, including harsh areas like the Norwegian continental shelf where weather and sea conditions require specially reinforced equipment.
Energy companies such as Shell, Petrobras, and Equinor contract these rigs when they need to drill exploratory wells to find new oil and gas reserves or development wells to extract resources from known fields. For example, an oil major exploring offshore Brazil might hire one of Transocean's ultra-deepwater drillships on a multi-year contract, paying a daily rate that covers the rig, equipment, and crew needed to drill wells thousands of feet below the ocean surface. The company generates revenue primarily through these day-rate contracts, which are negotiated individually based on rig specifications, market conditions, and the technical complexity of the drilling location.
Transocean's fleet includes 23 drillships equipped with proprietary dual-activity technology, which allows two drilling tasks to be performed simultaneously using separate drilling stations within a dual derrick structure, reducing the time required to complete wells. The company operates globally, with rigs currently working in locations including the U.S. Gulf of Mexico, Brazil, Norway, Malaysia, Australia, and Angola.
4. Oilfield Services
Oilfield services companies provide equipment, technology, and services enabling exploration and production activities, including drilling, completion, well intervention, and reservoir evaluation. Their fortunes closely track upstream capital spending cycles. Tailwinds include increased drilling activity during favorable commodity environments, demand for efficiency-enhancing technologies, and growing offshore and unconventional resource development. Headwinds include significant revenue volatility tied to oil and gas price swings and producer spending discipline. Intense competition pressures pricing and margins, while the energy transition may structurally reduce long-term demand. Workforce availability and technological disruption require continuous adaptation.
Transocean competes with other offshore drilling contractors including Valaris (NYSE:VAL), Noble Corporation (NYSE:NE), Seadrill (NYSE:SDRL), and Diamond Offshore Drilling (NYSE:DO).
5. Economies of Scale
In Energy, scale separates fragile single-asset producers from platform-style businesses that generate revenue across entire basins and infrastructure networks. Transocean’s $3.97 billion of revenue in the last year is mid-sized for the industry.
6. Revenue Growth
Cyclical industries such as Energy can make mediocre companies look great for a time, but a long-term view reveals which businesses can actually withstand and adapt to changing conditions. Unfortunately, Transocean’s 4.7% annualized revenue growth over the last five years was sluggish. This fell short of our benchmark for the energy upstream and integrated energy sector and is a tough starting point for our analysis.
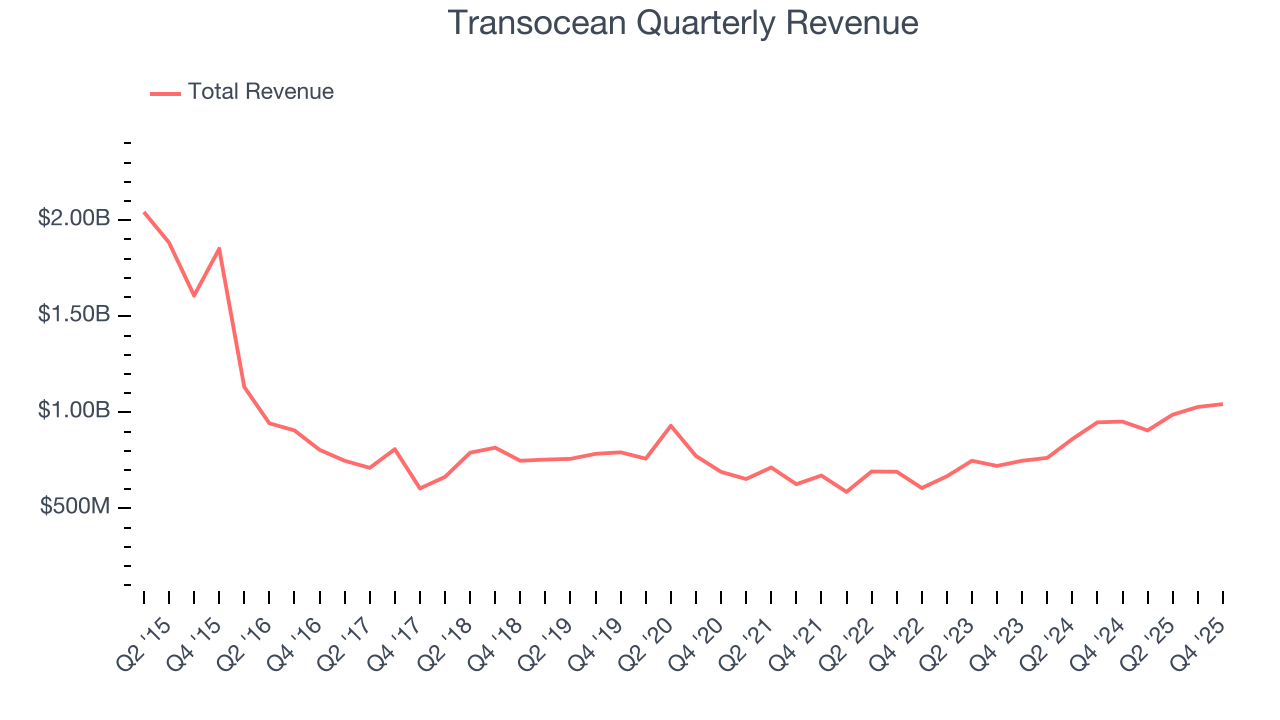
Even a long stretch in Energy can be shaped by a single commodity cycle, so extending the view to ten years adds another perspective and reveals which companies are built to grow regardless of the pricing regime. Transocean’s performance shows it grew in the past five-year but relinquished its gains over the last ten years, as its revenue fell by 6% annually.
This quarter, Transocean reported year-on-year revenue growth of 9.6%, and its $1.04 billion of revenue exceeded Wall Street’s estimates by 0.9%.
7. Gross Margin
While energy gross margins can be distorted by commodity prices, hedging, and short-term cost swings, sustained margins across a full cycle reflect a producer’s underlying asset quality, infrastructure position, and cost structure.
Transocean, which averaged 36.6% gross margin over the last five years, exhibits poor unit economics in the sector. It means the company will struggle more at lower commodity prices than peers with better gross margins. 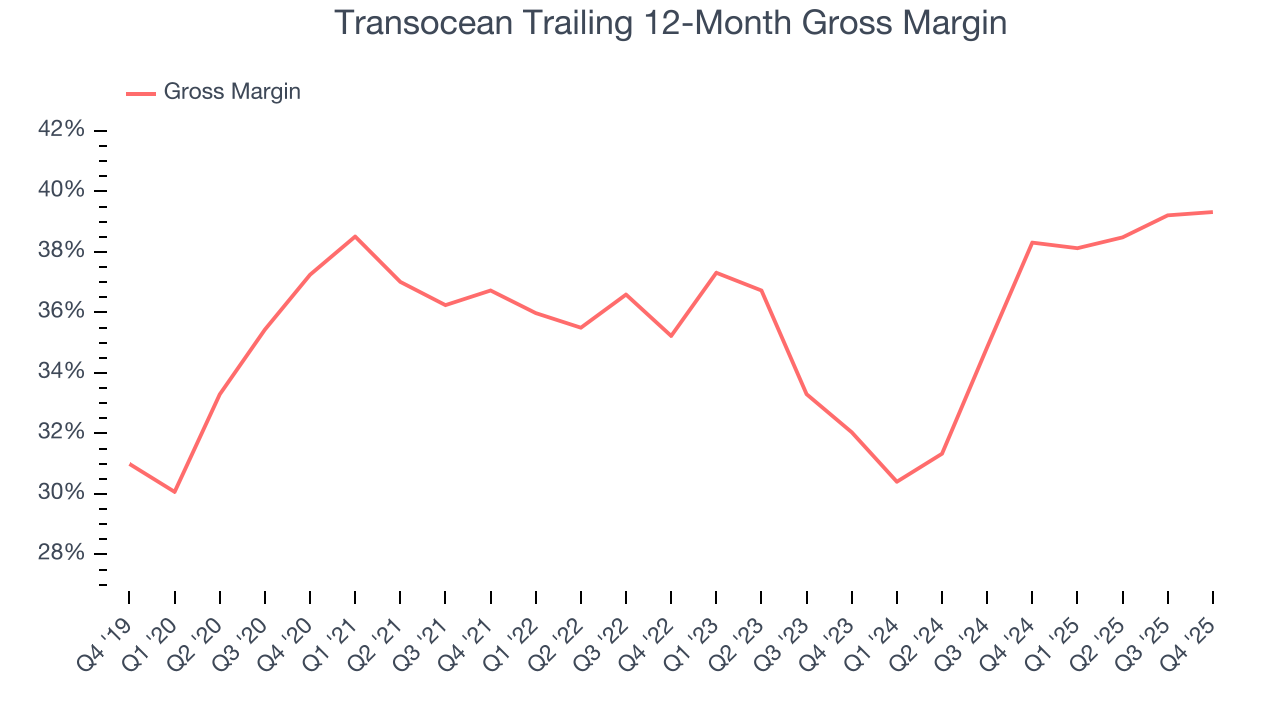
This quarter, Transocean’s gross profit margin was 42%, in line with the same quarter last year.
8. Adjusted EBITDA Margin
Adjusted EBITDA margin is an important measure of profitability for the sector and accounts for the gross margins and operating costs mentioned previously. Unlike operating margin, it is not distorted by accounting conventions around reserves, drilling costs, and assumptions on commodity consumption from the well or basin. Adjusted EBITDA highlights the economic reality of how much cash the rock produces before the capital structure (debt service) and the drilling budget (capex) are considered.
Transocean was profitable over the last five years but held back by its large cost base. Its average EBITDA margin of 32.4% was weak for an upstream and integrated energy business.
Looking at the trend in its profitability, Transocean’s EBITDA margin decreased by 2.8 percentage points over the last year. Transocean’s performance was poor no matter how you look at it - it shows that costs were rising and it couldn’t pass them onto its customers.
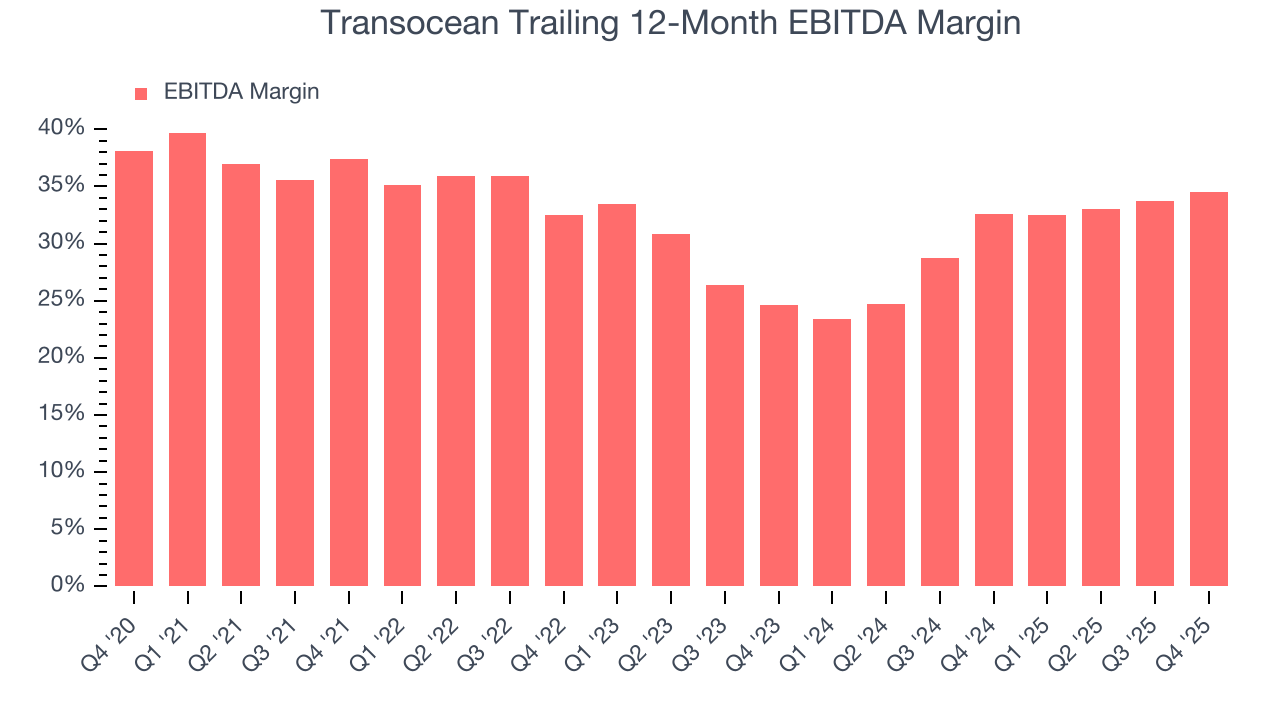
This quarter, Transocean generated an EBITDA margin profit margin of 36.9%, up 3 percentage points year on year. This increase was a welcome development and shows it was more efficient. This adjusted EBITDA fell short of Wall Street’s estimates.
9. Cash Is King
Adjusted EBITDA shows how profitable a company’s existing wells are before financing and reinvestment decisions, but free cash flow shows how much value remains after paying the cost of replacing those wells. In upstream energy, production naturally declines over time, so companies must continuously reinvest just to stand still. A producer can report strong EBITDA margins yet generate little or no free cash flow if its wells decline quickly or if new drilling is expensive. Free cash flow therefore captures not only how efficiently a company produces hydrocarbons today, but also how costly it is to sustain that production into the future.
Transocean has shown weak cash profitability relative to peers over the last five years, giving the company fewer opportunities to return capital to shareholders. Its free cash flow margin averaged 4.2%, below what we’d expect for an upstream and integrated energy business.
The level of free cash flow is important, but its durability across cycles is just as critical. Consistent margins are far more valuable than volatile swings driven by commodity prices.
Transocean’s ratio of quarterly free cash flow volatility to WTI crude price volatility over the past five years was 27.8 (lower is better), indicating that its cash generation is far more sensitive to commodity-price swings than most peers. This elevated volatility limits its access to capital in downturns and makes it unlikely to act as a consolidator when weaker competitors come under pressure.
You may be asking why we wait until the free cash flow line to perform this stability analysis versus commodity prices. Why not compare revenue or EBITDA to WTI Crude prices in the case of Transocean? Because what ultimately matters is not how much revenue or profit you earn when prices are high but how much cash you can generate when prices are low. Free cash flow is the superior metric because it includes everything from hedging prowess to growth and maintenance capex to management behavior during good times and bad.
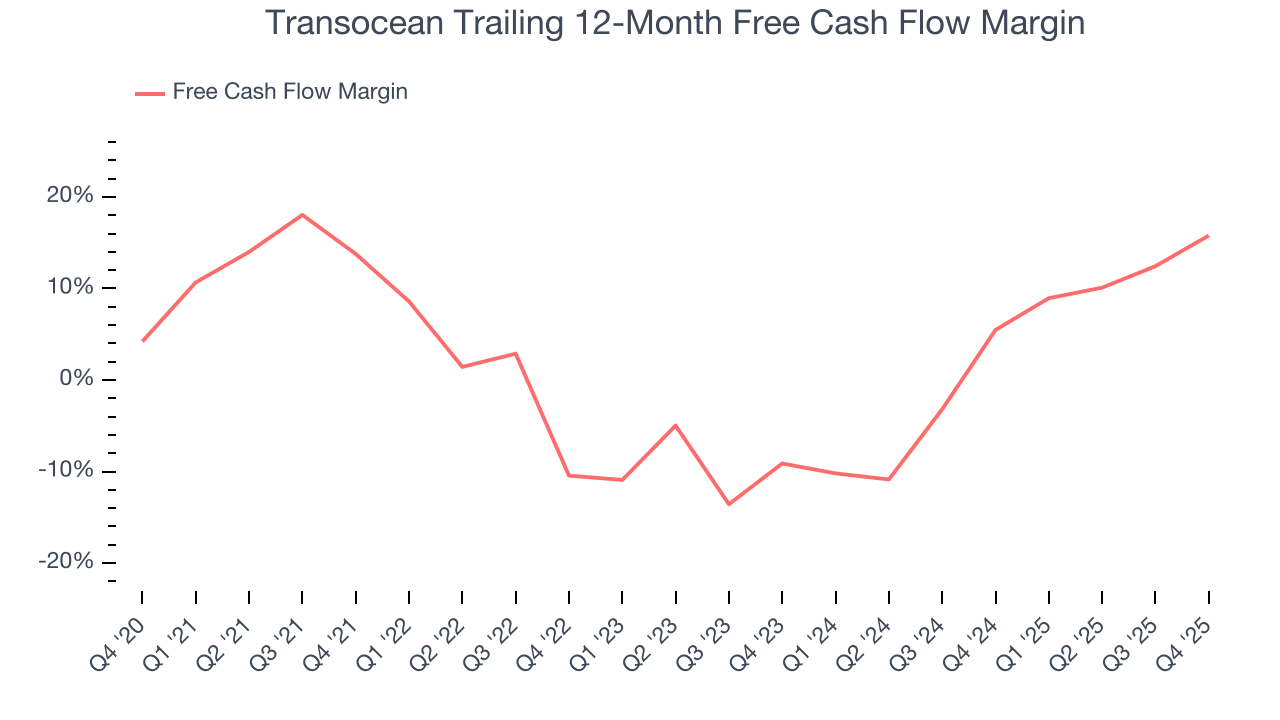
Transocean’s free cash flow clocked in at $321 million in Q4, equivalent to a 30.8% margin. This result was good as its margin was 12.2 percentage points higher than in the same quarter last year, building on its favorable historical trend.
10. Return on Invested Capital (ROIC)
Free cash flow shows how much money a producer generated, while ROIC shows how efficiently that money was earned. ROIC measures the operating profit produced for each dollar of capital invested, whether from debt or equity. Cash generation measures quantity while ROIC measures the quality of value creation.
We at StockStory like to look at ROIC over a ten-year period because energy investment cycles can involve up to five years of ramping production and another five years of harvesting. A decade view captures buying, extracting, and monetizing rather than just part of that picture. Transocean’s ten-year average ROIC was negative 4.9%, meaning management lost money while trying to expand the business. Its returns were among the worst in the energy upstream and integrated energy sector.
We like to invest in businesses with high returns, but the trend in a company’s ROIC is what often surprises the market and moves the stock price. Over the last few years, Transocean’s ROIC has unfortunately decreased. Paired with its already low returns, these declines suggest its profitable growth opportunities are few and far between.
11. Balance Sheet Assessment
Transocean reported $620 million of cash and $5.66 billion of debt on its balance sheet in the most recent quarter. As investors in high-quality companies, we primarily focus on two things: 1) that a company’s debt level isn’t too high and 2) that its interest payments are not excessively burdening the business.
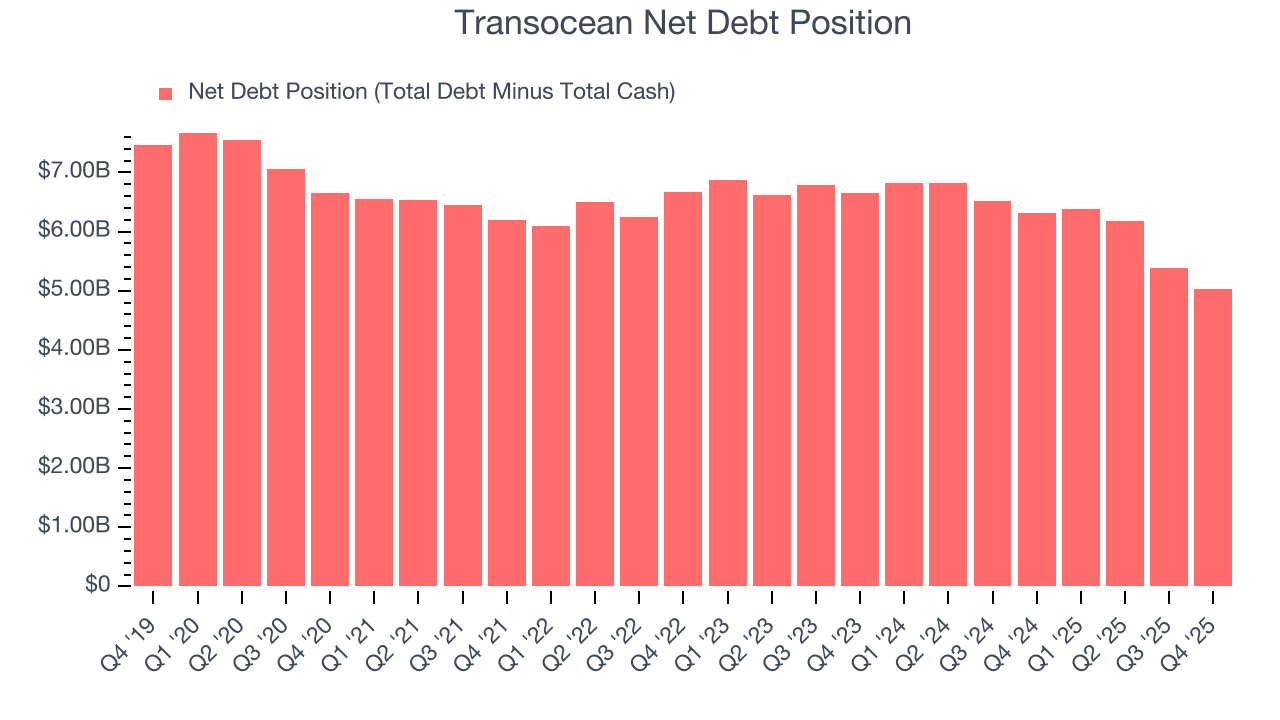
With $1.37 billion of EBITDA over the last 12 months, we view Transocean’s 3.7× net-debt-to-EBITDA ratio as safe. We also see its $515 million of annual interest expenses as appropriate. The company’s profits give it plenty of breathing room, allowing it to continue investing in growth initiatives.
12. Key Takeaways from Transocean’s Q4 Results
It was good to see Transocean narrowly top analysts’ revenue expectations this quarter. On the other hand, its EPS missed and its EBITDA fell short of Wall Street’s estimates. Overall, this was a weaker quarter. The stock traded up 3.7% to $6.70 immediately after reporting.
13. Is Now The Time To Buy Transocean?
Updated: March 25, 2026 at 1:10 AM EDT
Before investing in or passing on Transocean, we urge you to understand the company’s business quality (or lack thereof), valuation, and the latest quarterly results - in that order.
We cheer for all companies serving everyday consumers, but in the case of Transocean, we’ll be cheering from the sidelines. To begin with, its revenue growth over the last five years was bottom-tier for the sector, and analysts expect its demand to deteriorate over the next 12 months. While its scale enables operational efficiencies, capital market access, and investment in advanced technologies, the downside is its relatively low ROIC suggests management has struggled to find compelling investment opportunities. On top of that, its free cash flow volatility compared to commodity price volatility is bottom-tier in the sector, leading to highly volatile free cash flow.
Transocean’s P/E ratio based on the next 12 months is 32.4x. At this valuation, there’s a lot of good news priced in - we think there are better opportunities elsewhere.
Wall Street analysts have a consensus one-year price target of $5.64 on the company (compared to the current share price of $6.68), implying they don’t see much short-term potential in Transocean.