
Baker Hughes (BKR)
Baker Hughes doesn’t excite us. Its weak sales growth and low returns on capital show it struggled to generate demand and profits.― StockStory Analyst Team
1. News
2. Summary
Why Baker Hughes Is Not Exciting
Tracing lineage to a 1907 cable tool drill bit patent, Baker Hughes (NASDAQ:BKR) provides equipment and services for oil and gas drilling, production, and transport.
- Costly operations and weak unit economics result in an inferior gross margin of 21.9% that must be offset through higher production volumes
- Responsiveness to unforeseen market trends is restricted due to its substandard EBITDA margin profitability
- A bright spot is that its enormous revenue base of $27.73 billion provides significant leverage in supplier negotiations


Baker Hughes’s quality is not up to our standards. We’d search for superior opportunities elsewhere.
Why There Are Better Opportunities Than Baker Hughes


Baker Hughes’s stock price of $57.80 implies a valuation ratio of 22.1x forward P/E. This multiple expensive for its subpar fundamentals.
Paying up for elite businesses with strong earnings potential is better than investing in lower-quality companies with shaky fundamentals. That’s how you avoid big downside over the long term.
3. Baker Hughes (BKR) Research Report: Q4 CY2025 Update
Energy technology company Baker Hughes (NASDAQ:BKR) announced better-than-expected revenue in Q4 CY2025, but sales were flat year on year at $7.39 billion. Its non-GAAP profit of $0.78 per share was 16.7% above analysts’ consensus estimates.
Baker Hughes (BKR) Q4 CY2025 Highlights:
- Revenue: $7.39 billion vs analyst estimates of $7.09 billion (flat year on year, 4.2% beat)
- Adjusted EPS: $0.78 vs analyst estimates of $0.67 (16.7% beat)
- Adjusted EBITDA: $1.34 billion vs analyst estimates of $1.26 billion (18.1% margin, 6% beat)
- Operating Margin: 10.2%, up from 9% in the same quarter last year
- Free Cash Flow Margin: 18.2%, up from 12.2% in the same quarter last year
- Market Capitalization: $59.11 billion
Company Overview
Tracing lineage to a 1907 cable tool drill bit patent, Baker Hughes (NASDAQ:BKR) provides equipment and services for oil and gas drilling, production, and transport.
The company operates across two main segments that serve different parts of the energy value chain. Its Oilfield Services & Equipment segment supports oil and gas operators throughout a well's lifecycle, from initial exploration to eventual decommissioning. This includes directional drilling services that guide drill bits to precise underground locations, drill bits designed for different rock formations, drilling fluids that cool equipment and carry rock cuttings to the surface, and cementing services that secure steel casings in the wellbore. The segment also provides artificial lift systems like electrical submersible pumps that bring oil to the surface when reservoir pressure declines, and subsea equipment such as wellhead systems and control manifolds that manage production on the ocean floor.
Its Industrial & Energy Technology segment focuses on equipment for processing and transporting hydrocarbons. This includes gas turbines and compressors that power liquefied natural gas facilities and move gas through pipelines, industrial valves that control flow in refineries and chemical plants, and sensors that detect pressure, vibration, and flow conditions in critical industrial equipment. For example, a pipeline operator might use Baker Hughes' inline inspection tools to check for corrosion or cracks without stopping gas flow, while a power plant could rely on its turbine maintenance services to maximize uptime.
The company also provides technologies for carbon capture and storage, geothermal energy, and hydrogen production as industrial customers work to reduce emissions. Revenue comes from equipment sales, long-term service contracts for maintaining turbines and compressors, and project-based work for constructing facilities. Customers include oil and gas producers, pipeline operators, liquefied natural gas plant developers, refineries, and industrial manufacturers across sectors like aerospace, automotive, and food processing.
4. Oilfield Services
Oilfield services companies provide equipment, technology, and services enabling exploration and production activities, including drilling, completion, well intervention, and reservoir evaluation. Their fortunes closely track upstream capital spending cycles. Tailwinds include increased drilling activity during favorable commodity environments, demand for efficiency-enhancing technologies, and growing offshore and unconventional resource development. Headwinds include significant revenue volatility tied to oil and gas price swings and producer spending discipline. Intense competition pressures pricing and margins, while the energy transition may structurally reduce long-term demand. Workforce availability and technological disruption require continuous adaptation.
Baker Hughes competes with Schlumberger (NYSE:SLB) and Halliburton (NYSE:HAL) in oilfield services, NOV (NYSE:NOV) and Weatherford (NASDAQ:WFRD) in drilling equipment, and TechnipFMC (NYSE:FTI) in subsea systems. In industrial equipment, competitors include Siemens Energy (OTC:SMEGF), Flowserve (NYSE:FLS), and Emerson (NYSE:EMR).
5. Economies of Scale
The scale of a company’s revenue base is an important lens through which to view the topline, as it signals whether a producer has gone from a vulnerable commodity taker into a durable operating platform. Larger producers generate revenue across many wells, pads, takeaway routes, and geographies rather than relying on a single field or drilling program. Baker Hughes’s $27.73 billion of revenue in the last year is top-tier for the industry, suggesting the company has hit a level of diversification where investors can sleep easy at night.
6. Revenue Growth
A company’s long-term performance can give signals about its business quality. Even a bad business, especially in a cyclical industry, can shine for a year or so, but a top-tier one should exhibit resilience through cycles. Unfortunately, Baker Hughes’s 6% annualized revenue growth over the last five years was sluggish. This fell short of our benchmark for the energy upstream and integrated energy sector and is a poor baseline for our analysis.
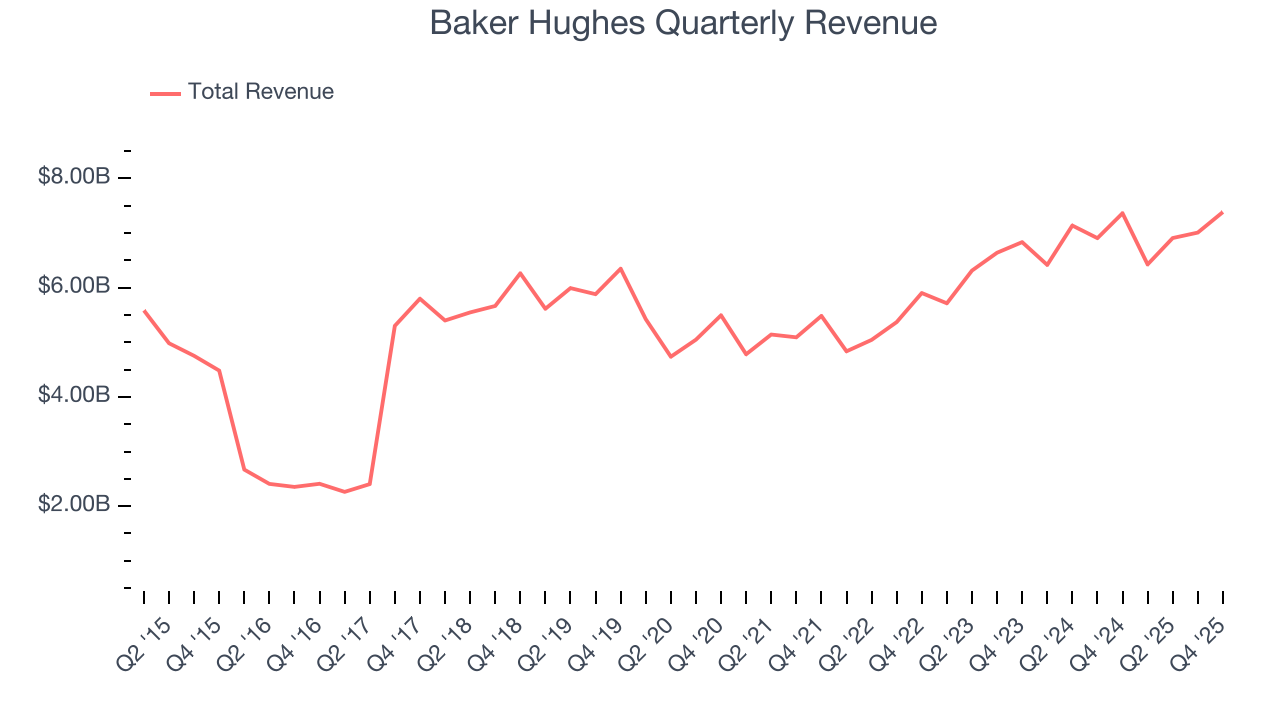
Energy cycles can be long enough that a single five-year period can still reflect one price environment, which is why an additional, decade-long view can help capture through-cycle performance. Baker Hughes’s annualized revenue growth of 3.4% over the last ten years is below its five-year trend, but we still think the results were good.
While looking at revenue is important, it can also introduce noise around commodity prices and M&A. Analyzing production, on the other hand, highlights what is happening inside the asset base and whether the economic footprint of a company is expanding. Over the last two years, Baker Hughes’s production were flat. 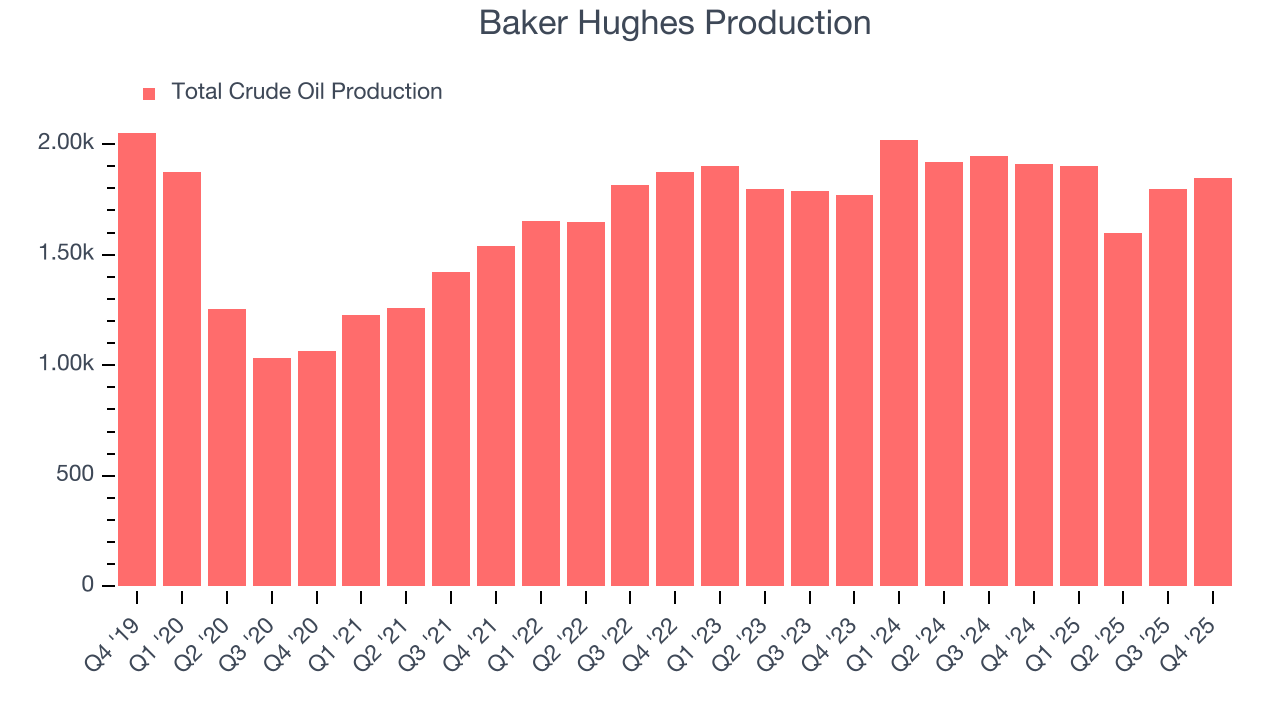
This quarter, Baker Hughes’s $7.39 billion of revenue was flat year on year but beat Wall Street’s estimates by 4.2%. This quarter, Baker Hughes’s production fell by 3.5% year on year to 1.8 Mboe (thousand barrels of oil equivalent) but beat Wall Street’s estimates by 1.9%.
7. Gross Margin
While energy gross margins can be distorted by commodity prices, hedging, and short-term cost swings, sustained margins across a full cycle reflect a producer’s underlying asset quality, infrastructure position, and cost structure.
Baker Hughes, which averaged 21.9% gross margin over the last five years, exhibits bottom-tier unit economics in the sector. It means the company will struggle at higher commodity prices than peers with better gross margins. 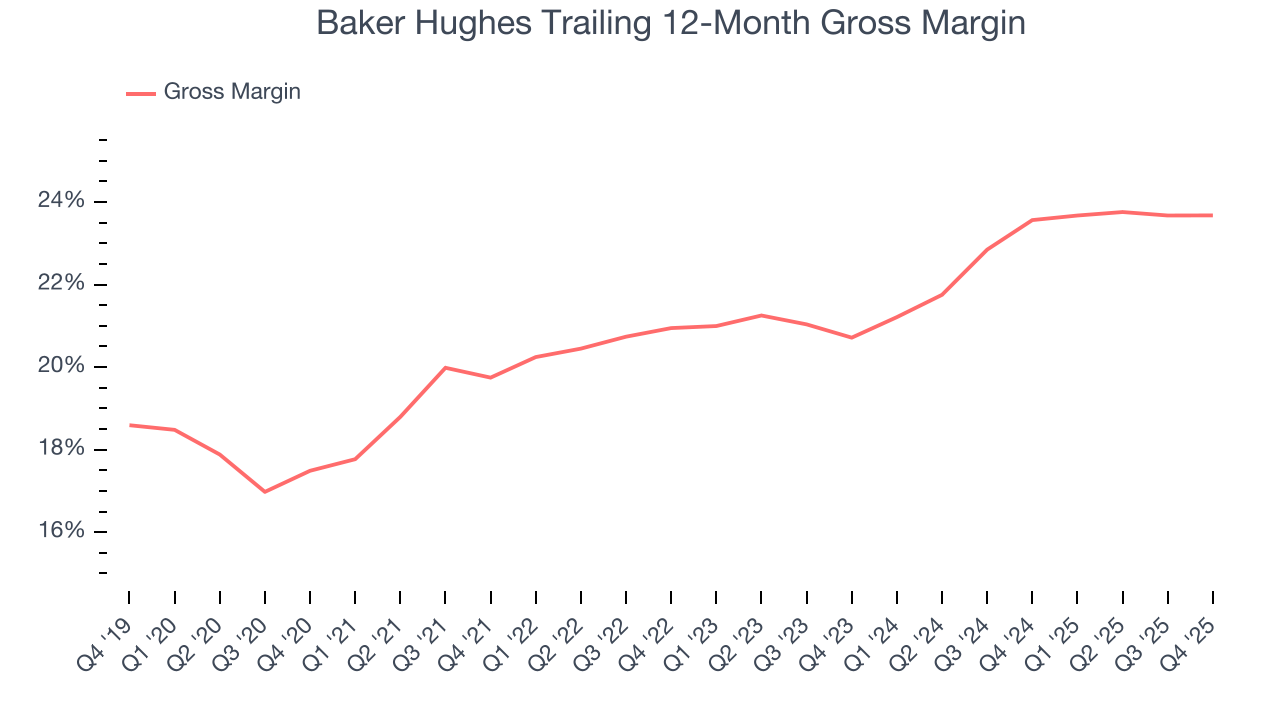
In Q4, Baker Hughes produced a 24% gross profit margin, in line with the same quarter last year.
8. Adjusted EBITDA Margin
Adjusted EBITDA margin strips out accounting distortions tied to depletion and historical drilling spend, providing a clearer view of the cash-generating power of the underlying asset base before financing and reinvestment decisions.
Baker Hughes was profitable over the last five years but held back by its large cost base. Its average EBITDA margin of 15.4% was among the worst in the energy upstream and integrated energy sector.
On the plus side, Baker Hughes’s EBITDA margin rose by 4.3 percentage points over the last year, as its sales growth gave it operating leverage.
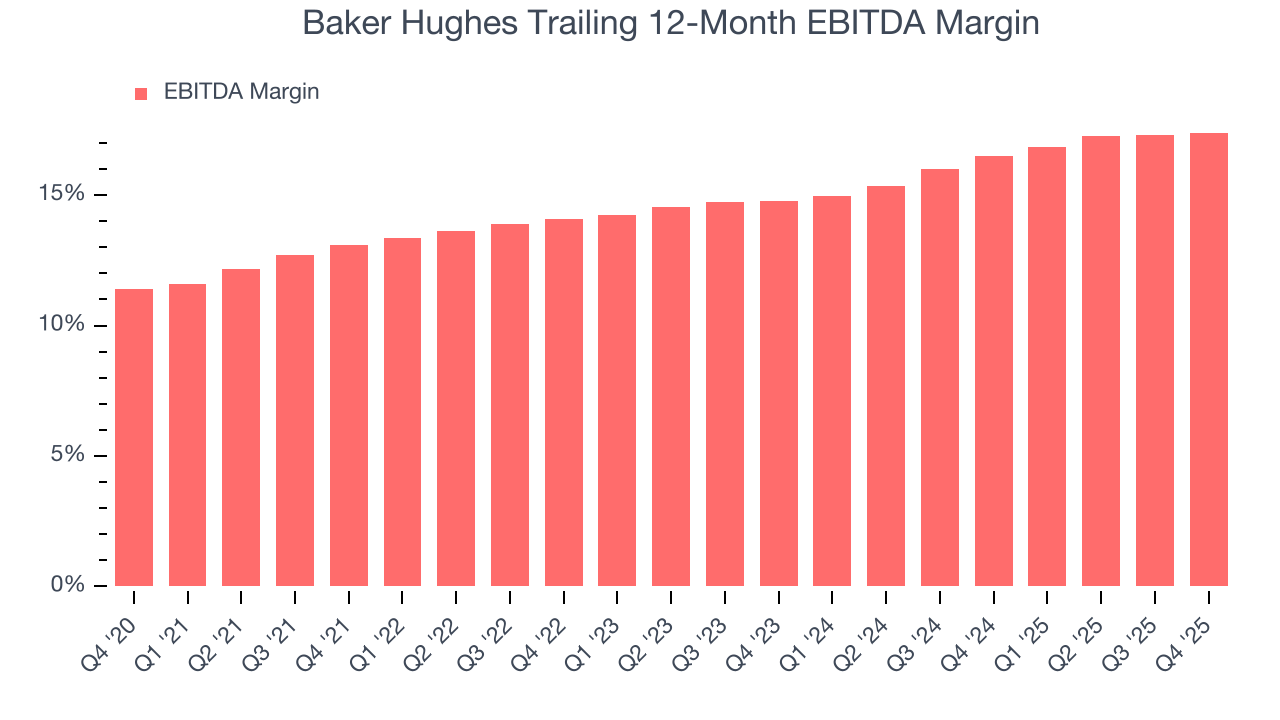
In Q4, Baker Hughes generated an EBITDA margin profit margin of 18.1%, in line with the same quarter last year. This indicates the company’s overall cost structure has been relatively stable. This adjusted EBITDA beat Wall Street’s estimates by 6%.
9. Cash Is King
Adjusted EBITDA shows how profitable a company’s existing “rock” is before financing and reinvestment, while free cash flow shows how much value remains after paying to replace those wells. Because production declines over time, strong EBITDA can coexist with weak FCF if drilling is expensive or declines are steep. FCF therefore captures both operating efficiency and the cost of sustaining production.
Baker Hughes has shown decent cash profitability, giving it some flexibility to reinvest or return capital to investors. The company’s free cash flow margin averaged 8.4% over the last five years, slightly better than the broader energy upstream and integrated energy sector.
While the level of free cash flow margins is important, their consistency matters just as much.
Baker Hughes’s ratio of quarterly free cash flow volatility to WTI crude price volatility over the past five years was 4 (lower is better), indicating excellent insulation from commodity swings. This stability supports superior capital access in downturns and positions Baker Hughes to act as a consolidator when weaker peers are forced to retrench.
You may be asking why we wait until the free cash flow line to perform this stability analysis versus commodity prices. Why not compare revenue or EBITDA to WTI in the case of Baker Hughes? Because what ultimately matters is not how much revenue or profit you earn when prices are high but how much cash you can generate when prices are low. Free cash flow is the superior metric because it includes everything from hedging prowess to growth and maintenance capex to management behavior during good times and bad.
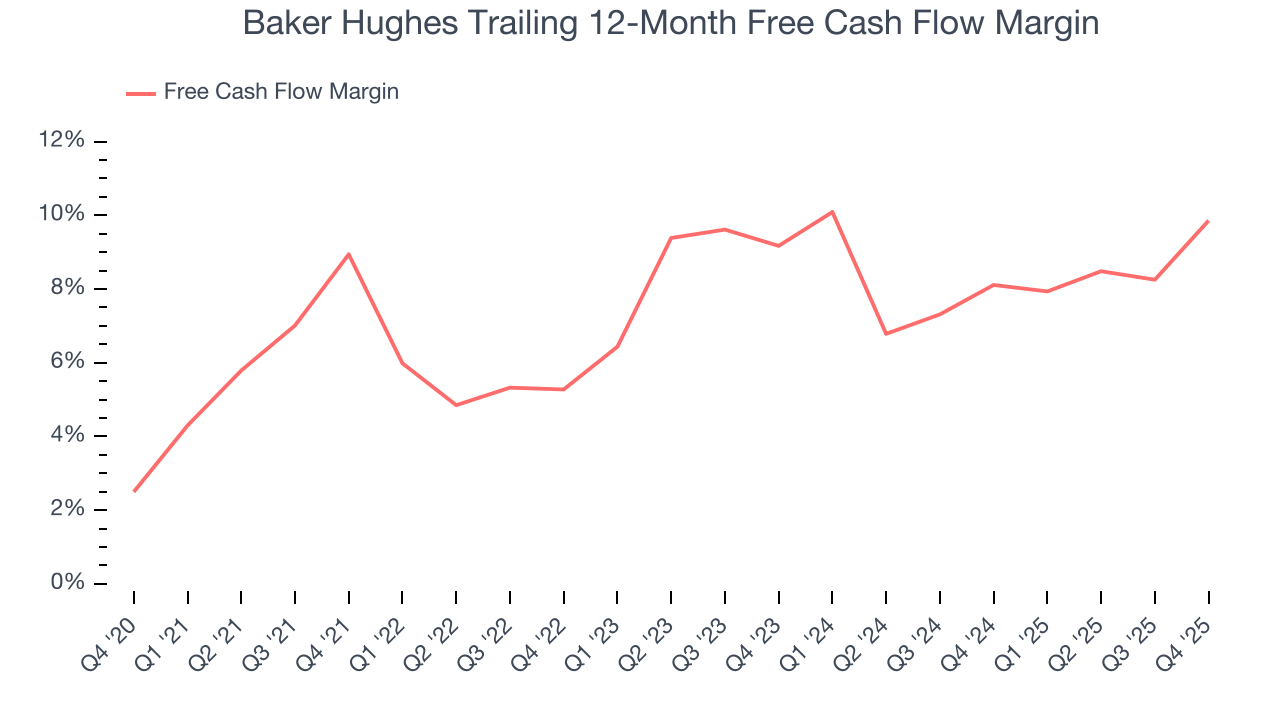
Baker Hughes’s free cash flow clocked in at $1.34 billion in Q4, equivalent to a 18.2% margin. This result was good as its margin was 6 percentage points higher than in the same quarter last year, but we wouldn’t put too much weight on the short term because investment needs can be seasonal, causing temporary swings. Long-term trends trump fluctuations.
10. Return on Invested Capital (ROIC)
Free cash flow shows how much money a producer generated, while ROIC shows how efficiently that money was earned. ROIC measures the operating profit produced for each dollar of capital invested, whether from debt or equity. Cash generation measures quantity while ROIC measures the quality of value creation.
We at StockStory like to look at ROIC over a ten-year period because energy investment cycles can involve up to five years of ramping production and another five years of harvesting. A decade view captures buying, extracting, and monetizing rather than just part of that picture. Baker Hughes historically did a mediocre job investing in profitable growth initiatives. Its ten-year average ROIC was 3.3%, lower than the typical cost of capital (how much it costs to raise money) for energy upstream and integrated energy companies.
We like to invest in businesses with high returns, but the trend in a company’s ROIC is what often surprises the market and moves the stock price. Baker Hughes’s ROIC has increased over the last few years. This is a good sign, and we hope the company can continue improving.
11. Balance Sheet Assessment
Baker Hughes reported $3.72 billion of cash and $6.09 billion of debt on its balance sheet in the most recent quarter. As investors in high-quality companies, we primarily focus on two things: 1) that a company’s debt level isn’t too high and 2) that its interest payments are not excessively burdening the business.
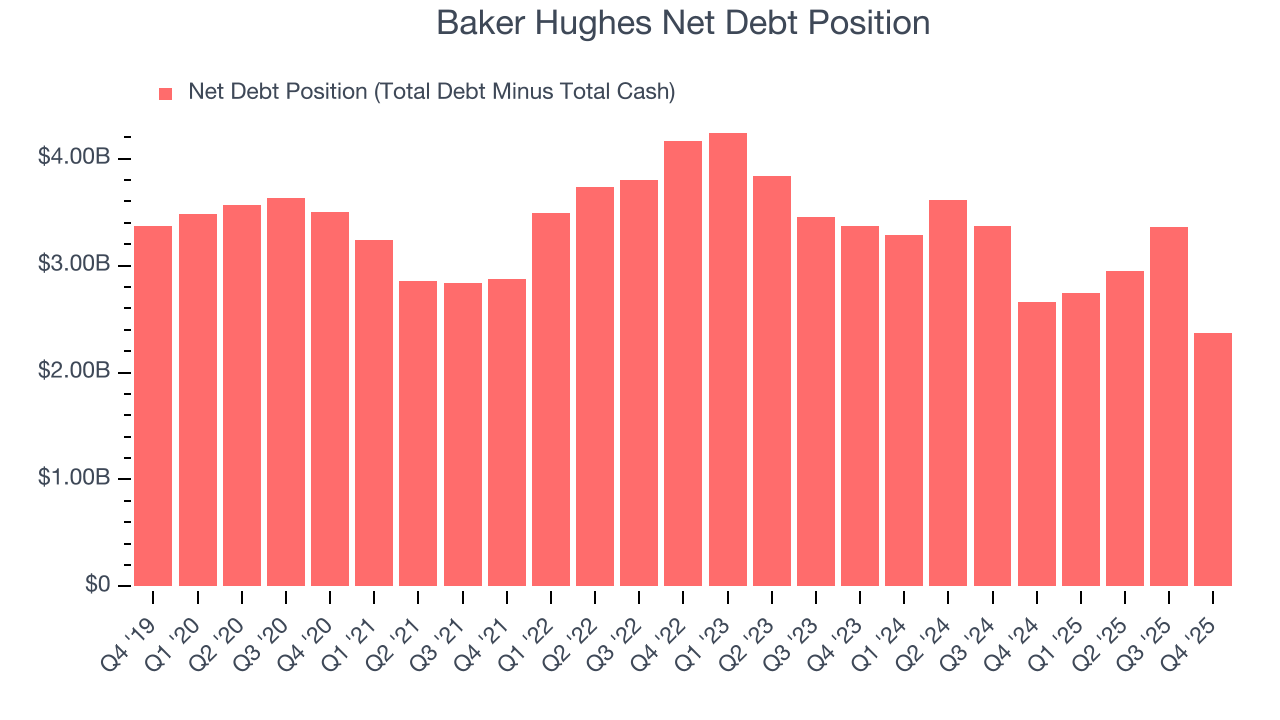
With $4.82 billion of EBITDA over the last 12 months, we view Baker Hughes’s 0.5× net-debt-to-EBITDA ratio as safe. We also see its $222 million of annual interest expenses as appropriate. The company’s profits give it plenty of breathing room, allowing it to continue investing in growth initiatives.
12. Key Takeaways from Baker Hughes’s Q4 Results
We were impressed by how significantly Baker Hughes blew past analysts’ revenue expectations this quarter. We were also glad its EPS outperformed Wall Street’s estimates. Zooming out, we think this was a solid print. The stock remained flat at $59.61 immediately following the results.
13. Is Now The Time To Buy Baker Hughes?
Updated: March 19, 2026 at 12:50 AM EDT
The latest quarterly earnings matters, sure, but we actually think longer-term fundamentals and valuation matter more. Investors should consider all these pieces before deciding whether or not to invest in Baker Hughes.
Baker Hughes’s business quality ultimately falls short of our standards. First off, its revenue growth over the last five years was bottom-tier for the sector, and analysts expect its demand to deteriorate over the next 12 months. While its top-tier scale enables operational efficiencies, capital market access, and investment in advanced technologies, the downside is its EBITDA margins reveal bottom-tier profitability compared to other energy upstream and integrated energy companies. On top of that, its gross margins show its business model is much less lucrative than other companies.
Baker Hughes’s P/E ratio based on the next 12 months is 22.1x. Investors with a higher risk tolerance might like the company, but we don’t really see a big opportunity at the moment. We're pretty confident there are superior stocks to buy right now.
Wall Street analysts have a consensus one-year price target of $61.33 on the company (compared to the current share price of $57.80).