
SLB (SLB)
We’re not sold on SLB. Its weak sales growth shows demand is soft and its low margins are a cause for concern.― StockStory Analyst Team
1. News
2. Summary
Why SLB Is Not Exciting
What began in 1926 with two brothers logging the first electrical measurements in a well, SLB (NYSE:SLB) provides technology and services to help oil and gas companies locate reservoirs, drill wells, and produce hydrocarbons.
- Costly operations and weak unit economics result in an inferior gross margin of 21.5% that must be offset through higher production volumes
- Responsiveness to unforeseen market trends is restricted due to its substandard EBITDA margin profitability
- One positive is that its unparalleled revenue scale of $37.37 billion gives it advantageous pricing and terms with suppliers


SLB doesn’t live up to our standards. We’re on the lookout for more interesting opportunities.
Why There Are Better Opportunities Than SLB


At $45.35 per share, SLB trades at 16.5x forward P/E. This multiple is cheaper than most energy upstream and integrated energy peers, but we think this is justified.
Cheap stocks can look like a great deal at first glance, but they can be value traps. They often have less earnings power, meaning there is more reliance on a re-rating to generate good returns - an unlikely scenario for low-quality companies.
3. SLB (SLB) Research Report: Q4 CY2025 Update
Oilfield services provider SLB (NYSE:SLB) reported Q4 CY2025 results beating Wall Street’s revenue expectations, but sales fell by 3.9% year on year to $9.75 billion. Its non-GAAP profit of $0.78 per share was 5% above analysts’ consensus estimates.
SLB (SLB) Q4 CY2025 Highlights:
- Revenue: $9.75 billion vs analyst estimates of $9.56 billion (3.9% year-on-year decline, 1.9% beat)
- Adjusted EPS: $0.78 vs analyst estimates of $0.74 (5% beat)
- Adjusted EBITDA: $2.33 billion vs analyst estimates of $2.29 billion (23.9% margin, 1.7% beat)
- Operating Margin: 16.4%, in line with the same quarter last year
- Free Cash Flow Margin: 23.5%, up from 16.1% in the same quarter last year
- Market Capitalization: $70.4 billion
Company Overview
What began in 1926 with two brothers logging the first electrical measurements in a well, SLB (NYSE:SLB) provides technology and services to help oil and gas companies locate reservoirs, drill wells, and produce hydrocarbons.
The company operates across the entire lifecycle of oil and gas production, from exploration to extraction. When an energy company wants to understand what lies beneath the earth's surface, SLB deploys wireline logging tools that measure rock formations and identify hydrocarbon deposits. Once a promising reservoir is identified, the company provides drilling fluids, drill bits, and directional drilling services to construct wells efficiently. For instance, an offshore operator in the Gulf of Mexico might use SLB's measurement-while-drilling technology to steer a wellbore horizontally through a productive formation thousands of feet below the seabed.
After a well is drilled, SLB's completion equipment—including packers and safety valves—prepares it for production. The company also provides artificial lift systems like electrical submersible pumps that bring oil to the surface when reservoir pressure is insufficient. For complex offshore projects, its OneSubsea joint venture supplies integrated subsea production systems, from wellheads to control systems, that enable operators to extract hydrocarbons from the ocean floor.
SLB generates revenue by selling equipment and charging for services based on usage, well count, or project scope. Its customers include national oil companies like Saudi Aramco and Petrobras, integrated majors like ExxonMobil and Shell, and independent producers. The company operates in over 100 countries, with significant activity in the Middle East, offshore Atlantic basins, and North American land plays. Beyond traditional hydrocarbons, SLB has expanded into carbon capture and sequestration, geothermal energy, and lithium extraction technologies.
4. Oilfield Services
Oilfield services companies provide equipment, technology, and services enabling exploration and production activities, including drilling, completion, well intervention, and reservoir evaluation. Their fortunes closely track upstream capital spending cycles. Tailwinds include increased drilling activity during favorable commodity environments, demand for efficiency-enhancing technologies, and growing offshore and unconventional resource development. Headwinds include significant revenue volatility tied to oil and gas price swings and producer spending discipline. Intense competition pressures pricing and margins, while the energy transition may structurally reduce long-term demand. Workforce availability and technological disruption require continuous adaptation.
SLB competes with other oilfield services companies including Halliburton (NYSE:HAL), Baker Hughes (NASDAQ:BKR), and Weatherford International (NASDAQ:WFRD), along with specialized equipment manufacturers and regional service providers.
5. Economies of Scale
The size of the revenue base is a way to assess topline, and it tells an investor whether an Energy producer has crossed the line between being a more vulnerable commodity taker and a durable operating platform. Scaled businesses tend to produce and generate revenue from many wells, pads, takeaway routes, and geographies, not just a single field or drilling program. SLB’s $37.37 billion of revenue in the last year is top-tier for the industry, suggesting the company has hit a level of diversification where investors can sleep easy at night.
6. Revenue Growth
A company’s long-term performance can give signals about its business quality. Even a bad business, especially in a cyclical industry, can shine for a year or so, but a top-tier one should exhibit resilience through cycles. Unfortunately, SLB’s 9.6% annualized revenue growth over the last five years was mediocre. This was below our standard for the energy upstream and integrated energy sector and is a rough starting point for our analysis.
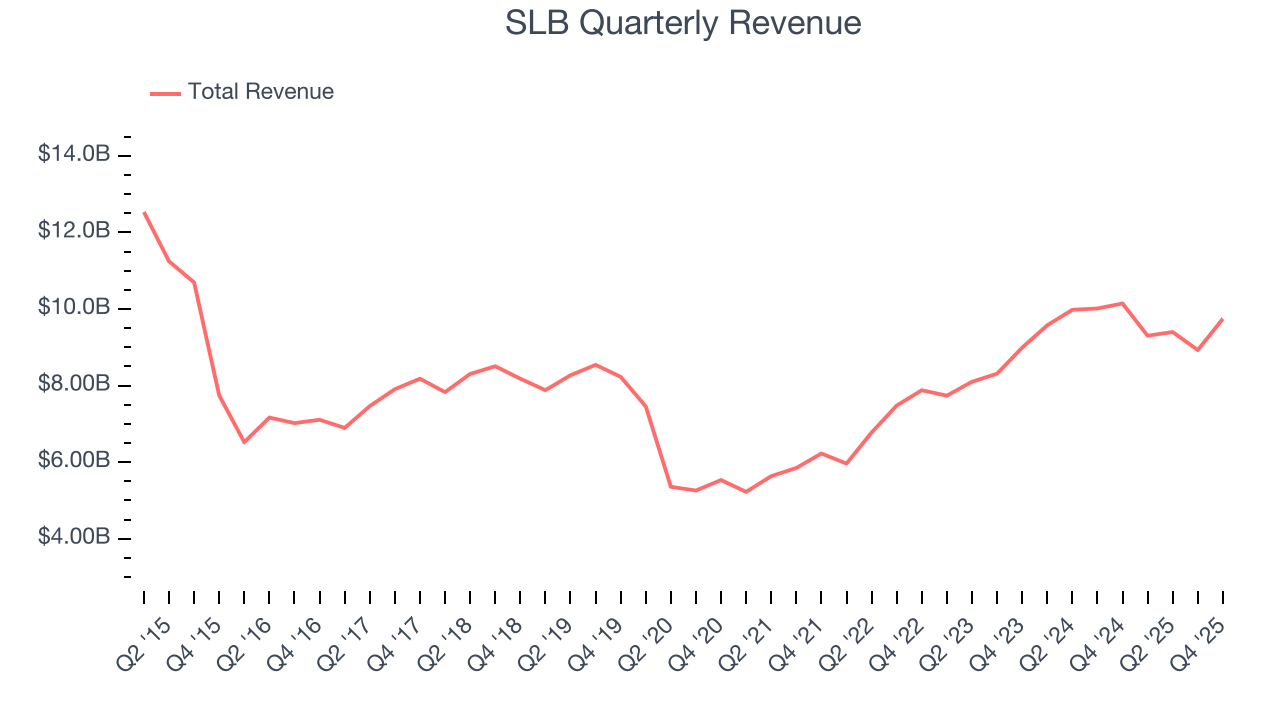
Within Energy, a singular timeframe, even if it’s quite long-term, only sheds light on how well a company rode the last commodity cycle. To better assess whether a company compounds through cycles, we validate our view with an even longer, ten-year view. SLB’s performance shows it grew in the past five-year but relinquished its gains over the last ten years, as its revenue fell by 1.2% annually.
Revenue provides useful context, but it is heavily influenced by commodity prices and acquisitions. Production volumes, by contrast, reveal whether the underlying asset base is actually growing. Over the last two years, SLB’s total oil volume per day - Upstream averaged 1.9% year-on-year declines. while natural gas volume per day - Upstream averaged 6.1% year-on-year declines.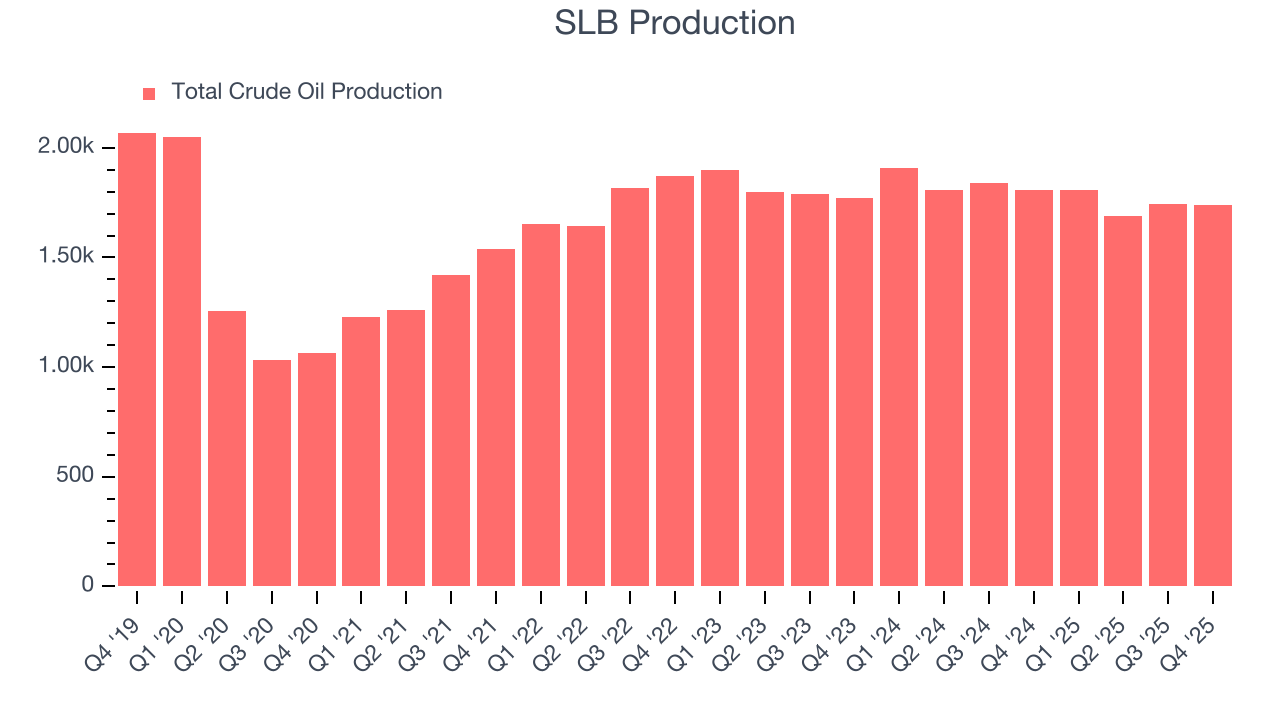
This quarter, SLB’s revenue fell by 3.9% year on year to $9.75 billion but beat Wall Street’s estimates by 1.9%. This quarter, SLB missed Wall Street’s estimates and reported a rather uninspiring 3.7% year-on-year production decline, generating 1.7 Mboe of production.
7. Gross Margin
While energy gross margins can be distorted by commodity prices, hedging, and short-term cost swings, sustained margins across a full cycle reflect a producer’s underlying asset quality, infrastructure position, and cost structure.
SLB, which averaged 21.5% gross margin over the last five years, exhibiting bottom-tier unit economics in the sector. It means the company will struggle at higher commodity prices than peers with better gross margins. 
SLB produced a 18.8% gross profit margin in Q4, down 9 percentage points year on year.
8. Adjusted EBITDA Margin
Adjusted EBITDA margin strips out accounting distortions tied to depletion and historical drilling spend, providing a clearer view of the cash-generating power of the underlying asset base before financing and reinvestment decisions.
SLB was profitable over the last five years but held back by its large cost base. Its average EBITDA margin of 23% was weak for an upstream and integrated energy business.
On the plus side, SLB’s EBITDA margin rose by 1.2 percentage points over the last year.
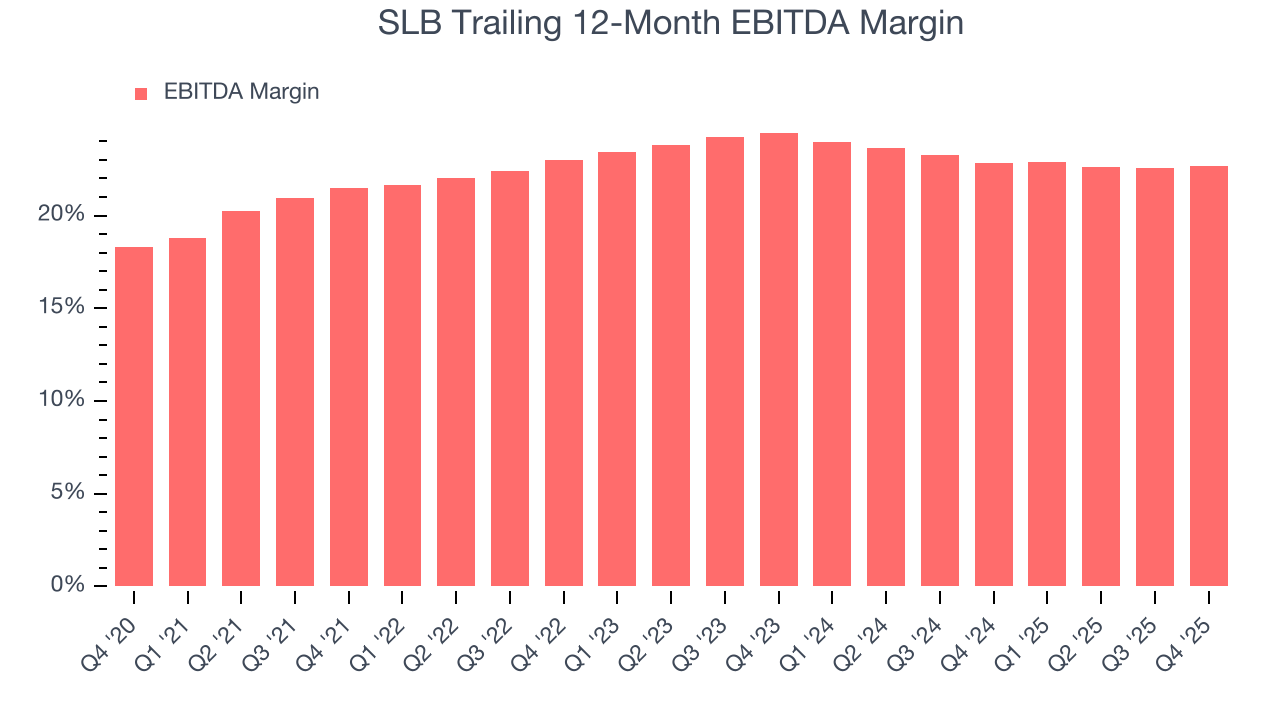
In Q4, SLB generated an EBITDA margin profit margin of 23.9%, in line with the same quarter last year. This indicates the company’s overall cost structure has been relatively stable. This adjusted EBITDA beat Wall Street’s estimates by 1.7%.
9. Cash Is King
Adjusted EBITDA shows how profitable a company’s existing “rock” is before financing and reinvestment, while free cash flow shows how much value remains after paying to replace those wells. Because production declines over time, strong EBITDA can coexist with weak FCF if drilling is expensive or declines are steep. FCF therefore captures both operating efficiency and the cost of sustaining production.
SLB has shown impressive cash profitability, giving it the option to reinvest or return capital to investors. The company’s free cash flow margin averaged 10.3% over the last five years, better than the broader energy upstream and integrated energy sector.
While the level of free cash flow margins is important, their consistency matters just as much.
SLB’s ratio of quarterly free cash flow volatility to WTI crude price volatility over the past five years was 6 (lower is better), indicating excellent insulation from commodity swings. This stability supports capital access in downturns and positions SLB to act as a consolidator when weaker peers are forced to retrench.
You may be asking why we wait until the free cash flow line to perform this stability analysis versus commodity prices. Why not compare revenue or EBITDA to WTI Crude prices in the case of SLB? Because what ultimately matters is not how much revenue or profit you earn when prices are high but how much cash you can generate when prices are low. Free cash flow is the superior metric because it includes everything from hedging prowess to growth and maintenance capex to management behavior during good times and bad.
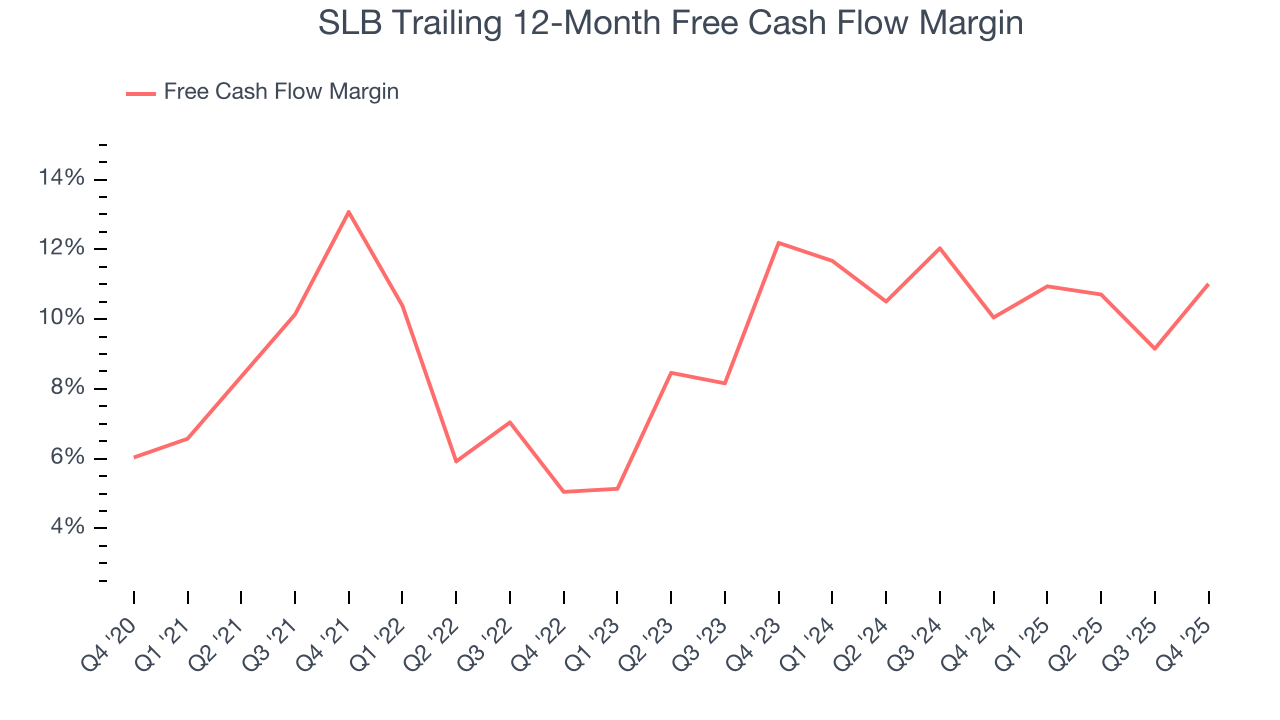
SLB’s free cash flow clocked in at $2.29 billion in Q4, equivalent to a 23.5% margin. This result was good as its margin was 7.4 percentage points higher than in the same quarter last year, but we wouldn’t read too much into the short term because investment needs can be seasonal, leading to temporary swings. Long-term trends are more important.
10. Return on Invested Capital (ROIC)
Free cash flow shows how much money a producer generated, while ROIC shows how efficiently that money was earned. ROIC measures the operating profit produced for each dollar of capital invested, whether from debt or equity. Cash generation measures quantity while ROIC measures the quality of value creation.
We at StockStory like to look at ROIC over a ten-year period because energy investment cycles can involve up to five years of ramping production and another five years of harvesting. A decade view captures buying, extracting, and monetizing rather than just part of that picture. SLB’s management team makes decent investment decisions and generates value for shareholders. Its ten-year average ROIC was 9.9%, slightly better than typical energy upstream and integrated energy business.
We like to invest in businesses with high returns, but the trend in a company’s ROIC is what often surprises the market and moves the stock price. Fortunately, SLB’s has increased over the last few years. This is a good sign, and we hope the company can keep improving.
11. Balance Sheet Assessment
SLB reported $4.21 billion of cash and $11.64 billion of debt on its balance sheet in the most recent quarter. As investors in high-quality companies, we primarily focus on two things: 1) that a company’s debt level isn’t too high and 2) that its interest payments are not excessively burdening the business.
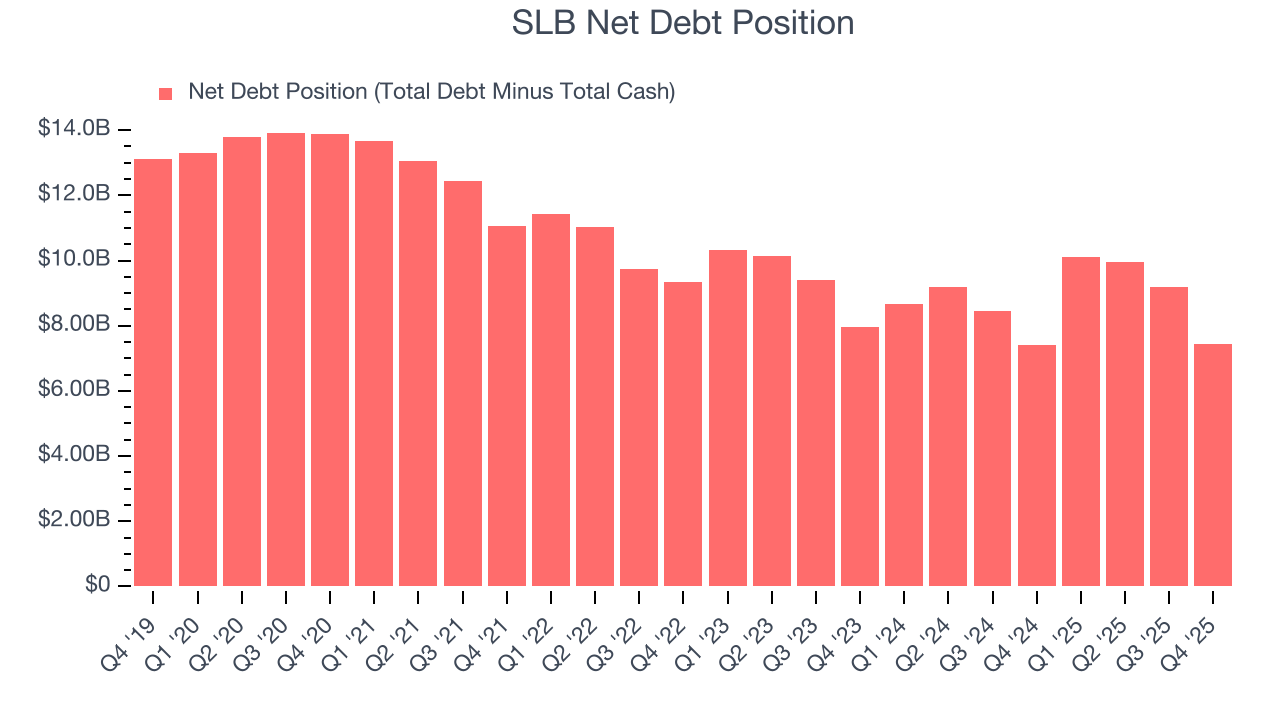
With $8.46 billion of EBITDA over the last 12 months, we view SLB’s 0.9× net-debt-to-EBITDA ratio as safe. We also see its $421 million of annual interest expenses as appropriate. The company’s profits give it plenty of breathing room, allowing it to continue investing in growth initiatives.
12. Key Takeaways from SLB’s Q4 Results
It was encouraging to see SLB beat analysts’ revenue expectations this quarter. We were also glad its EPS outperformed Wall Street’s estimates. On the other hand, its production missed. Overall, this was a weaker quarter. The stock traded down 1% to $46.43 immediately after reporting.
13. Is Now The Time To Buy SLB?
Updated: March 19, 2026 at 12:49 AM EDT
We think that the latest earnings result is only one piece of the bigger puzzle. If you’re deciding whether to own SLB, you should also grasp the company’s longer-term business quality and valuation.
There are some bright spots in SLB’s fundamentals, but its business quality ultimately falls short. Although its revenue growth over the last five years was subpar for the sector and analysts expect growth to slow over the next 12 months, its top-tier scale enables operational efficiencies, capital market access, and investment in advanced technologies. Investors should tread carefully with this one, however, as SLB’s gross margins show its business model is much less lucrative than other companies.
SLB’s P/E ratio based on the next 12 months is 16.5x. This valuation multiple is fair, but we don’t have much faith in the company. We're pretty confident there are more exciting stocks to buy at the moment.
Wall Street analysts have a consensus one-year price target of $55.40 on the company (compared to the current share price of $45.35).