
Core Laboratories (CLB)
We wouldn’t buy Core Laboratories. Its poor sales growth and falling returns on capital suggest its growth opportunities are shrinking.― StockStory Analyst Team
1. News
2. Summary
Why We Think Core Laboratories Will Underperform
With roots dating back to the first commercial oil boom, Core Laboratories (NYSE:CLB) analyzes rock and fluid samples from oil and gas reservoirs to help energy companies optimize production and recovery.
- 1.6% annual revenue growth over the last five years was slower than its energy upstream and integrated energy peers
- Modest revenue base of $526.5 million gives it less fixed cost leverage and fewer distribution channels than larger companies
- Costly operations and weak unit economics result in an inferior gross margin of 20.7% that must be offset through higher production volumes


Core Laboratories doesn’t check our boxes. We see more attractive opportunities in the market.
Why There Are Better Opportunities Than Core Laboratories


Core Laboratories’s stock price of $16.10 implies a valuation ratio of 22.1x forward P/E. This multiple is quite expensive for the quality you get.
We’d rather pay up for companies with elite fundamentals than get a decent price on a poor one. High-quality businesses often have more durable earnings power, helping us sleep well at night.
3. Core Laboratories (CLB) Research Report: Q4 CY2025 Update
Oilfield services company Core Laboratories (NYSE:CLB) announced better-than-expected revenue in Q4 CY2025, with sales up 7% year on year to $138.3 million. Its non-GAAP profit of $0.21 per share was 10.5% above analysts’ consensus estimates.
Core Laboratories (CLB) Q4 CY2025 Highlights:
- Revenue: $138.3 million vs analyst estimates of $133.6 million (7% year-on-year growth, 3.5% beat)
- Adjusted EPS: $0.21 vs analyst estimates of $0.19 (10.5% beat)
- Adjusted EBITDA: $19.41 million vs analyst estimates of $19.12 million (14% margin, 1.5% beat)
- Operating Margin: 11.5%, up from 8.4% in the same quarter last year
- Free Cash Flow Margin: 3.2%, down from 12.6% in the same quarter last year
- Market Capitalization: $740.8 million
Company Overview
With roots dating back to the first commercial oil boom, Core Laboratories (NYSE:CLB) analyzes rock and fluid samples from oil and gas reservoirs to help energy companies optimize production and recovery.
The company operates through two main business segments. Reservoir Description, which accounts for the majority of revenue, focuses on laboratory analysis of reservoir samples. When an oil company drills into a potential oil or gas field, they extract core samples—cylindrical pieces of rock—and fluid samples from thousands of feet underground. Core Laboratories examines these samples to measure critical properties like porosity (how much oil or gas the rock can hold) and permeability (how easily fluids can flow through it). For instance, an operator exploring a deepwater field might send Core Laboratories rock samples to determine if a formation has sufficient permeability to justify the cost of drilling production wells.
The fluid analysis work is equally important. Core Laboratories determines the composition and physical properties of crude oil and natural gas at actual reservoir pressure and temperature conditions. This helps clients understand how these fluids will behave as they're extracted and processed. The company also conducts specialized tests to simulate enhanced recovery techniques, such as flooding a reservoir with water or carbon dioxide to push more oil toward production wells.
The Production Enhancement segment manufactures perforating systems—specialized explosive charges that create holes through steel well casing and into the surrounding rock formation to allow oil and gas to flow into the wellbore. These perforating charges are engineered to create clean, precise tunnels into the reservoir that maximize flow. The segment also provides diagnostic services using proprietary tracer chemicals to monitor the effectiveness of hydraulic fracturing operations in unconventional shale plays like the Permian Basin, helping operators understand which fracture stages are producing effectively.
Core Laboratories serves major international oil companies, national oil companies, and independent producers through over 70 offices across more than 50 countries. The company's laboratories are also being applied to energy transition projects, including carbon capture and storage site evaluations and geothermal assessments.
4. Oilfield Services
Oilfield services companies provide equipment, technology, and services enabling exploration and production activities, including drilling, completion, well intervention, and reservoir evaluation. Their fortunes closely track upstream capital spending cycles. Tailwinds include increased drilling activity during favorable commodity environments, demand for efficiency-enhancing technologies, and growing offshore and unconventional resource development. Headwinds include significant revenue volatility tied to oil and gas price swings and producer spending discipline. Intense competition pressures pricing and margins, while the energy transition may structurally reduce long-term demand. Workforce availability and technological disruption require continuous adaptation.
Core Laboratories competes with diversified oilfield service providers like Schlumberger (NYSE:SLB) and Halliburton (NYSE:HAL), as well as specialized reservoir analysis firms like Weatherford International (NASDAQ:WFRD) and private laboratory service companies.
5. Revenue Scale
The size of the revenue base is a way to assess topline, and it tells an investor whether an Energy producer has crossed the line between being a more vulnerable commodity taker and a durable operating platform. Scaled businesses tend to produce and generate revenue from many wells, pads, takeaway routes, and geographies, not just a single field or drilling program. Core Laboratories’s $526.5 million of revenue in the last year is pretty small for the industry, suggesting the company hasn’t hit a level of diversification where investors can sleep easy at night.
6. Revenue Growth
A company’s long-term performance can give signals about its business quality. Even a bad business, especially in a cyclical industry, can shine for a year or so, but a top-tier one should exhibit resilience through cycles. Unfortunately, Core Laboratories’s 1.6% annualized revenue growth over the last five years was weak. This was below our standards and is a poor baseline for our analysis.
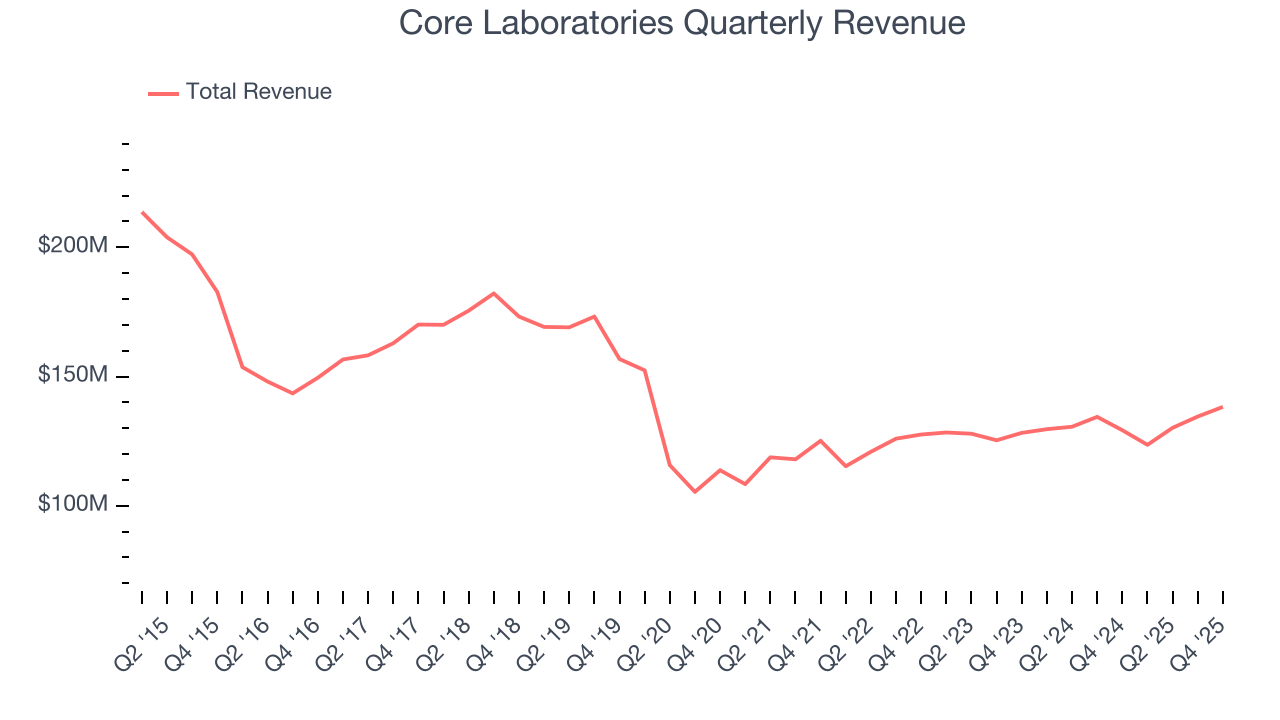
Within Energy, a singular timeframe, even if it’s quite long-term, only sheds light on how well a company rode the last commodity cycle. To better assess whether a company compounds through cycles, we validate our view with an even longer, ten-year view. Core Laboratories’s performance shows it grew in the past five-year but relinquished its gains over the last ten years, as its revenue fell by 4.1% annually.
This quarter, Core Laboratories reported year-on-year revenue growth of 7%, and its $138.3 million of revenue exceeded Wall Street’s estimates by 3.5%.
7. Gross Margin
While energy gross margins can be distorted by commodity prices, hedging, and short-term cost swings, sustained margins across a full cycle reflect a producer’s underlying asset quality, infrastructure position, and cost structure.
Core Laboratories, which averaged 20.7% gross margin over the last five years, exhibiting bottom-tier unit economics in the sector. It means the company will struggle at higher commodity prices than peers with better gross margins. 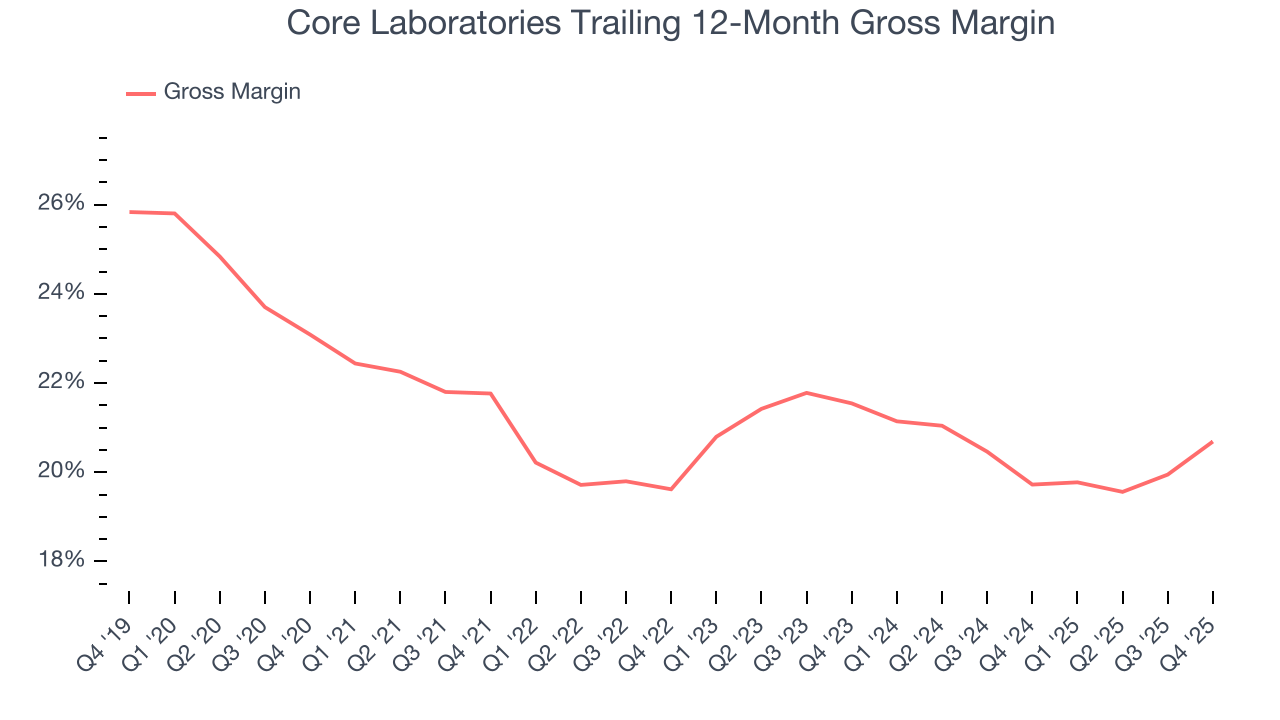
This quarter, Core Laboratories’s gross profit margin was 20.8%, up 3 percentage points year on year.
8. Adjusted EBITDA Margin
Core Laboratories was profitable over the last five years but held back by its large cost base. Its average EBITDA margin of 14.4% was among the worst in the energy upstream and integrated energy sector.
Looking at the trend in its profitability, Core Laboratories’s EBITDA margin decreased by 1.1 percentage points over the last year. Core Laboratories’s performance was poor no matter how you look at it - it shows that costs were rising and it couldn’t pass them onto its customers.
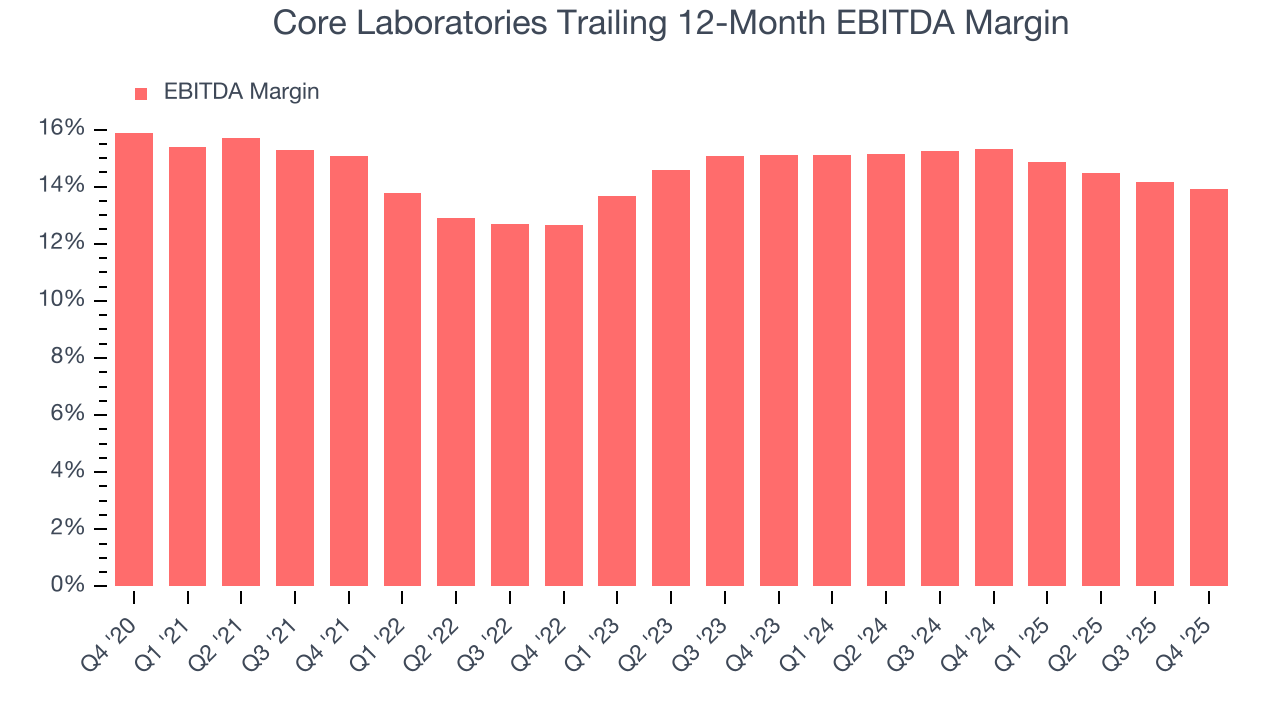
In Q4, Core Laboratories generated an EBITDA margin profit margin of 14%, in line with the same quarter last year. This indicates the company’s overall cost structure has been relatively stable. This adjusted EBITDA beat Wall Street’s estimates by 1.5%.
9. Cash Is King
Adjusted EBITDA shows how profitable a company’s existing wells are before financing and reinvestment decisions, but free cash flow shows how much value remains after paying the cost of replacing those wells. In upstream energy, production naturally declines over time, so companies must continuously reinvest just to stand still. A producer can report strong EBITDA margins yet generate little or no free cash flow if its wells decline quickly or if new drilling is expensive. Free cash flow therefore captures not only how efficiently a company produces hydrocarbons today, but also how costly it is to sustain that production into the future.
Core Laboratories has shown weak cash profitability relative to peers over the last five years, giving the company fewer opportunities to return capital to shareholders. Its free cash flow margin averaged 4.7%, below what we’d expect for an upstream and integrated energy business.
While the level of free cash flow margins is important, their consistency matters just as much.
Core Laboratories’s ratio of quarterly free cash flow volatility to WTI crude price volatility over the past five years was 6.4 (lower is better), indicating excellent insulation from commodity swings. This stability supports capital access in downturns and positions Core Laboratories to act as a consolidator when weaker peers are forced to retrench.
You may be asking why we wait until the free cash flow line to perform this stability analysis versus commodity prices. Why not compare revenue or EBITDA to WTI in the case of Core Laboratories? Because what ultimately matters is not how much revenue or profit you earn when prices are high but how much cash you can generate when prices are low. Free cash flow is the superior metric because it includes everything from hedging prowess to growth and maintenance capex to management behavior during good times and bad.
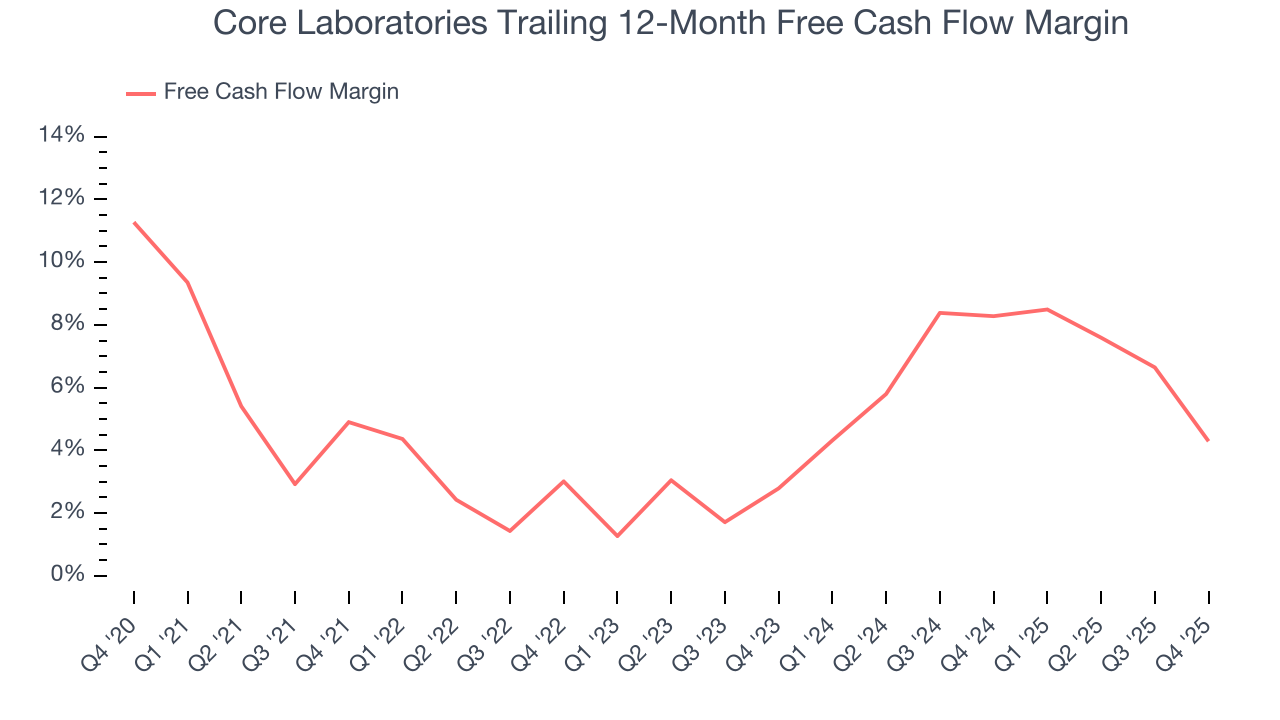
Core Laboratories’s free cash flow clocked in at $4.44 million in Q4, equivalent to a 3.2% margin. The company’s cash profitability regressed as it was 9.4 percentage points lower than in the same quarter last year, prompting us to pay closer attention. Short-term fluctuations typically aren’t a big deal because investment needs can be seasonal, but we’ll be watching to see if the trend extrapolates into future quarters.
10. Return on Invested Capital (ROIC)
Free cash flow shows how much money a producer generated, while ROIC shows how efficiently that money was earned. ROIC measures the operating profit produced for each dollar of capital invested, whether from debt or equity. Cash generation measures quantity while ROIC measures the quality of value creation.
We at StockStory like to look at ROIC over a ten-year period because energy investment cycles can involve up to five years of ramping production and another five years of harvesting. A decade view captures buying, extracting, and monetizing rather than just part of that picture. Although Core Laboratories hasn’t been the highest-quality company lately because of its poor top-line performance, it historically found a few growth initiatives that worked out well. Its ten-year average ROIC was 16.1%, impressive for an upstream and integrated energy business.
We like to invest in businesses with high returns, but the trend in a company’s ROIC is what often surprises the market and moves the stock price. Fortunately, Core Laboratories’s ROIC averaged 1.1 percentage point increases each year over the last few years. This is a good sign, and we hope the company can keep improving.
11. Balance Sheet Assessment
Core Laboratories reported $22.85 million of cash and $121.7 million of debt on its balance sheet in the most recent quarter. As investors in high-quality companies, we primarily focus on two things: 1) that a company’s debt level isn’t too high and 2) that its interest payments are not excessively burdening the business.
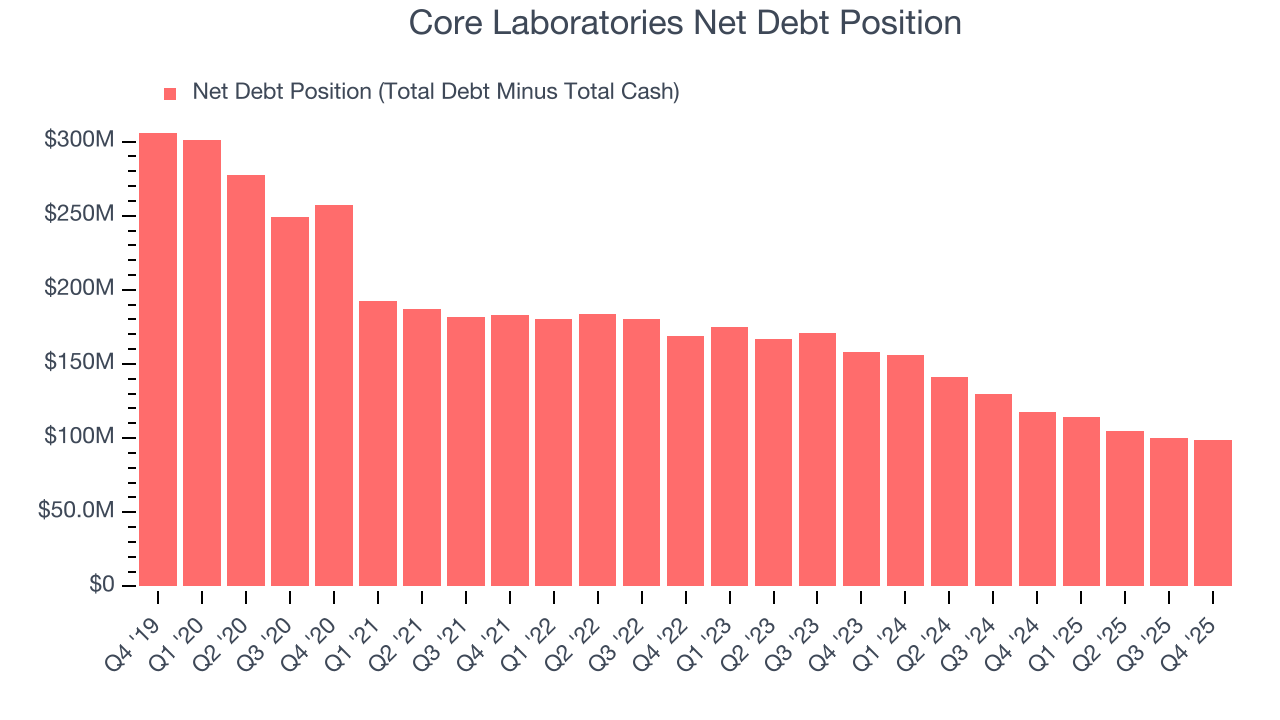
With $73.38 million of EBITDA over the last 12 months, we view Core Laboratories’s 1.3× net-debt-to-EBITDA ratio as safe. We also see its $10.57 million of annual interest expenses as appropriate. The company’s profits give it plenty of breathing room, allowing it to continue investing in growth initiatives.
12. Key Takeaways from Core Laboratories’s Q4 Results
We enjoyed seeing Core Laboratories beat analysts’ revenue expectations this quarter. We were also glad its EPS outperformed Wall Street’s estimates. Overall, we think this was a decent quarter with some key metrics above expectations. The stock remained flat at $16.31 immediately following the results.
13. Is Now The Time To Buy Core Laboratories?
Updated: March 24, 2026 at 1:13 AM EDT
Before making an investment decision, investors should account for Core Laboratories’s business fundamentals and valuation in addition to what happened in the latest quarter.
Core Laboratories falls short of our quality standards. To begin with, its revenue growth over the last five years was bottom-tier for the sector, and analysts don’t see anything changing over the next 12 months. While its market-beating ROIC suggests it has been a well-managed company historically, the downside is its EBITDA margins reveal bottom-tier profitability compared to other energy upstream and integrated energy companies. On top of that, its gross margins show its business model is much less lucrative than other companies.
Core Laboratories’s P/E ratio based on the next 12 months is 22.1x. This multiple tells us a lot of good news is priced in - we think there are better stocks to buy right now.
Wall Street analysts have a consensus one-year price target of $15.83 on the company (compared to the current share price of $16.10).