
Murphy Oil (MUR)
We aren’t fans of Murphy Oil. Its weak sales growth and low returns on capital show it struggled to generate demand and profits.― StockStory Analyst Team
1. News


2. Summary
Why We Think Murphy Oil Will Underperform
Operating in waters over a mile deep in the Gulf of Mexico and extracting hydrocarbons from tight shale rock formations in Texas, Murphy Oil (NYSE:MUR) explores for and produces crude oil, natural gas, and natural gas liquids from fields in North America and Asia.
- Efficiency has decreased over the last five years as its EBITDA margin fell by 11.1 percentage points
- ROIC of 4.3% reflects management’s challenges in identifying attractive investment opportunities
- One positive is that its powerful free cash flow generation enables it to reinvest its profits or return capital to investors consistently


Murphy Oil doesn’t satisfy our quality benchmarks. We see more attractive opportunities in the market.
Why There Are Better Opportunities Than Murphy Oil


Murphy Oil’s stock price of $37.55 implies a valuation ratio of 18.5x forward P/E. This multiple is high given its weaker fundamentals.
Paying up for elite businesses with strong earnings potential is better than investing in lower-quality companies with shaky fundamentals. That’s how you avoid big downside over the long term.
3. Murphy Oil (MUR) Research Report: Q4 CY2025 Update
Oil and gas producer Murphy Oil (NYSE:MUR) fell short of the market’s revenue expectations in Q4 CY2025, with sales falling 7% year on year to $624.6 million. Its non-GAAP profit of $0.14 per share was significantly above analysts’ consensus estimates.
Murphy Oil (MUR) Q4 CY2025 Highlights:
- Revenue: $624.6 million vs analyst estimates of $630.6 million (7% year-on-year decline, 1% miss)
- Adjusted EPS: $0.14 vs analyst estimates of -$0.03 (significant beat)
- Adjusted EBITDA: $298.1 million vs analyst estimates of $345.5 million (47.7% margin, 13.7% miss)
- Operating Margin: 9.5%, down from 12.7% in the same quarter last year
- Free Cash Flow Margin: 1.2%, down from 32.7% in the same quarter last year
- Market Capitalization: $4.93 billion
Company Overview
Operating in waters over a mile deep in the Gulf of Mexico and extracting hydrocarbons from tight shale rock formations in Texas, Murphy Oil (NYSE:MUR) explores for and produces crude oil, natural gas, and natural gas liquids from fields in North America and Asia.
Murphy Oil operates as an upstream energy company, meaning it focuses solely on finding and extracting hydrocarbons from underground reservoirs rather than refining or selling them at retail. The company drills wells and manages producing fields across diverse geological settings—from deepwater platforms in the Gulf of Mexico to horizontal wells drilled through underground shale formations in South Texas's Eagle Ford play, to offshore projects in Western Canada and Southeast Asia.
In the United States, Murphy Oil's production comes primarily from two areas. Its Gulf of Mexico operations involve complex offshore platforms that tap into oil and gas reserves thousands of feet below the seafloor, with fields like Khaleesi, Mormont, and St. Malo providing the majority of its Gulf production. Its onshore Eagle Ford operations use hydraulic fracturing to unlock oil and gas trapped in dense shale rock layers. In Canada, the company produces natural gas from the Tupper Montney formation in British Columbia and holds interests in the Hibernia and Terra Nova offshore oil fields in Newfoundland. Murphy Oil also maintains smaller production in Brunei and has development projects underway in Vietnam, including the Lac Da Vang field slated to begin producing in 2026.
The company sells its crude oil production to refineries and its natural gas to utilities, industrial customers, and pipeline operators. For example, a refinery in Texas might purchase Murphy Oil's Eagle Ford crude to process into gasoline and diesel, while a power plant could buy its natural gas to generate electricity. Revenue comes directly from these hydrocarbon sales, with prices fluctuating based on global commodity markets.
4. Mixed or Offshore Upstream E&P
This category includes smaller or niche E&P companies operating in specialized basins, geographies, or resource types outside major classifications. These firms may target unconventional resources, frontier regions, or specific commodity niches. Tailwinds include potential for outsized returns from successful exploration, acquisition opportunities during industry downturns, and specialized expertise commanding premium valuations. Headwinds include higher operational and geological risks, limited scale reducing negotiating power and cost efficiencies, and constrained capital market access during challenging commodity environments. Regulatory risks and ESG concerns may disproportionately affect smaller operators with fewer resources for compliance.
Murphy Oil competes with other independent exploration and production companies including ConocoPhillips (NYSE:COP), Hess (NYSE:HES), EOG Resources (NYSE:EOG), Devon Energy (NYSE:DVN), and Marathon Oil (NYSE:MRO).
5. Economies of Scale
In Energy, scale separates fragile single-asset producers from platform-style businesses that generate revenue across entire basins and infrastructure networks. Murphy Oil’s $2.72 billion of revenue in the last year lacks scale in an industry where it matters.
6. Revenue Growth
Cyclical sectors like Energy often flatter weaker operators during favorable price environments, but a longer-term lens separates those from businesses that can consistently perform across market cycles. Regrettably, Murphy Oil’s sales grew at a sluggish 6.7% compounded annual growth rate over the last five years. This fell short of our benchmark for the energy upstream and integrated energy sector and is a poor baseline for our analysis.
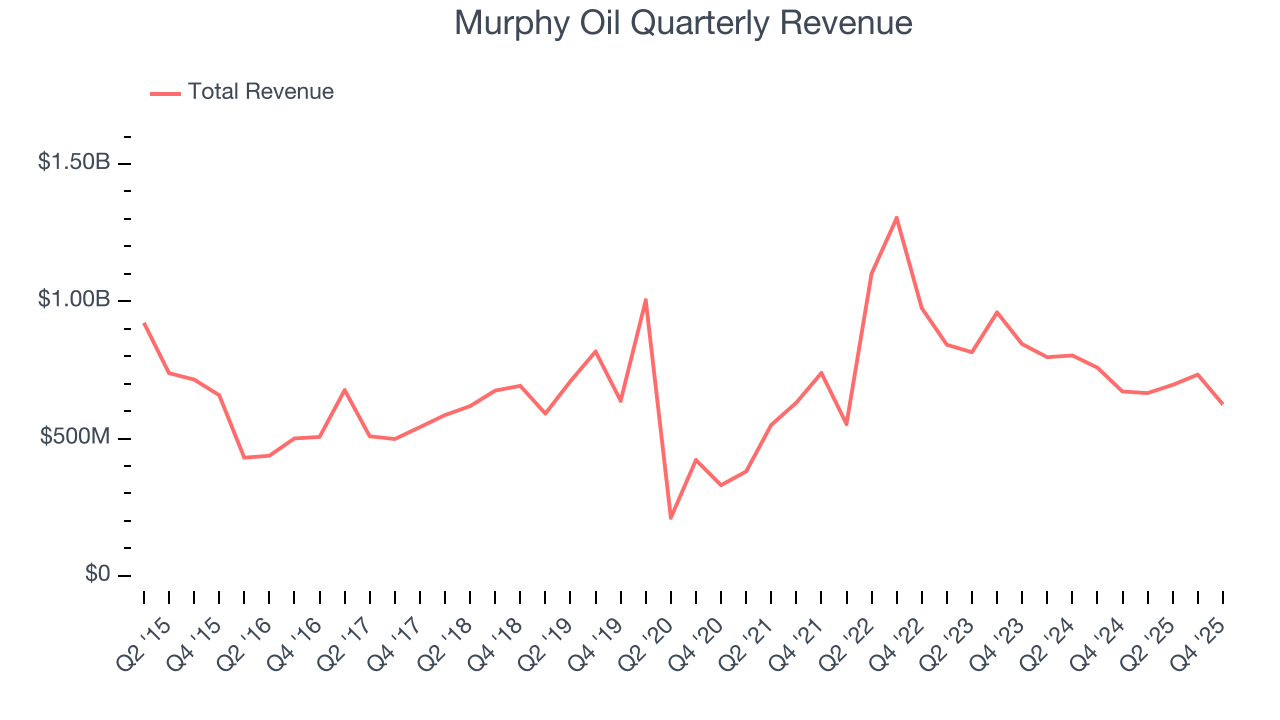
Within Energy, a singular timeframe, even if it’s quite long-term, only sheds light on how well a company rode the last commodity cycle. To better assess whether a company compounds through cycles, we validate our view with an even longer, ten-year view. Murphy Oil’s performance shows it grew in the past five-year but relinquished its gains over the last ten years, as its revenue fell by 1.1% annually.
Revenue provides useful context, but it is heavily influenced by commodity prices and acquisitions. Production volumes, by contrast, reveal whether the underlying asset base is actually growing. Over the last two years, Murphy Oil’s total oil volume per day - Upstream averaged 4.5% year-on-year growth while natural gas volume per day - Upstream averaged 4.7% year-on-year growth, which was good. 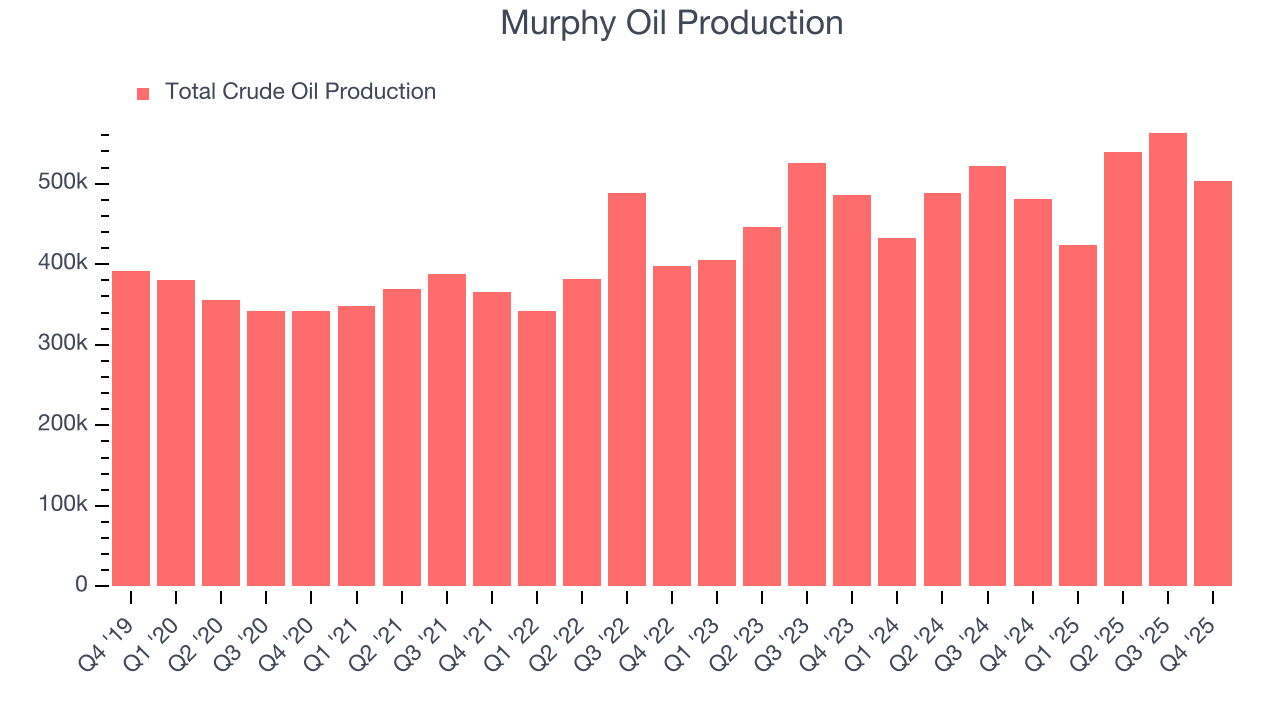
This quarter, Murphy Oil missed Wall Street’s estimates and reported a rather uninspiring 7% year-on-year revenue decline, generating $624.6 million of revenue. This quarter, Murphy Oil reported modest year-on-year production growth of 4.6% but beat Wall Street’s estimates by 0.7%.
7. Adjusted EBITDA Margin
Adjusted EBITDA margin is an important measure of profitability for the sector and accounts for the gross margins and operating costs mentioned previously. Unlike operating margin, it is not distorted by accounting conventions around reserves, drilling costs, and assumptions on commodity consumption from the well or basin. Adjusted EBITDA highlights the economic reality of how much cash the rock produces before the capital structure (debt service) and the drilling budget (capex) are considered.
Murphy Oil has been a well-oiled machine over the last five years. It demonstrated elite profitability for an upstream and integrated energy business, boasting an average EBITDA margin of 54.7%.
Analyzing the trend in its profitability, Murphy Oil’s EBITDA margin decreased by 11.1 percentage points over the last year. Even though its historical margin was healthy, shareholders will want to see Murphy Oil become more profitable in the future.
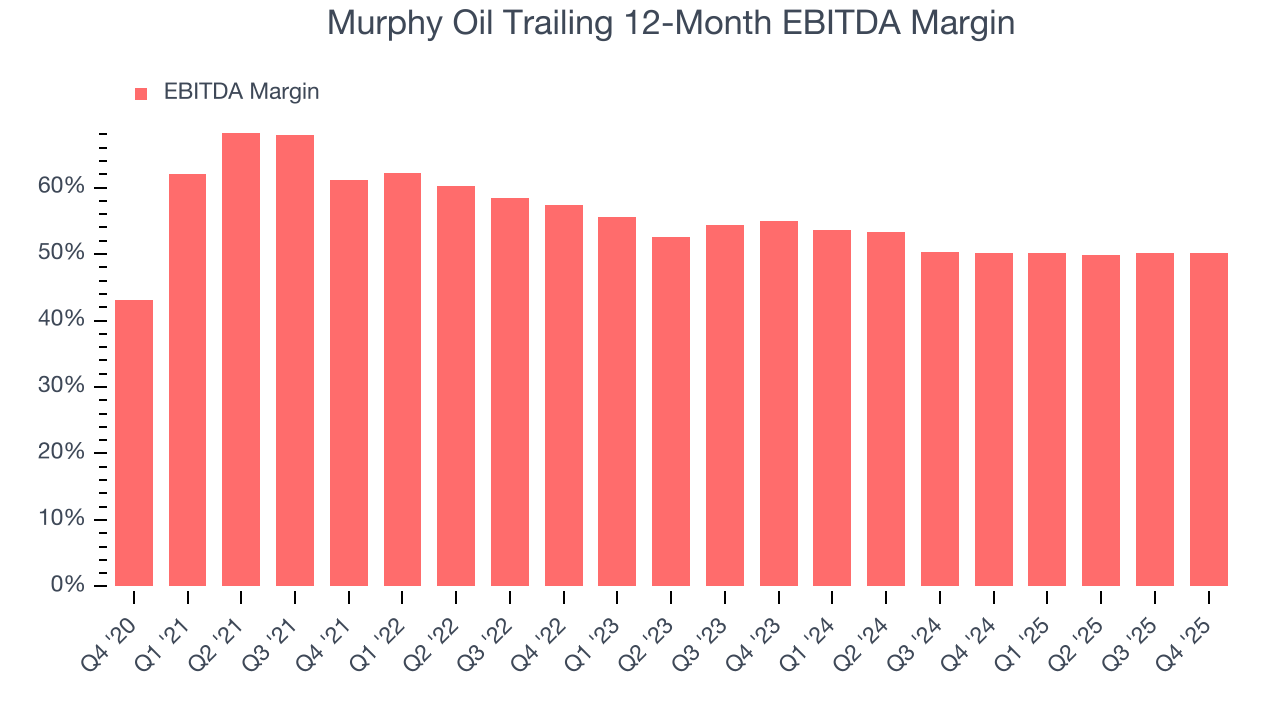
In Q4, Murphy Oil generated an EBITDA margin profit margin of 47.7%, in line with the same quarter last year. This indicates the company’s overall cost structure has been relatively stable. This adjusted EBITDA fell short of Wall Street’s estimates.
8. Cash Is King
Adjusted EBITDA shows how profitable a company’s existing wells are before financing and reinvestment decisions, but free cash flow shows how much value remains after paying the cost of replacing those wells. In upstream energy, production naturally declines over time, so companies must continuously reinvest just to stand still. A producer can report strong EBITDA margins yet generate little or no free cash flow if its wells decline quickly or if new drilling is expensive. Free cash flow therefore captures not only how efficiently a company produces hydrocarbons today, but also how costly it is to sustain that production into the future.
Murphy Oil has shown terrific cash profitability, driven by its lucrative business model that enables it to reinvest, return capital to investors, and stay ahead of the competition. The company’s free cash flow margin was among the best in the energy upstream and integrated energy sector, averaging 23.5% over the last five years.
The level of free cash flow is important, but its durability across cycles is just as critical. Consistent margins are far more valuable than volatile swings driven by commodity prices.
Murphy Oil’s ratio of quarterly free cash flow volatility to WTI crude price volatility over the past five years was 4.5 (lower is better), indicating excellent insulation from commodity swings. This stability supports superior capital access in downturns and positions Murphy Oil to act as a consolidator when weaker peers are forced to retrench.
You may be asking why we wait until the free cash flow line to perform this stability analysis versus commodity prices. Why not compare revenue or EBITDA to WTI in the case of Murphy Oil? Because what ultimately matters is not how much revenue or profit you earn when prices are high but how much cash you can generate when prices are low. Free cash flow is the superior metric because it includes everything from hedging prowess to growth and maintenance capex to management behavior during good times and bad.
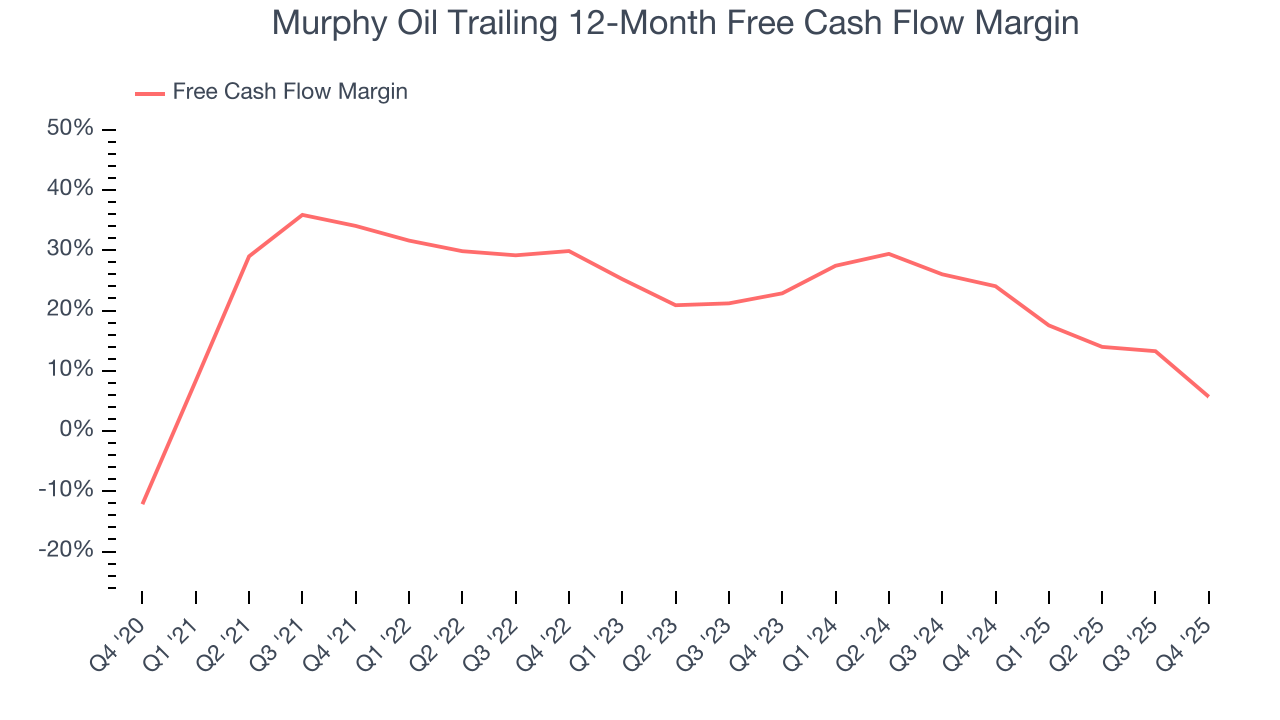
Murphy Oil’s free cash flow clocked in at $7.52 million in Q4, equivalent to a 1.2% margin. The company’s cash profitability regressed as it was 31.5 percentage points lower than in the same quarter last year, suggesting its historical struggles have dragged on.
9. Return on Invested Capital (ROIC)
Free cash flow shows how much money a producer generated, while ROIC shows how efficiently that money was earned. ROIC measures the operating profit produced for each dollar of capital invested, whether from debt or equity. Cash generation measures quantity while ROIC measures the quality of value creation.
We at StockStory like to look at ROIC over a ten-year period because energy investment cycles can involve up to five years of ramping production and another five years of harvesting. A decade view captures buying, extracting, and monetizing rather than just part of that picture. Murphy Oil historically did a mediocre job investing in profitable growth initiatives. Its ten-year average ROIC was 4.3%, lower than the typical cost of capital (how much it costs to raise money) for energy upstream and integrated energy companies.
We like to invest in businesses with high returns, but the trend in a company’s ROIC is what often surprises the market and moves the stock price. Over the last few years, Murphy Oil’s ROIC has unfortunately decreased. Paired with its already low returns, these declines suggest its profitable growth opportunities are few and far between.
10. Balance Sheet Assessment
Murphy Oil reported $377.2 million of cash and $1.39 billion of debt on its balance sheet in the most recent quarter. As investors in high-quality companies, we primarily focus on two things: 1) that a company’s debt level isn’t too high and 2) that its interest payments are not excessively burdening the business.
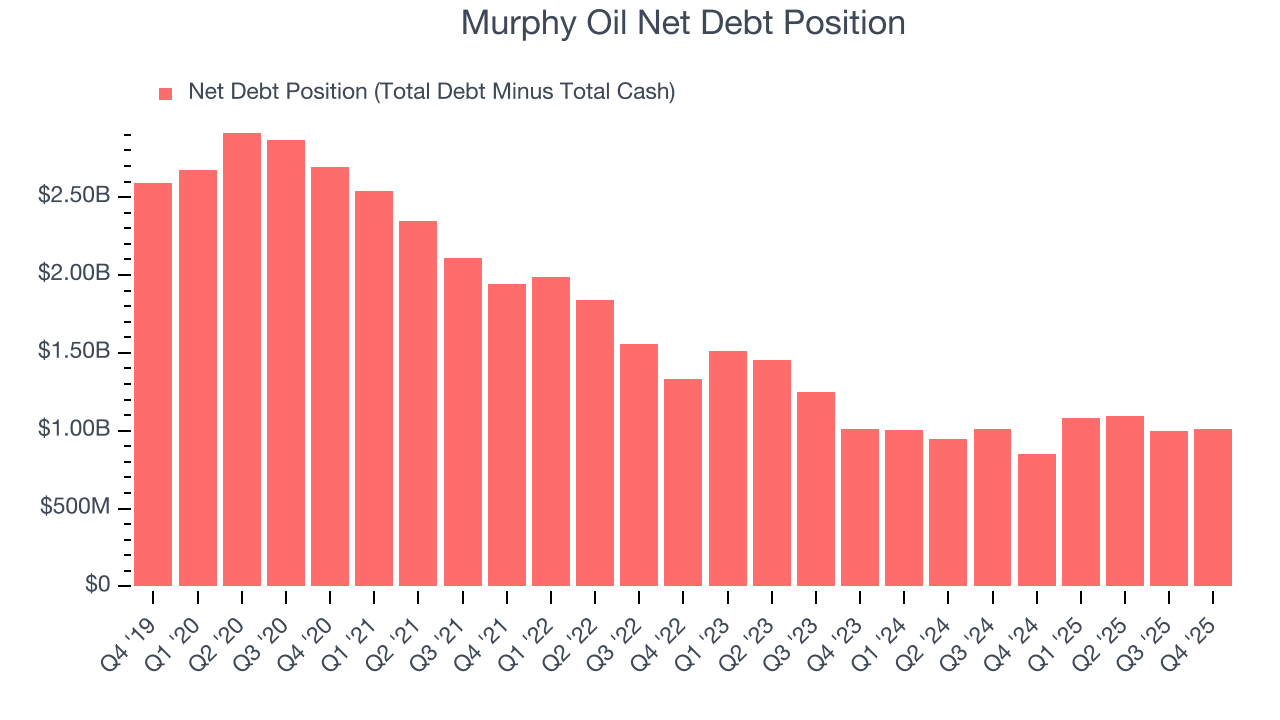
With $1.36 billion of EBITDA over the last 12 months, we view Murphy Oil’s 0.7× net-debt-to-EBITDA ratio as safe. We also see its $96.07 million of annual interest expenses as appropriate. The company’s profits give it plenty of breathing room, allowing it to continue investing in growth initiatives.
11. Key Takeaways from Murphy Oil’s Q4 Results
It was good to see Murphy Oil beat analysts’ EPS expectations this quarter. We were also happy its production narrowly outperformed Wall Street’s estimates. On the other hand, its EBITDA missed and its revenue fell slightly short of Wall Street’s estimates. Overall, this was a weaker quarter. The stock traded down 1.5% to $34.02 immediately after reporting.
12. Is Now The Time To Buy Murphy Oil?
Updated: March 24, 2026 at 1:15 AM EDT
The latest quarterly earnings matters, sure, but we actually think longer-term fundamentals and valuation matter more. Investors should consider all these pieces before deciding whether or not to invest in Murphy Oil.
Murphy Oil isn’t a terrible business, but it doesn’t pass our bar. For starters, its revenue growth was quite poor over the last five years, and analysts expect its demand to deteriorate over the next 12 months. While its powerful free cash flow generation enables it to stay ahead of the competition through consistent reinvestment of profits, the downside is its declining EBITDA margin shows the business has become less efficient. On top of that, its relatively low ROIC suggests management has struggled to find compelling investment opportunities.
Murphy Oil’s P/E ratio based on the next 12 months is 18.5x. Investors with a higher risk tolerance might like the company, but we think the potential downside is too great. We're pretty confident there are superior stocks to buy right now.
Wall Street analysts have a consensus one-year price target of $34.20 on the company (compared to the current share price of $37.55), implying they don’t see much short-term potential in Murphy Oil.